| Param | Original file | Final file |
|---|---|---|
| Filename | modeM0/AS1T05_008T01_9000004956_34638cztM0_level2.evt | modeM0/AS1T05_008T01_9000004956_34638cztM0_level2_quad_clean.evt |
| Size (bytes) | 1,262,750,400 | 162,293,760 |
| Size | 1.2 GB | 154.8 MB |
| Events in quadrant A | 6,708,794 | 1,031,230 |
| Events in quadrant B | 10,595,669 | 959,098 |
| Events in quadrant C | 7,207,892 | 1,020,468 |
| Events in quadrant D | 12,798,763 | 949,594 |
| Mode SS | |||
|---|---|---|---|
| Quadrant | BADHDUFLAG | Total packets | Discarded packets |
| A | 0 | 282 | 0 |
| B | 0 | 282 | 0 |
| C | 0 | 282 | 0 |
| D | 0 | 282 | 0 |
| Mode M9 | |||
|---|---|---|---|
| Quadrant | BADHDUFLAG | Total packets | Discarded packets |
| A | 0 | 56 | 0 |
| B | 0 | 56 | 0 |
| C | 0 | 56 | 0 |
| D | 0 | 56 | 0 |
| Mode M0 | |||
|---|---|---|---|
| Quadrant | BADHDUFLAG | Total packets | Discarded packets |
| A | 0 | 28472 | 4 |
| B | 0 | 39922 | 3 |
| C | 0 | 29233 | 3 |
| D | 0 | 47854 | 3 |
| Quadrant | Total seconds | Saturated seconds | Saturation percentage |
|---|---|---|---|
| A | 13819 | 56 | 0.405239% |
| B | 13819 | 1425 | 10.311889% |
| C | 13819 | 70 | 0.506549% |
| D | 13819 | 860 | 6.223316% |
Noise dominated data is calculated using 1-second bins in cleaned event files. If a bin has >2000 counts, and if more than 50% of those come from <1% of pixels, then it is considered to be noise-dominated and hence unusable.
| Quadrant | # 1 sec bins | Bins with >0 counts | Bins with >2000 counts | High rate bins dominated by noise | Noise dominated (total time) | Noise dominated (detector-on time) | Marked lightcurve |
|---|---|---|---|---|---|---|---|
| A | 19408 | 13822 | 20 | 20 | 0.10% | 0.14% | 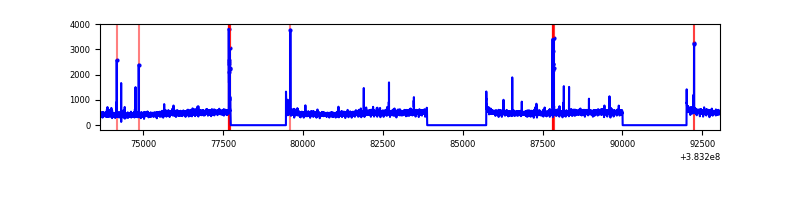 |
| B | 19408 | 13822 | 1116 | 1116 | 5.75% | 8.07% | 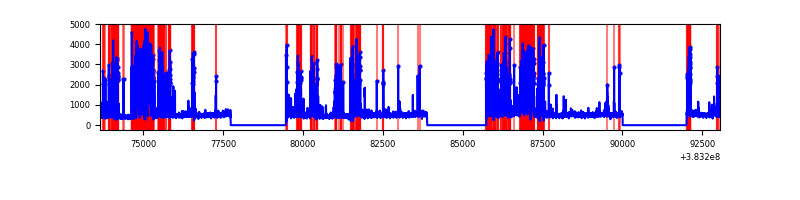 |
| C | 19408 | 13822 | 49 | 49 | 0.25% | 0.35% | 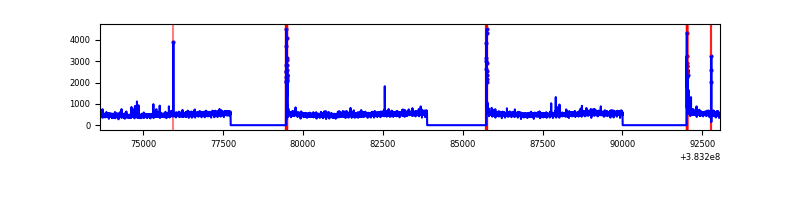 |
| D | 19408 | 13822 | 689 | 689 | 3.55% | 4.98% | 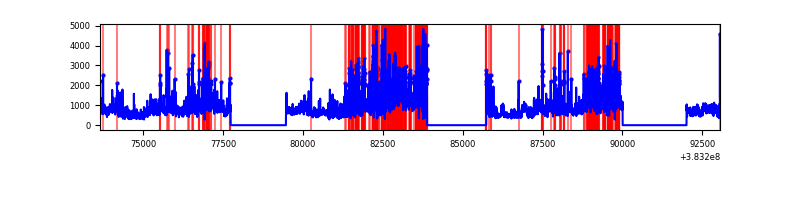 |
Top three noisy pixels from each quadrant. If the there are fewer than three noisy pixels in the level2.evt file, extra rows are filled as -1
| Pixel properties | Quadrant properties | ||||||
|---|---|---|---|---|---|---|---|
| Quadrant | DetID | PixID | Counts | Sigma | Mean | Median | Sigma |
| A | 9 | 143 | 93448 | 277.96 | 1672 | 1641 | 330.3 |
| A | 10 | 83 | 81829 | 242.78 | 1672 | 1641 | 330.3 |
| A | 15 | 174 | 50291 | 147.29 | 1672 | 1641 | 330.3 |
| B | 5 | 172 | 4072655 | 13801.04 | 1578 | 1536 | 295.0 |
| B | 4 | 171 | 107563 | 359.43 | 1578 | 1536 | 295.0 |
| B | 10 | 245 | 78424 | 260.65 | 1578 | 1536 | 295.0 |
| C | 15 | 214 | 574120 | 1576.21 | 1595 | 1608 | 363.2 |
| C | 0 | 10 | 179485 | 489.72 | 1595 | 1608 | 363.2 |
| C | 14 | 67 | 136808 | 372.22 | 1595 | 1608 | 363.2 |
| D | 8 | 195 | 3080372 | 8002.26 | 1575 | 1533 | 384.7 |
| D | 12 | 235 | 1484996 | 3855.69 | 1575 | 1533 | 384.7 |
| D | 13 | 249 | 499827 | 1295.12 | 1575 | 1533 | 384.7 |
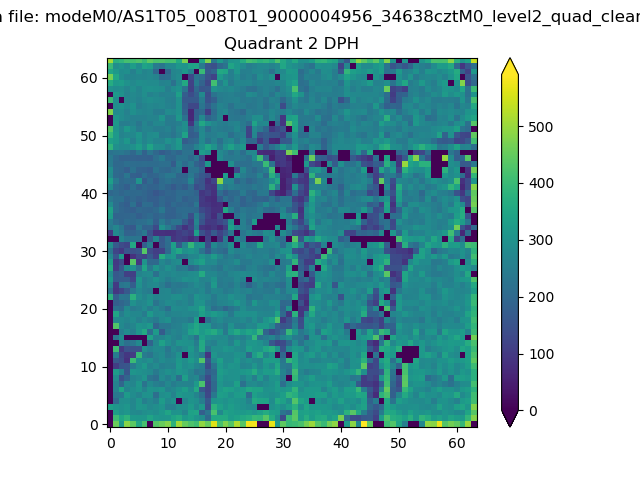
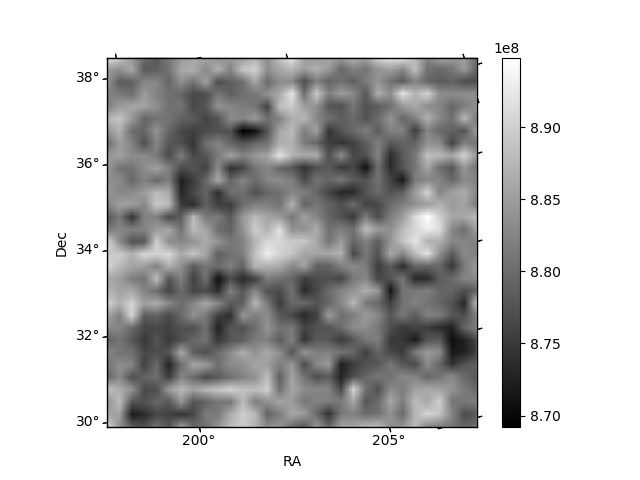
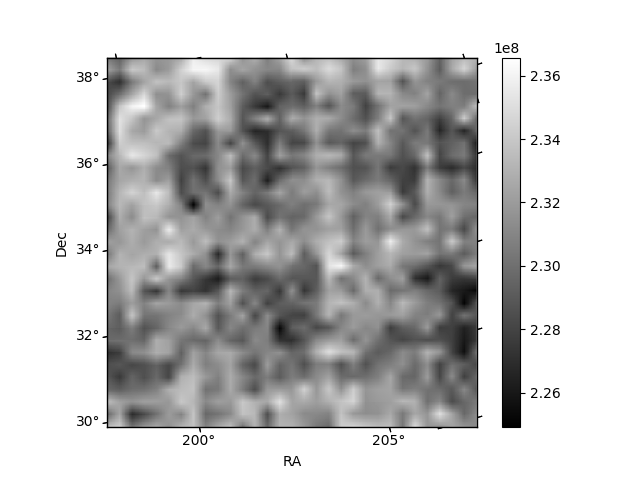
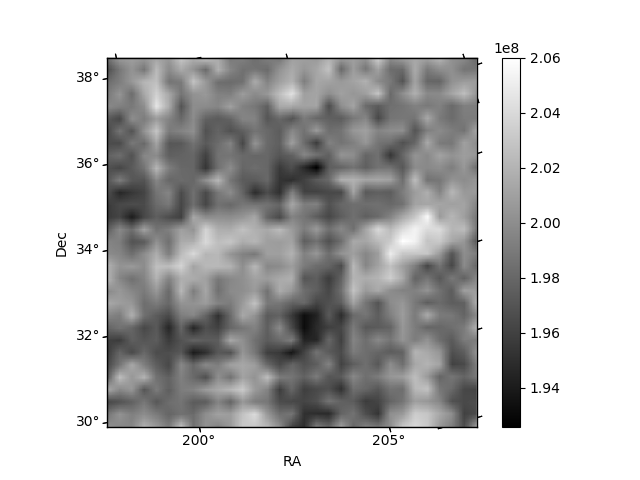
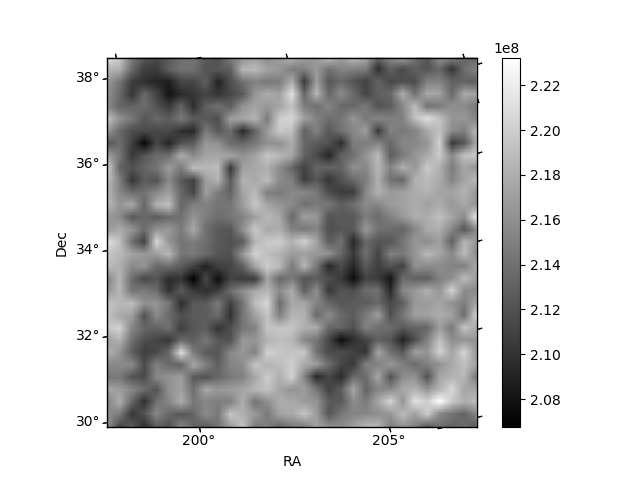
Histogram calculated using DETX and DETY for each event in the final _common_clean file
| Quadrant A | 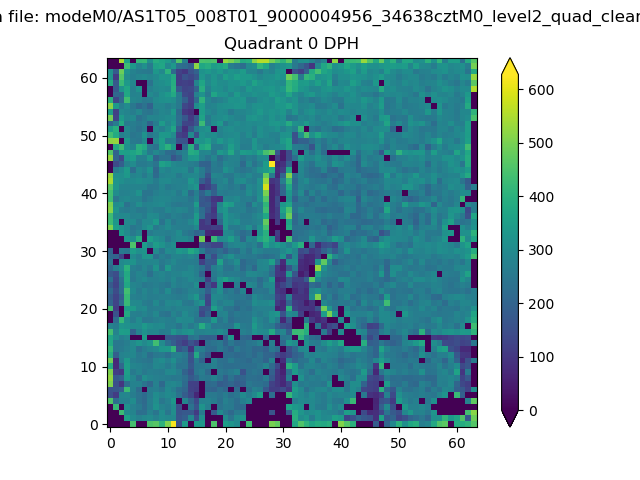 |
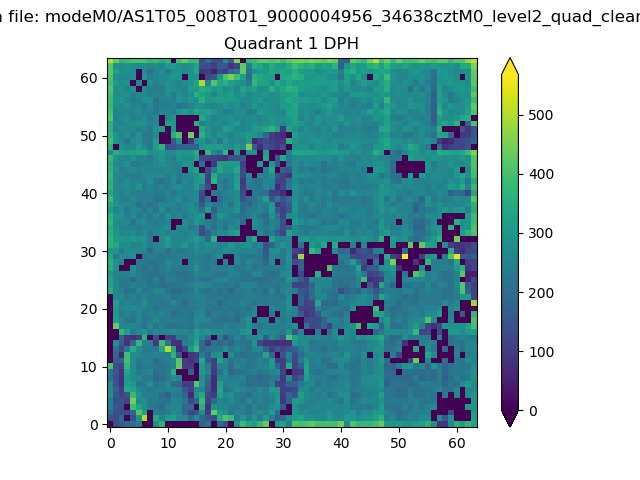 |
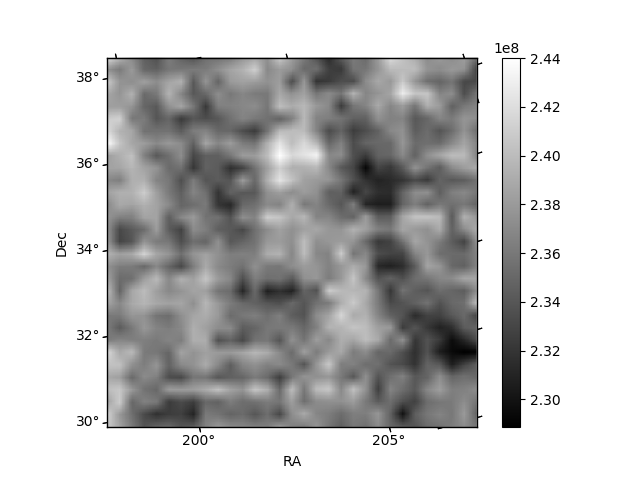
Quadrant B |
|---|---|---|---|
| Quadrant D | 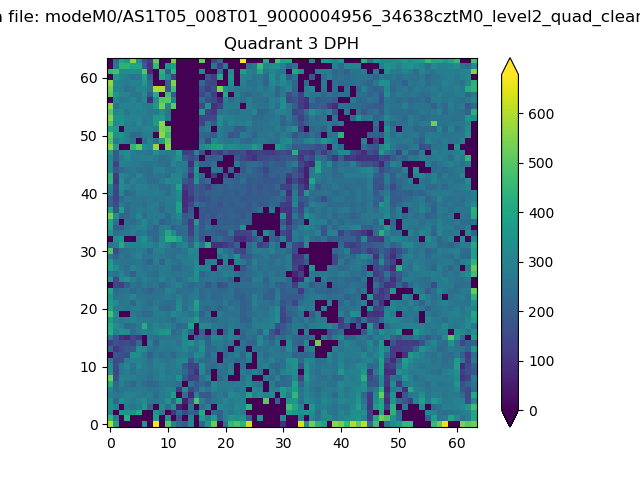 |
 |
Quadrant C |
| Plot type | Count rate plots | Images |
|---|---|---|
| Comparison with Poisson distribution Blue bars denote a histogram of data divided into 1 sec bins. Red curve is a Poisson curve with rate = median count rate of data. |
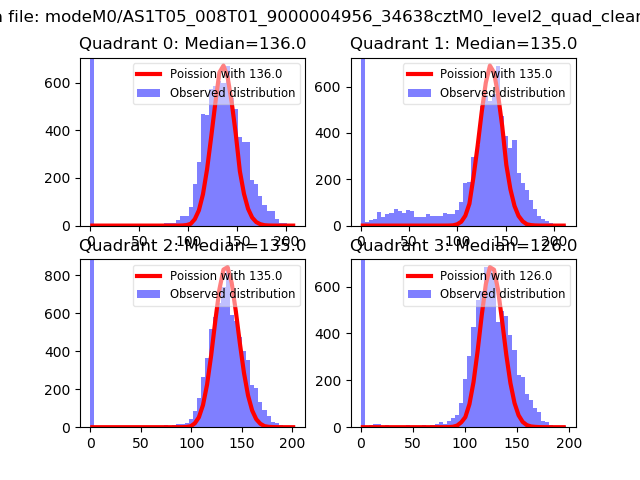 |
 |
| Quadrant-wise count rates Data is divided into 100 sec bins |
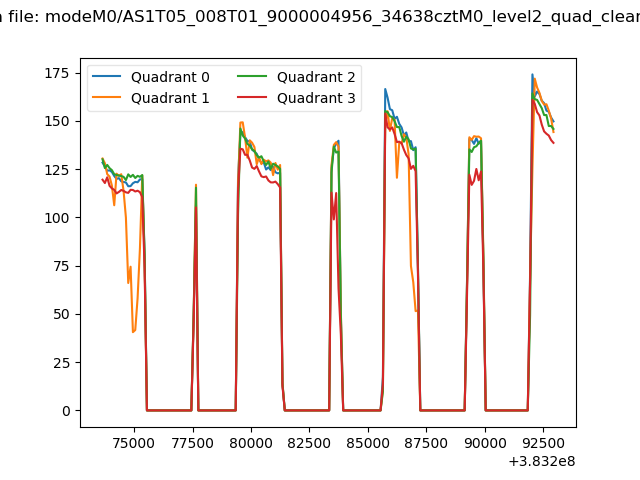 |
|
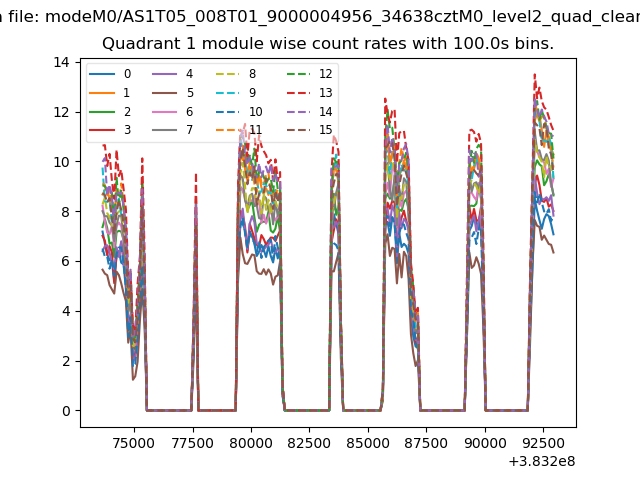
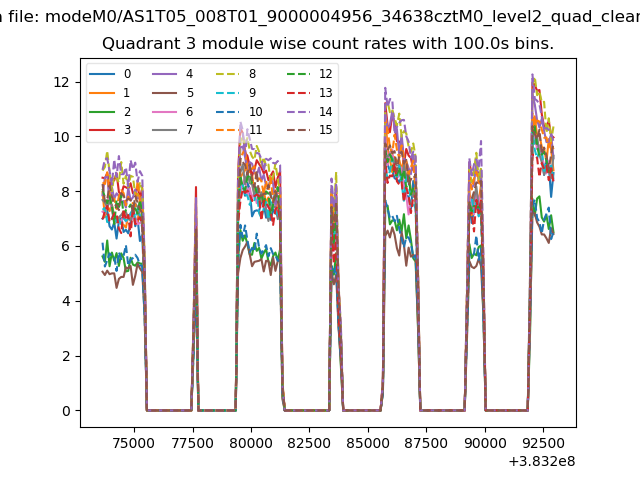
| Module-wise count rates for Quadrant A Data is divided into 100 sec bins |
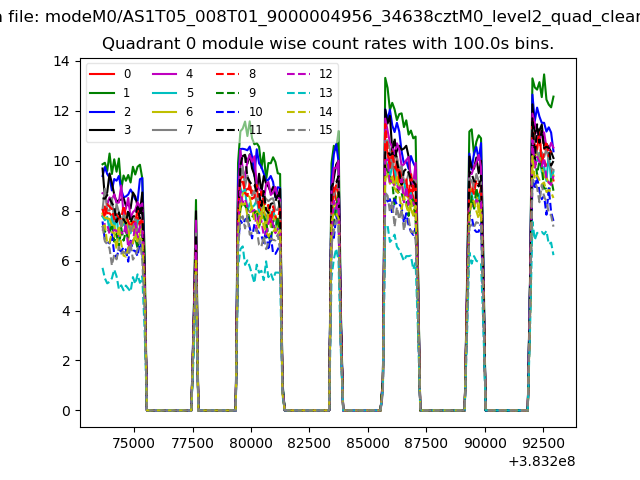 |
 |
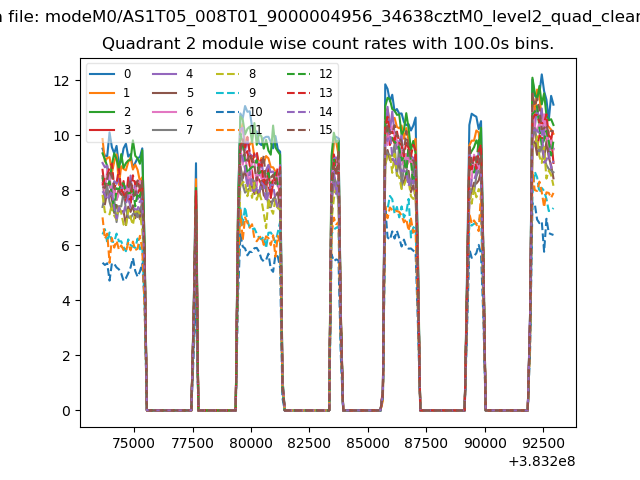
| Module-wise count rates for Quadrant B Data is divided into 100 sec bins |
 |
 |
| Module-wise count rates for Quadrant C Data is divided into 100 sec bins |
 |
 |
| Module-wise count rates for Quadrant D Data is divided into 100 sec bins |
 |
 |
| Parameter | Plot |
|---|---|
| CZT HV Monitor | 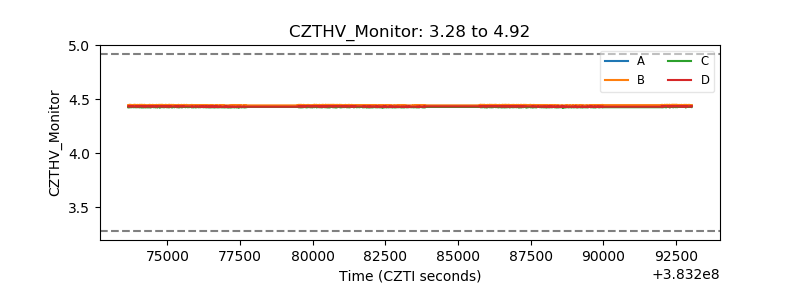 |
| D_VDD | 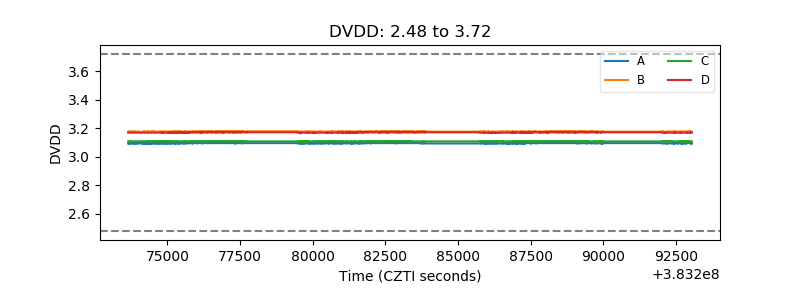 |
| Temperature 1 | 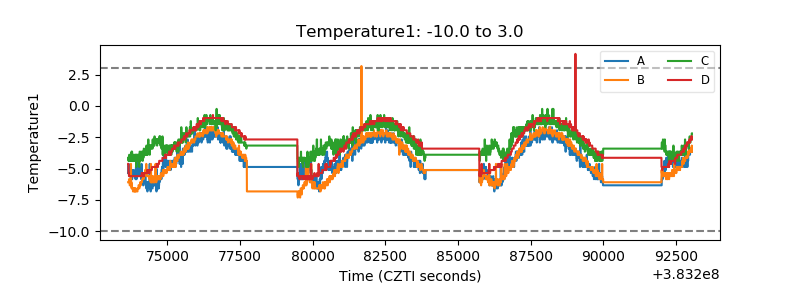 |
| Veto HV Monitor | 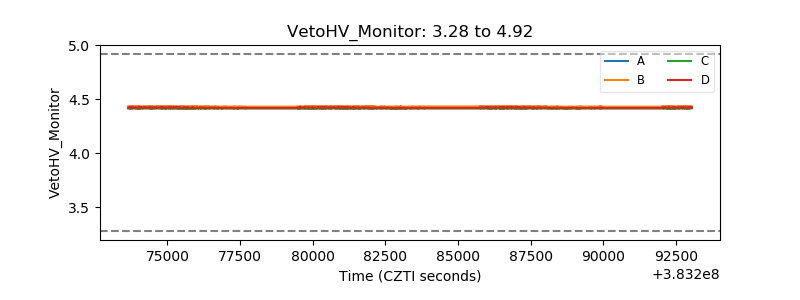 |
| Veto LLD | 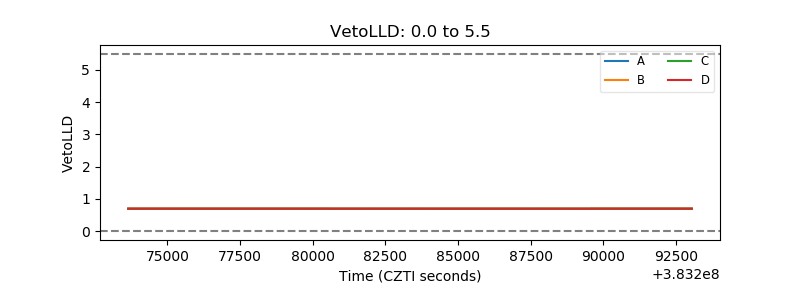 |
| Alpha Counter | 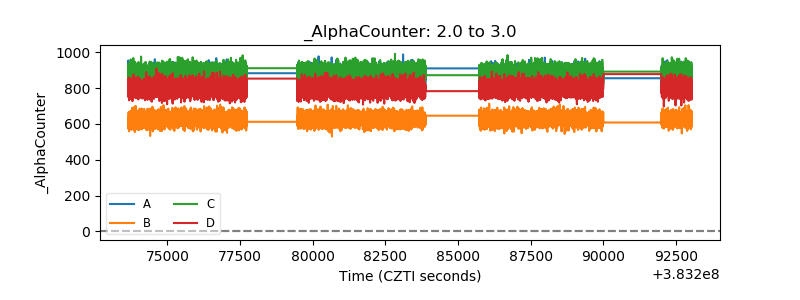 |
| _CPM_Rate | 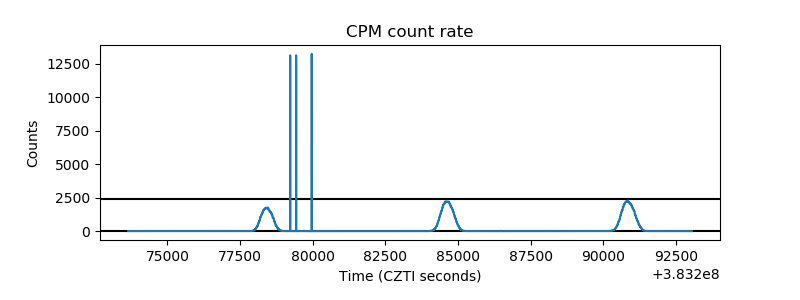 |
| CZT Counter | 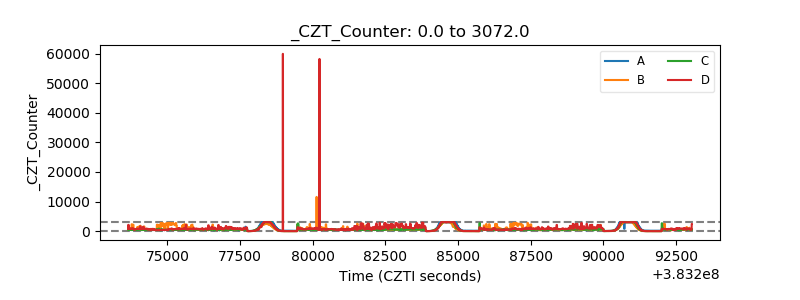 |
| +2.5 Volts monitor | 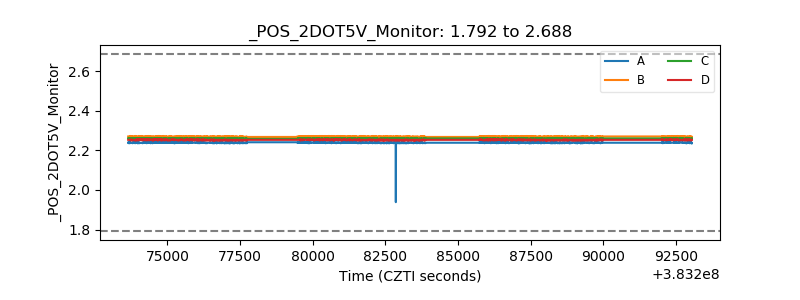 |
| +5 Volts monitor | 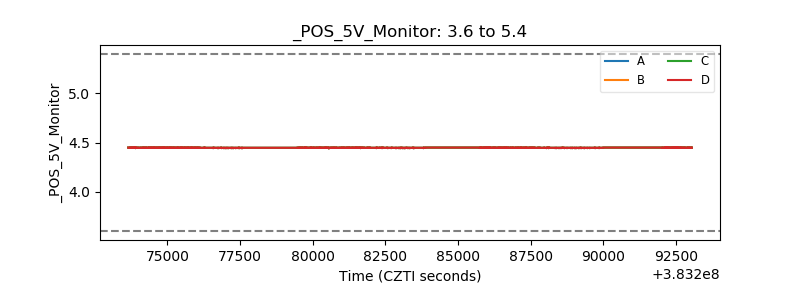 |
| _ROLL_ROT | 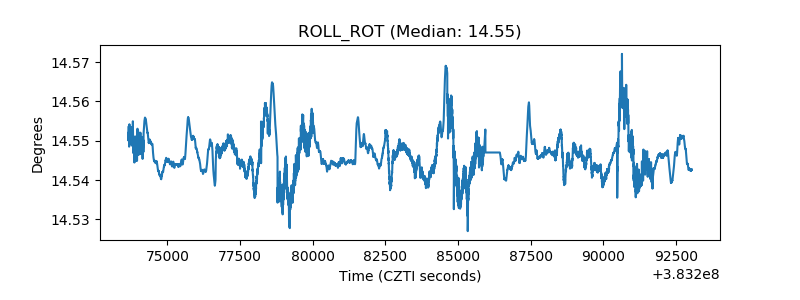 |
| _Roll_DEC | 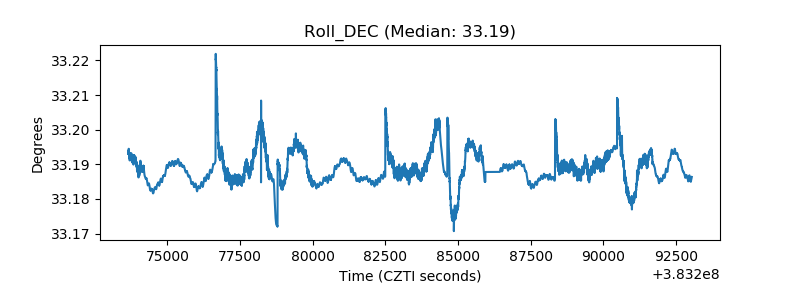 |
| _Roll_RA | 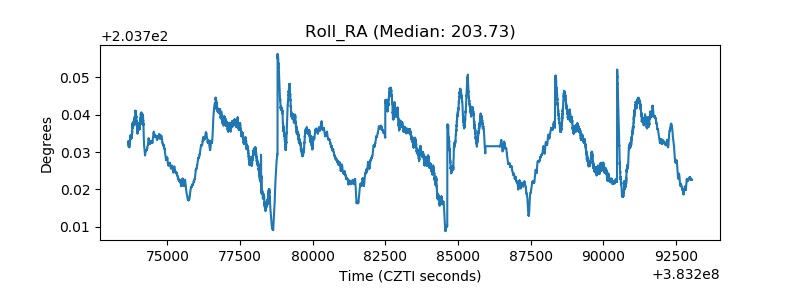 |
| Veto Counter | 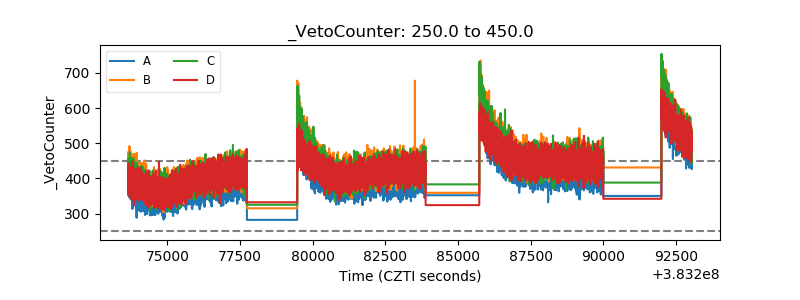 |