| Param | Original file | Final file |
|---|---|---|
| Filename | modeM0/AS1T05_008T01_9000004956_34637cztM0_level2.evt | modeM0/AS1T05_008T01_9000004956_34637cztM0_level2_quad_clean.evt |
| Size (bytes) | 404,078,400 | 65,574,720 |
| Size | 385.4 MB | 62.5 MB |
| Events in quadrant A | 2,269,280 | 429,467 |
| Events in quadrant B | 3,206,457 | 420,170 |
| Events in quadrant C | 2,482,399 | 420,546 |
| Events in quadrant D | 3,961,727 | 387,495 |
| Mode SS | |||
|---|---|---|---|
| Quadrant | BADHDUFLAG | Total packets | Discarded packets |
| A | 0 | 107 | 11 |
| B | 0 | 108 | 8 |
| C | 0 | 106 | 16 |
| D | 0 | 108 | 7 |
| Mode M9 | |||
|---|---|---|---|
| Quadrant | BADHDUFLAG | Total packets | Discarded packets |
| A | 0 | 33 | 1 |
| B | 0 | 33 | 0 |
| C | 0 | 33 | 0 |
| D | 0 | 34 | 0 |
| Mode M0 | |||
|---|---|---|---|
| Quadrant | BADHDUFLAG | Total packets | Discarded packets |
| A | 0 | 10865 | 1130 |
| B | 0 | 14028 | 1524 |
| C | 0 | 11296 | 1287 |
| D | 0 | 19504 | 4656 |
| Quadrant | Total seconds | Saturated seconds | Saturation percentage |
|---|---|---|---|
| A | 4763 | 11 | 0.230947% |
| B | 4734 | 243 | 5.133080% |
| C | 4734 | 35 | 0.739332% |
| D | 4409 | 282 | 6.396008% |
Noise dominated data is calculated using 1-second bins in cleaned event files. If a bin has >2000 counts, and if more than 50% of those come from <1% of pixels, then it is considered to be noise-dominated and hence unusable.
| Quadrant | # 1 sec bins | Bins with >0 counts | Bins with >2000 counts | High rate bins dominated by noise | Noise dominated (total time) | Noise dominated (detector-on time) | Marked lightcurve |
|---|---|---|---|---|---|---|---|
| A | 7277 | 5054 | 1 | 1 | 0.01% | 0.02% | 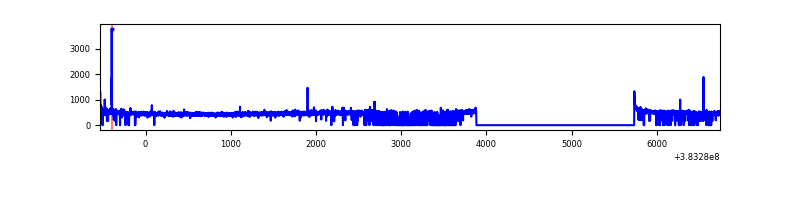 |
| B | 7277 | 5061 | 159 | 159 | 2.18% | 3.14% | 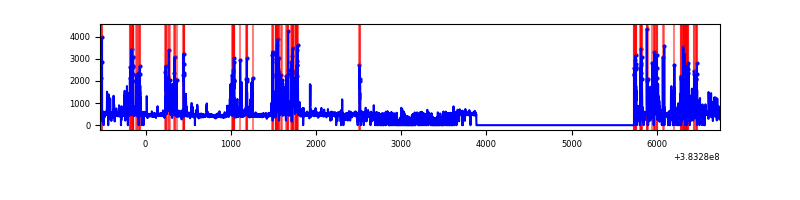 |
| C | 7277 | 5054 | 21 | 21 | 0.29% | 0.42% | 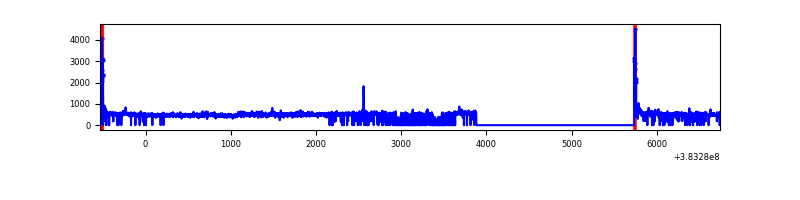 |
| D | 7277 | 4708 | 218 | 218 | 3.00% | 4.63% | 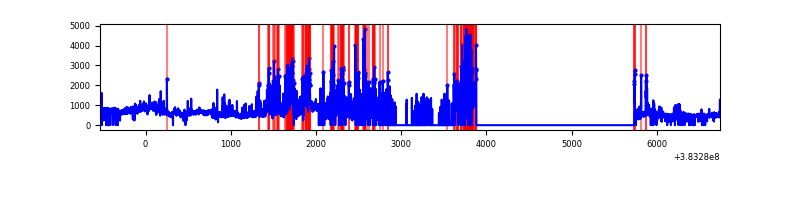 |
Top three noisy pixels from each quadrant. If the there are fewer than three noisy pixels in the level2.evt file, extra rows are filled as -1
| Pixel properties | Quadrant properties | ||||||
|---|---|---|---|---|---|---|---|
| Quadrant | DetID | PixID | Counts | Sigma | Mean | Median | Sigma |
| A | 10 | 83 | 41381 | 360.47 | 569 | 559 | 113.2 |
| A | 9 | 143 | 18859 | 161.59 | 569 | 559 | 113.2 |
| A | 13 | 254 | 8358 | 68.87 | 569 | 559 | 113.2 |
| B | 5 | 172 | 939611 | 8890.74 | 550 | 536 | 105.6 |
| B | 4 | 171 | 54047 | 506.62 | 550 | 536 | 105.6 |
| B | 5 | 200 | 22610 | 208.99 | 550 | 536 | 105.6 |
| C | 15 | 214 | 200460 | 1607.89 | 538 | 541 | 124.3 |
| C | 0 | 10 | 92660 | 740.89 | 538 | 541 | 124.3 |
| C | 14 | 67 | 72659 | 580.02 | 538 | 541 | 124.3 |
| D | 8 | 195 | 775277 | 6392.66 | 488 | 474 | 121.2 |
| D | 12 | 235 | 531372 | 4380.28 | 488 | 474 | 121.2 |
| D | 13 | 249 | 331091 | 2727.82 | 488 | 474 | 121.2 |
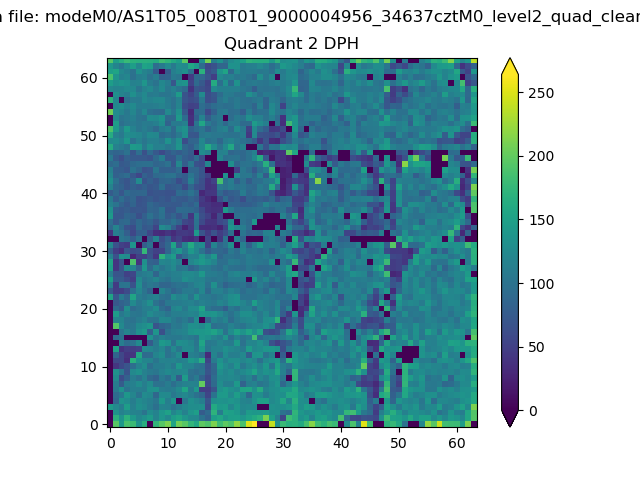
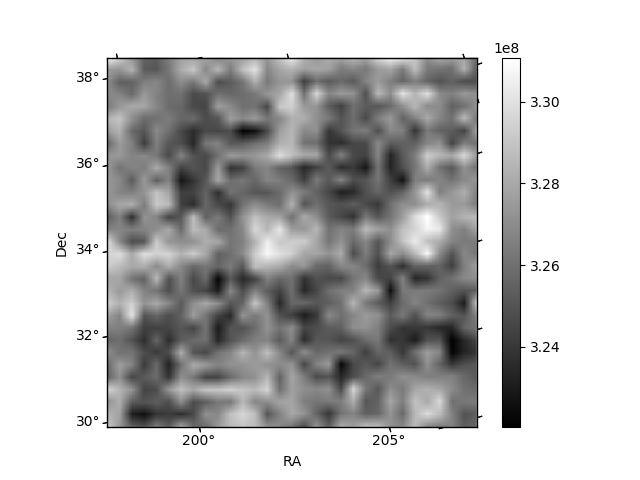
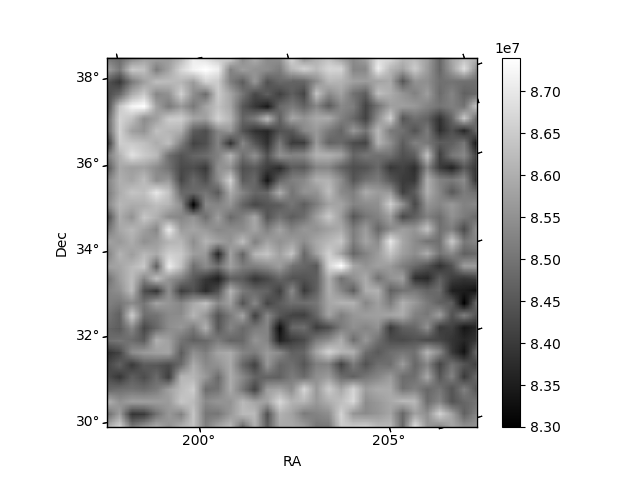
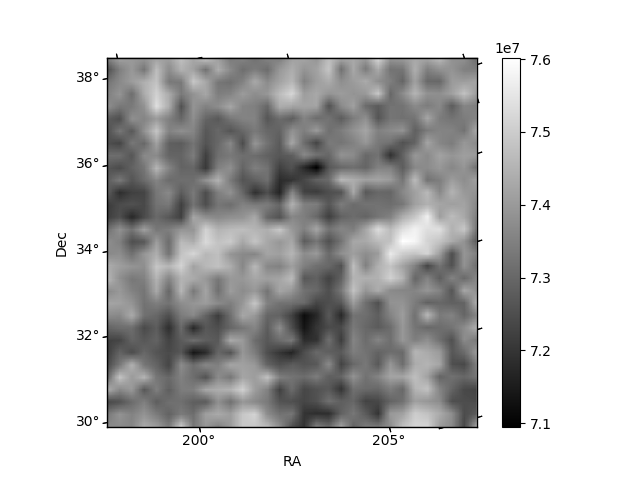
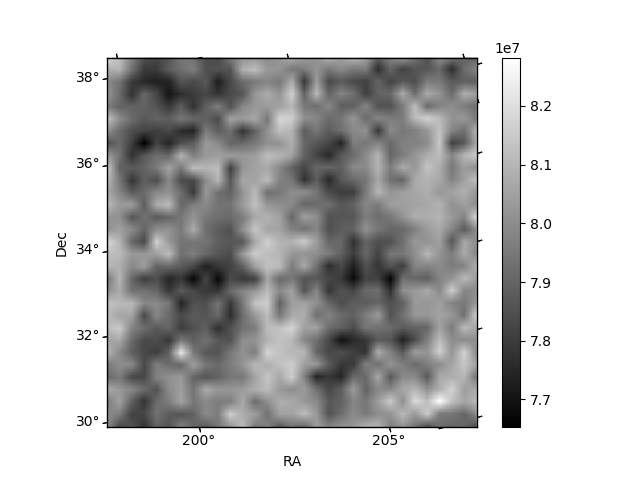
Histogram calculated using DETX and DETY for each event in the final _common_clean file
| Quadrant A | 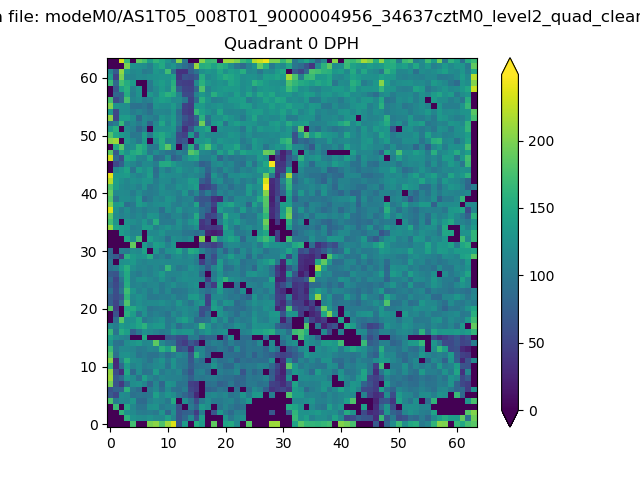 |
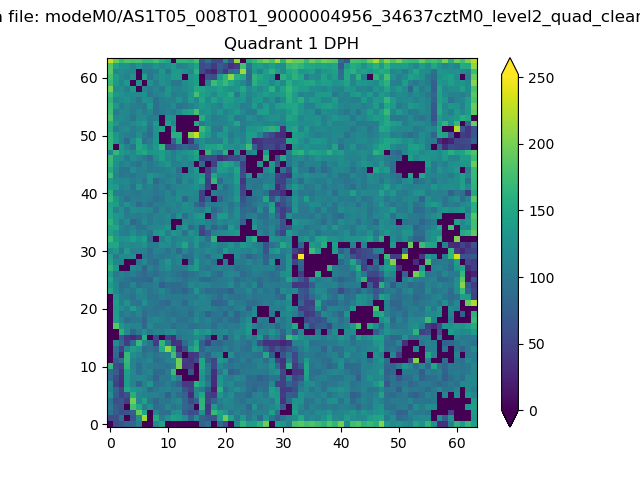 |
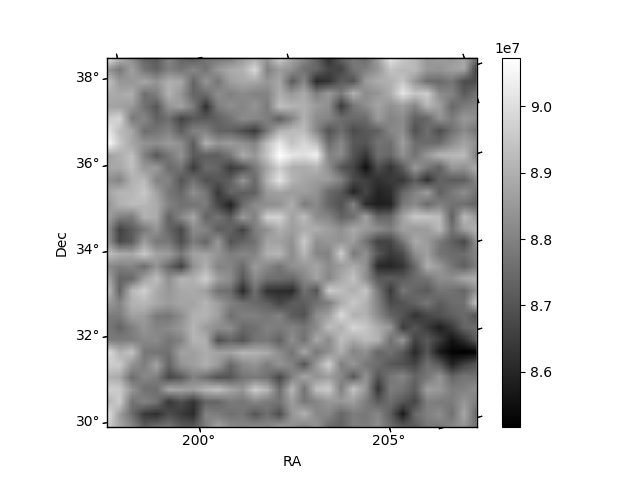
Quadrant B |
|---|---|---|---|
| Quadrant D | 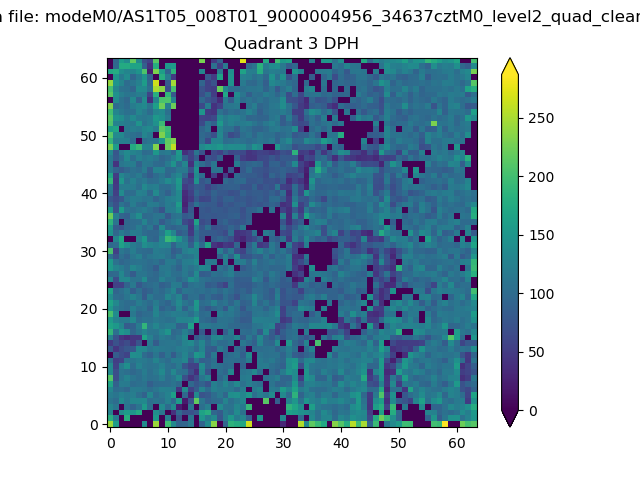 |
 |
Quadrant C |
| Plot type | Count rate plots | Images |
|---|---|---|
| Comparison with Poisson distribution Blue bars denote a histogram of data divided into 1 sec bins. Red curve is a Poisson curve with rate = median count rate of data. |
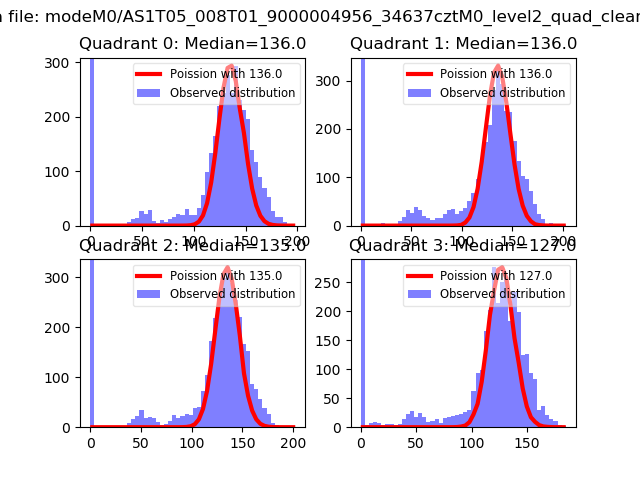 |
 |
| Quadrant-wise count rates Data is divided into 100 sec bins |
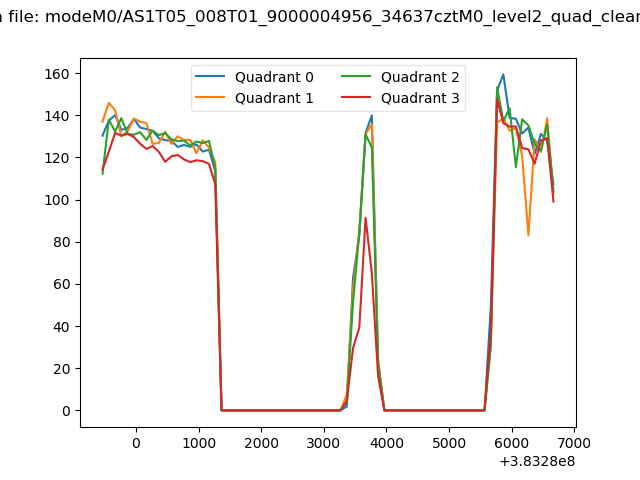 |
|
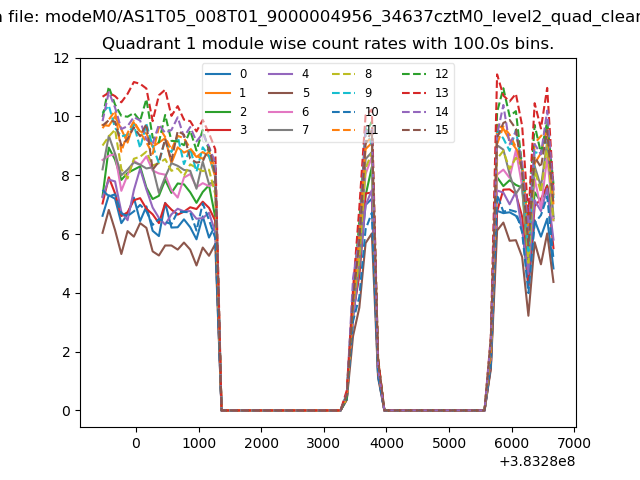
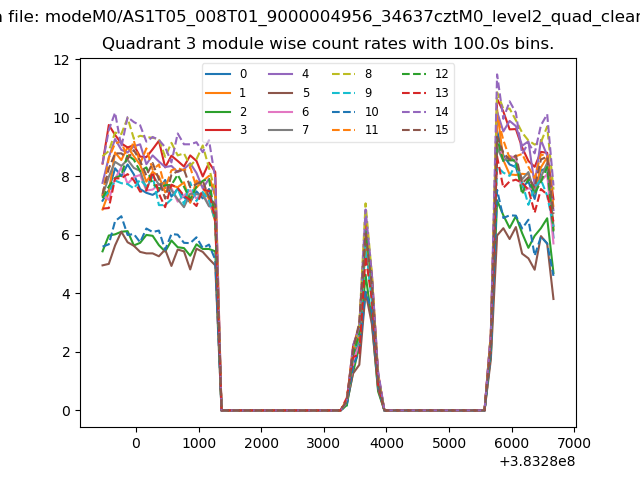
| Module-wise count rates for Quadrant A Data is divided into 100 sec bins |
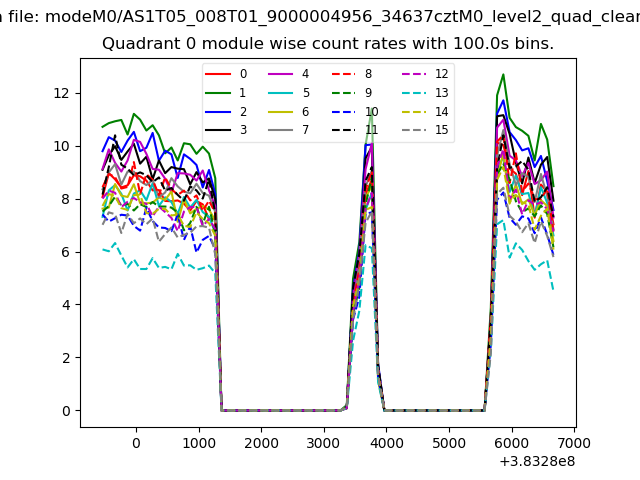 |
 |
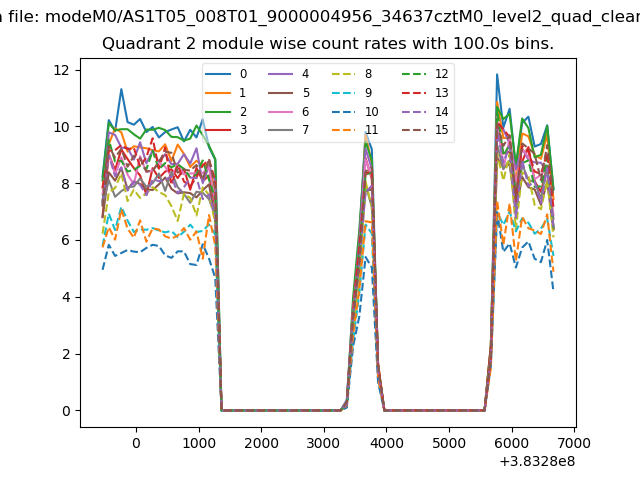
| Module-wise count rates for Quadrant B Data is divided into 100 sec bins |
 |
 |
| Module-wise count rates for Quadrant C Data is divided into 100 sec bins |
 |
 |
| Module-wise count rates for Quadrant D Data is divided into 100 sec bins |
 |
 |
| Parameter | Plot |
|---|---|
| CZT HV Monitor | 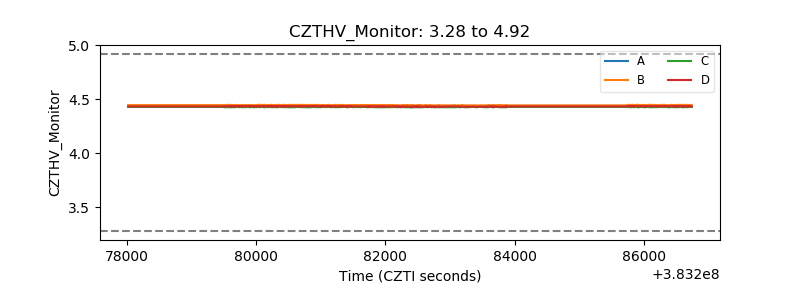 |
| D_VDD | 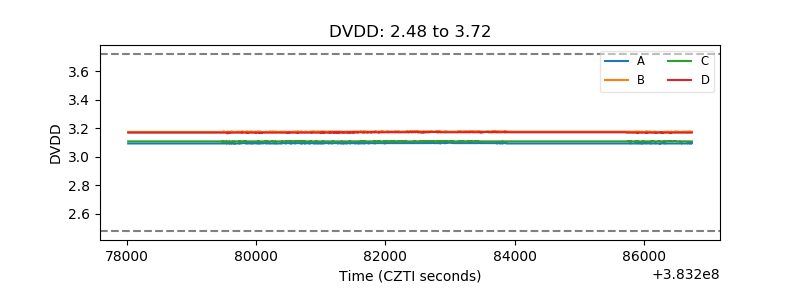 |
| Temperature 1 | 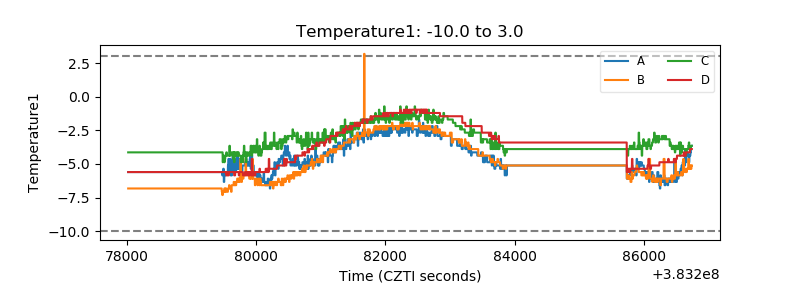 |
| Veto HV Monitor | 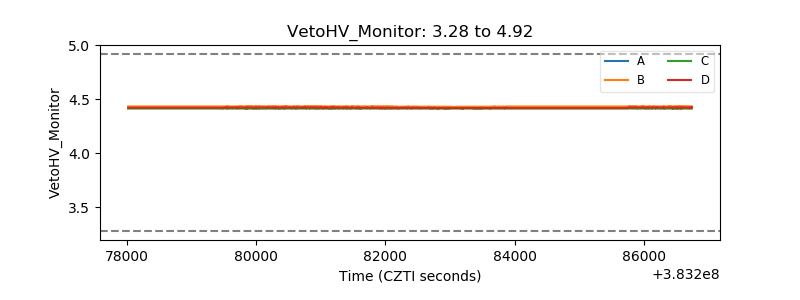 |
| Veto LLD | 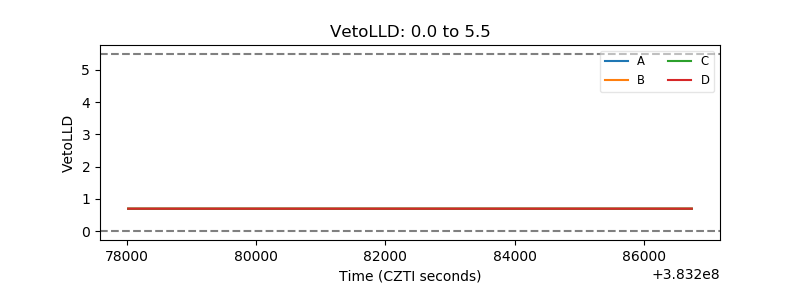 |
| Alpha Counter | 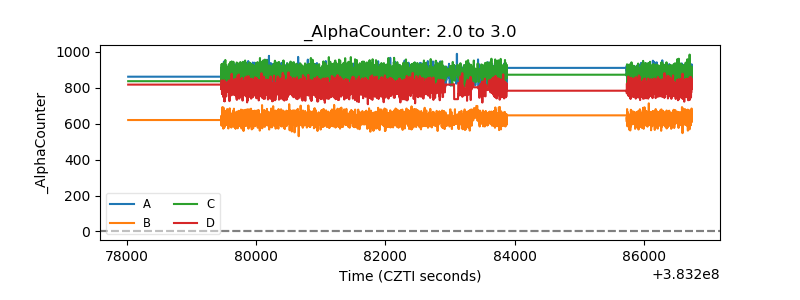 |
| _CPM_Rate | 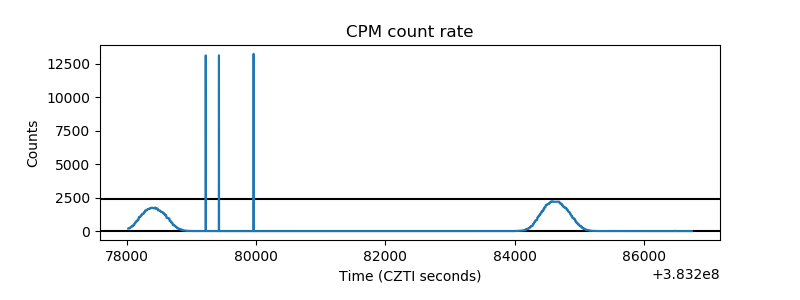 |
| CZT Counter | 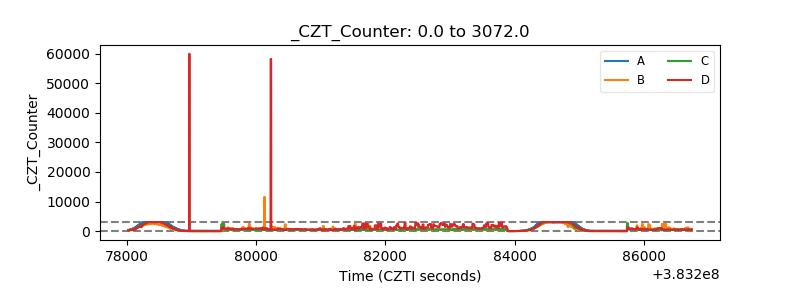 |
| +2.5 Volts monitor | 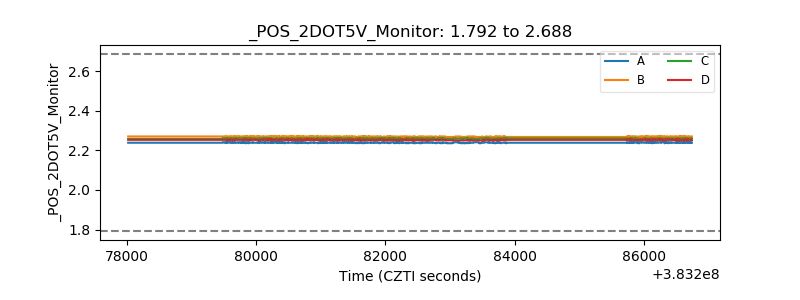 |
| +5 Volts monitor | 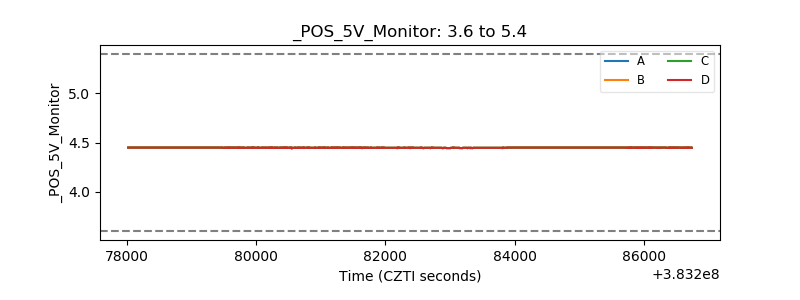 |
| _ROLL_ROT | 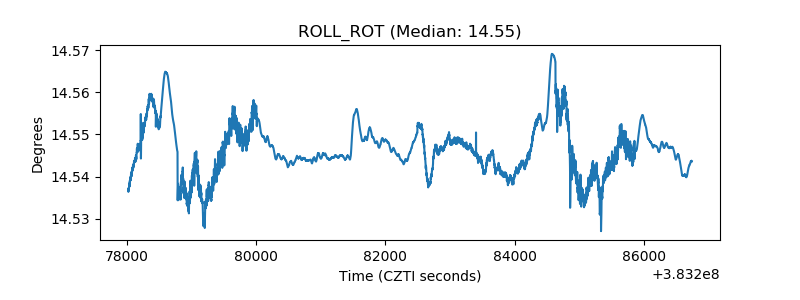 |
| _Roll_DEC | 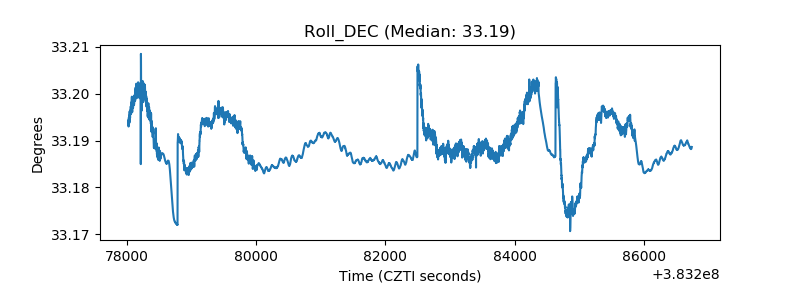 |
| _Roll_RA | 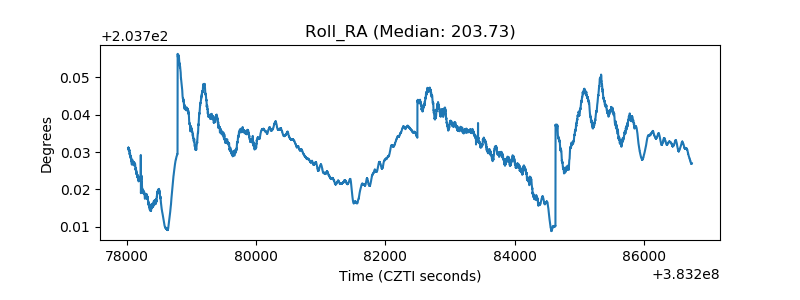 |
| Veto Counter | 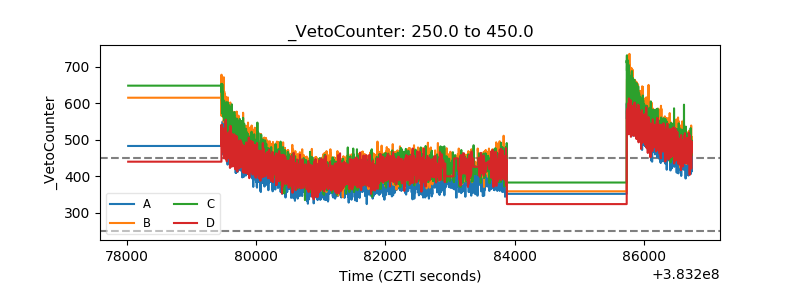 |