| Param | Original file | Final file |
|---|---|---|
| Filename | modeM0/AS1T05_008T01_9000004956_34633cztM0_level2.evt | modeM0/AS1T05_008T01_9000004956_34633cztM0_level2_quad_clean.evt |
| Size (bytes) | 757,488,960 | 135,230,400 |
| Size | 722.4 MB | 129.0 MB |
| Events in quadrant A | 4,023,098 | 890,678 |
| Events in quadrant B | 5,973,132 | 871,857 |
| Events in quadrant C | 4,300,995 | 897,890 |
| Events in quadrant D | 8,052,526 | 828,101 |
| Mode SS | |||
|---|---|---|---|
| Quadrant | BADHDUFLAG | Total packets | Discarded packets |
| A | 0 | 178 | 0 |
| B | 0 | 178 | 0 |
| C | 0 | 178 | 0 |
| D | 0 | 178 | 0 |
| Mode M9 | |||
|---|---|---|---|
| Quadrant | BADHDUFLAG | Total packets | Discarded packets |
| A | 0 | 16 | 0 |
| B | 0 | 16 | 0 |
| C | 0 | 16 | 0 |
| D | 0 | 17 | 0 |
| Mode M0 | |||
|---|---|---|---|
| Quadrant | BADHDUFLAG | Total packets | Discarded packets |
| A | 0 | 18110 | 3 |
| B | 0 | 23680 | 2 |
| C | 0 | 18172 | 2 |
| D | 0 | 30096 | 2 |
| Quadrant | Total seconds | Saturated seconds | Saturation percentage |
|---|---|---|---|
| A | 8740 | 12 | 0.137300% |
| B | 8740 | 495 | 5.663616% |
| C | 8740 | 42 | 0.480549% |
| D | 8740 | 409 | 4.679634% |
Noise dominated data is calculated using 1-second bins in cleaned event files. If a bin has >2000 counts, and if more than 50% of those come from <1% of pixels, then it is considered to be noise-dominated and hence unusable.
| Quadrant | # 1 sec bins | Bins with >0 counts | Bins with >2000 counts | High rate bins dominated by noise | Noise dominated (total time) | Noise dominated (detector-on time) | Marked lightcurve |
|---|---|---|---|---|---|---|---|
| A | 10053 | 8741 | 1 | 1 | 0.01% | 0.01% | 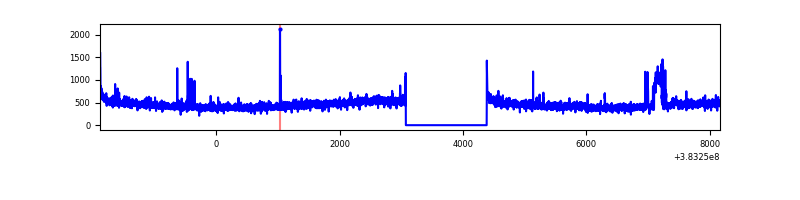 |
| B | 10053 | 8741 | 328 | 328 | 3.26% | 3.75% | 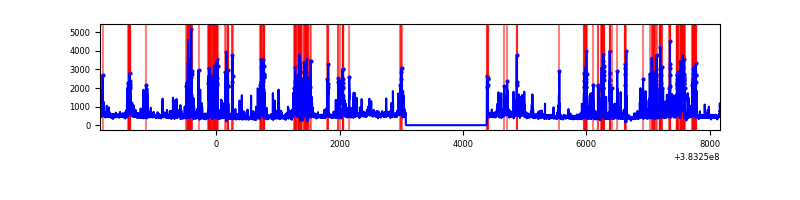 |
| C | 10053 | 8741 | 23 | 23 | 0.23% | 0.26% | 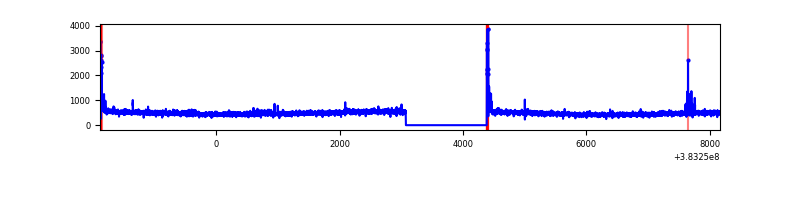 |
| D | 10053 | 8741 | 339 | 339 | 3.37% | 3.88% | 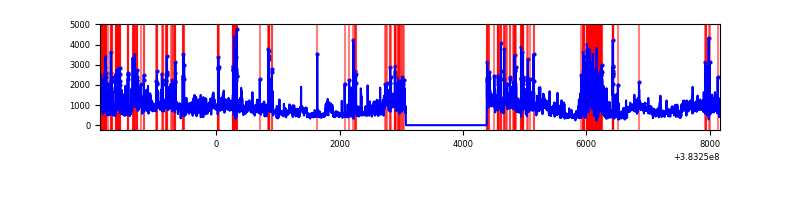 |
Top three noisy pixels from each quadrant. If the there are fewer than three noisy pixels in the level2.evt file, extra rows are filled as -1
| Pixel properties | Quadrant properties | ||||||
|---|---|---|---|---|---|---|---|
| Quadrant | DetID | PixID | Counts | Sigma | Mean | Median | Sigma |
| A | 15 | 169 | 138568 | 701.26 | 979 | 958 | 196.2 |
| A | 10 | 83 | 54106 | 270.84 | 979 | 958 | 196.2 |
| A | 9 | 143 | 26358 | 129.44 | 979 | 958 | 196.2 |
| B | 5 | 172 | 1845965 | 10074.05 | 957 | 931 | 183.1 |
| B | 4 | 232 | 144002 | 781.18 | 957 | 931 | 183.1 |
| B | 0 | 189 | 130451 | 707.19 | 957 | 931 | 183.1 |
| C | 15 | 214 | 360699 | 1621.13 | 953 | 960 | 221.9 |
| C | 0 | 10 | 112358 | 502.01 | 953 | 960 | 221.9 |
| C | 14 | 67 | 74260 | 330.32 | 953 | 960 | 221.9 |
| D | 8 | 195 | 2625191 | 10521.55 | 929 | 909 | 249.4 |
| D | 3 | 13 | 489728 | 1959.83 | 929 | 909 | 249.4 |
| D | 7 | 223 | 207085 | 826.62 | 929 | 909 | 249.4 |
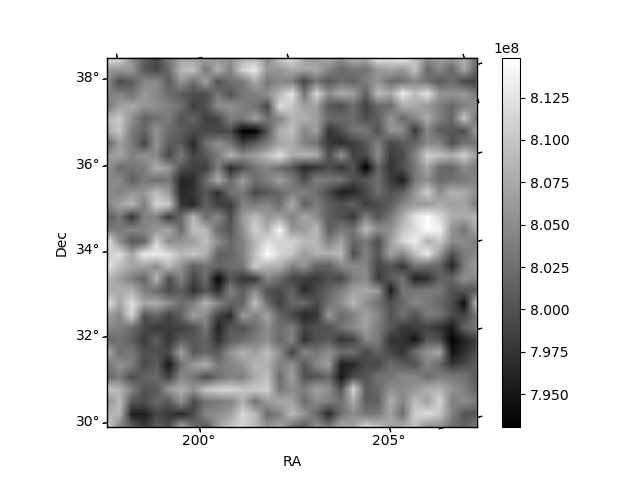
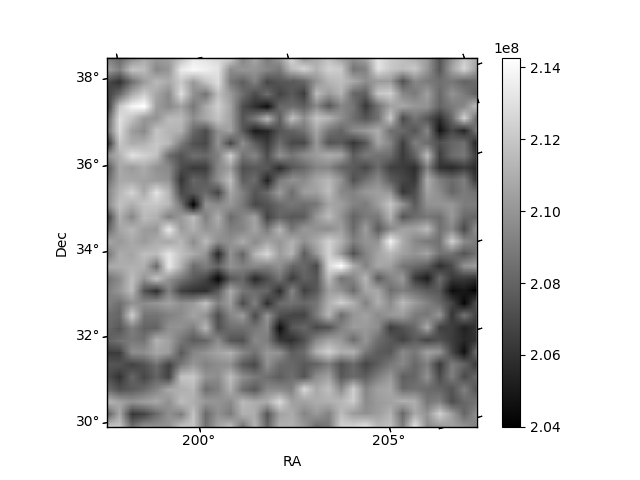
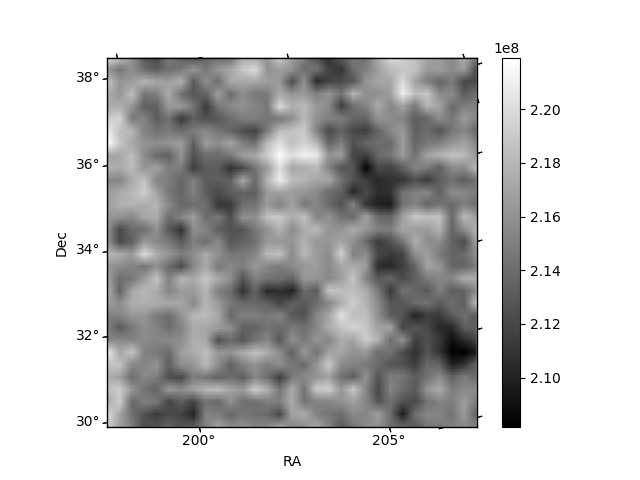
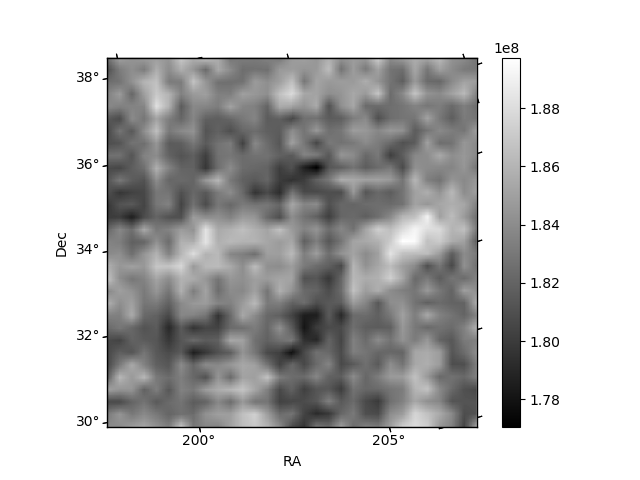
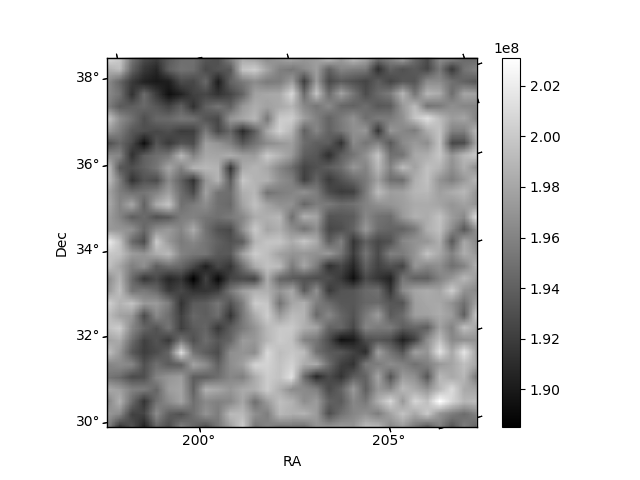
Histogram calculated using DETX and DETY for each event in the final _common_clean file
| Quadrant A | 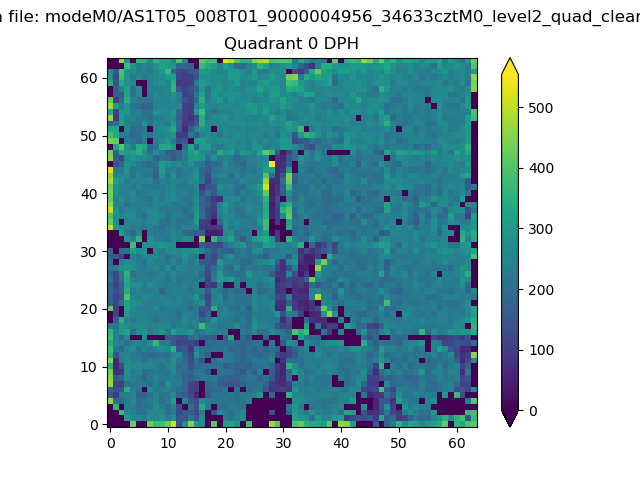 |
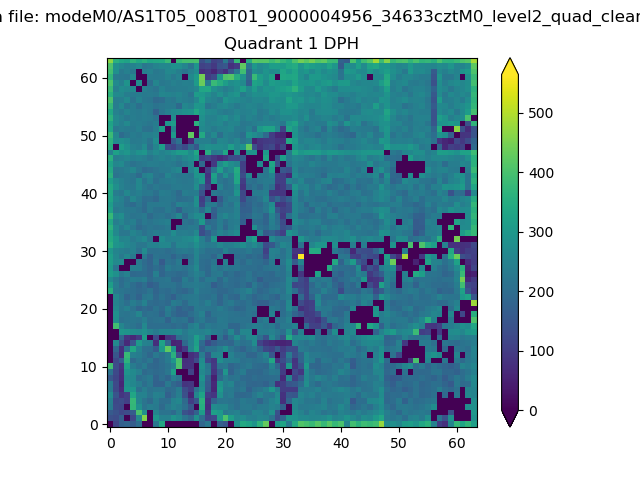 |
Quadrant B |
|---|---|---|---|
| Quadrant D | 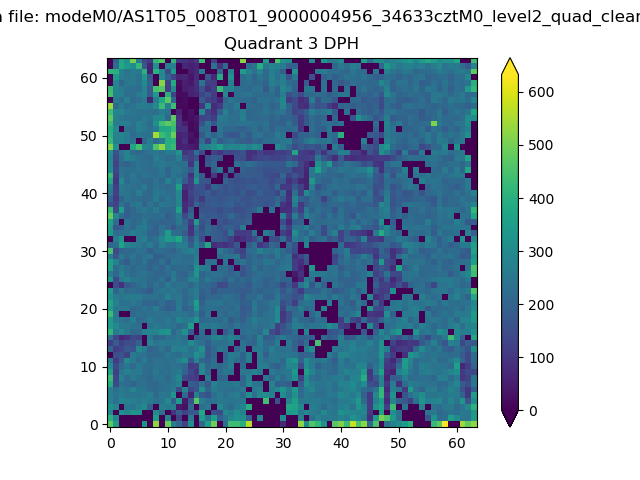 |
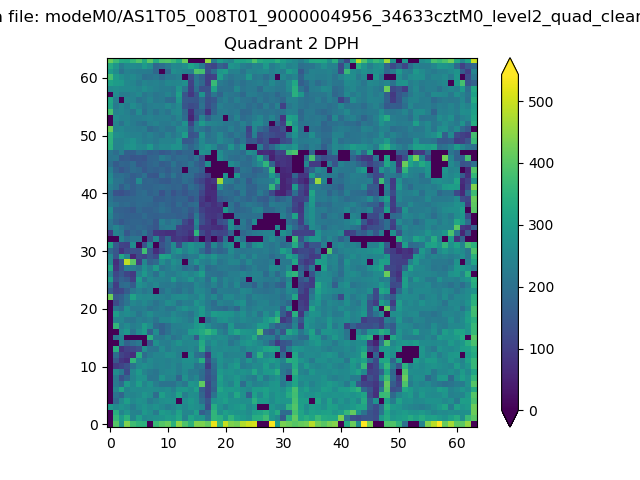 |
Quadrant C |
| Plot type | Count rate plots | Images |
|---|---|---|
| Comparison with Poisson distribution Blue bars denote a histogram of data divided into 1 sec bins. Red curve is a Poisson curve with rate = median count rate of data. |
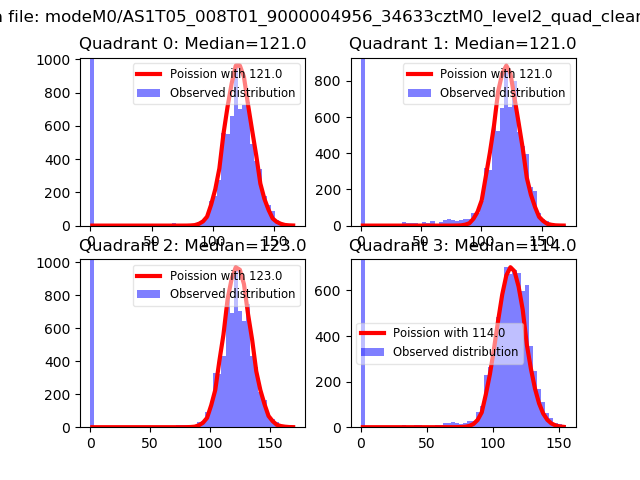 |
 |
| Quadrant-wise count rates Data is divided into 100 sec bins |
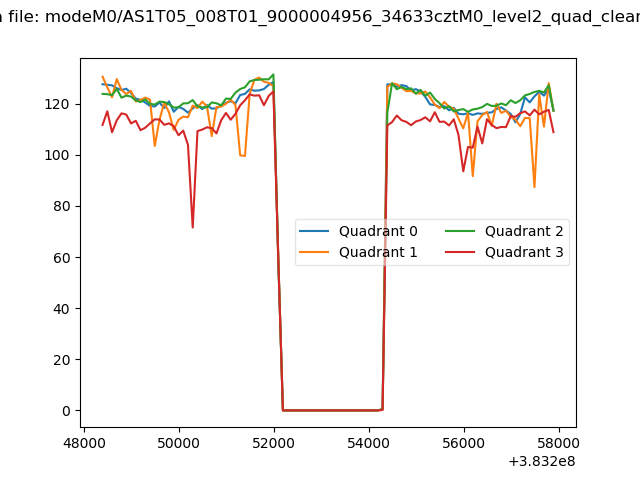 |
|
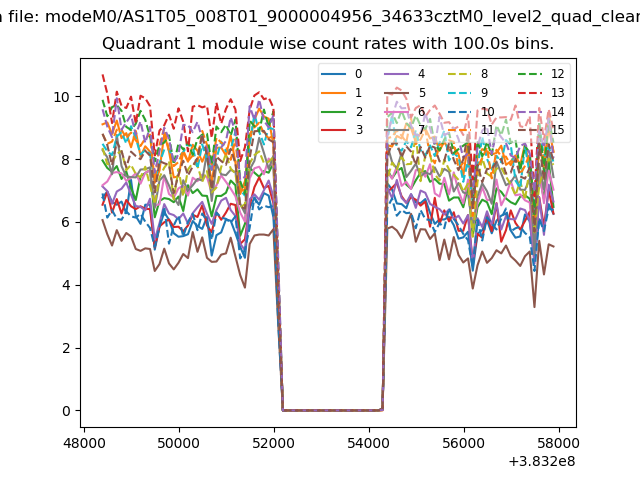
| Module-wise count rates for Quadrant A Data is divided into 100 sec bins |
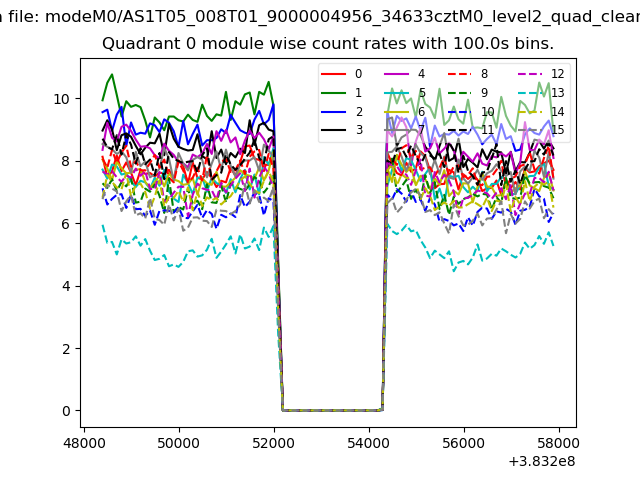 |
 |
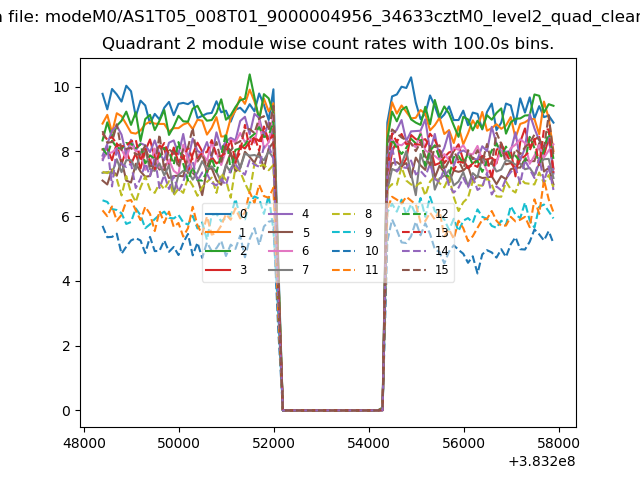
| Module-wise count rates for Quadrant B Data is divided into 100 sec bins |
 |
 |
| Module-wise count rates for Quadrant C Data is divided into 100 sec bins |
 |
 |
| Module-wise count rates for Quadrant D Data is divided into 100 sec bins |
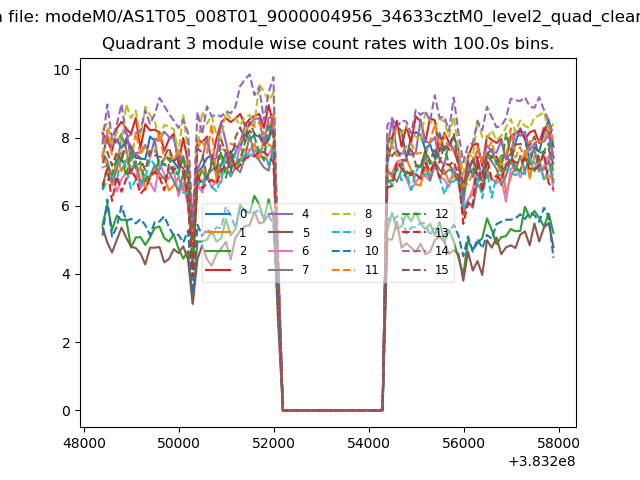 |
 |
| Parameter | Plot |
|---|---|
| CZT HV Monitor |  |
| D_VDD | 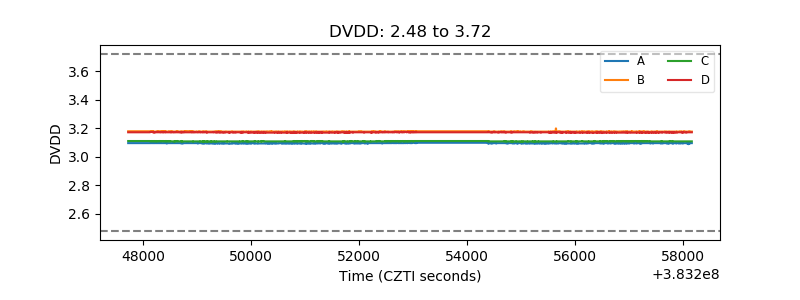 |
| Temperature 1 | 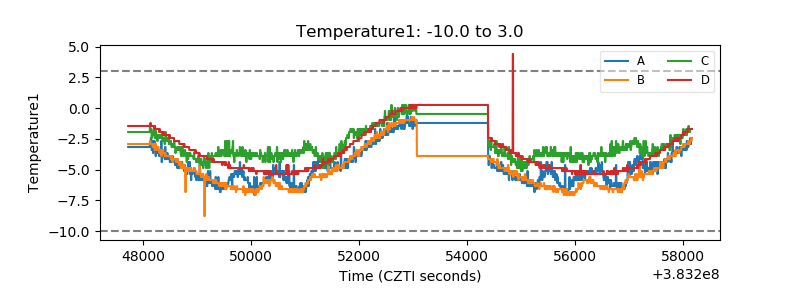 |
| Veto HV Monitor | 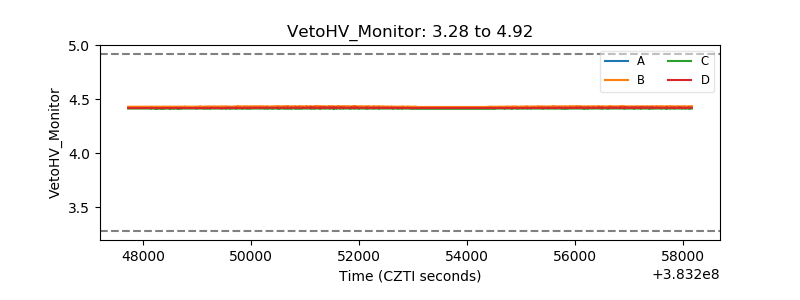 |
| Veto LLD | 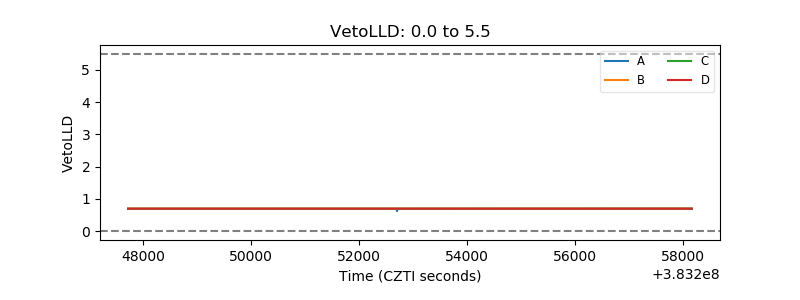 |
| Alpha Counter | 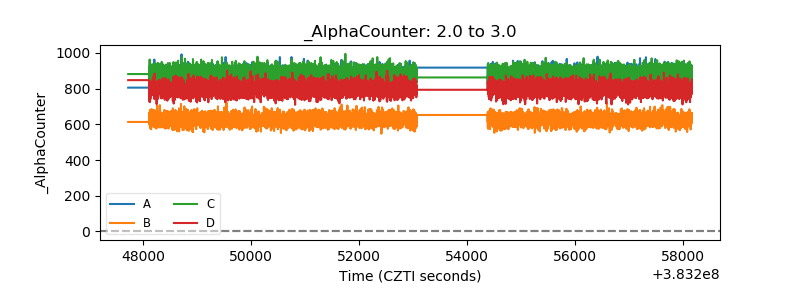 |
| _CPM_Rate | 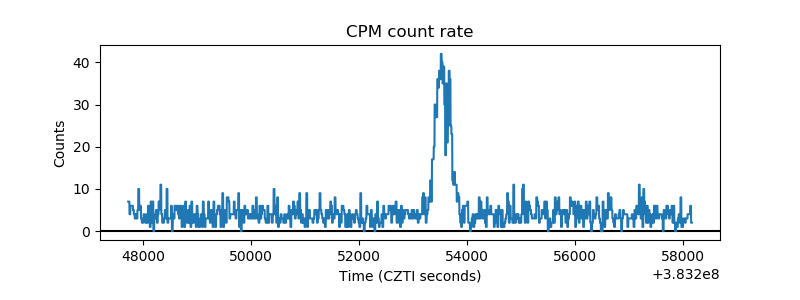 |
| CZT Counter | 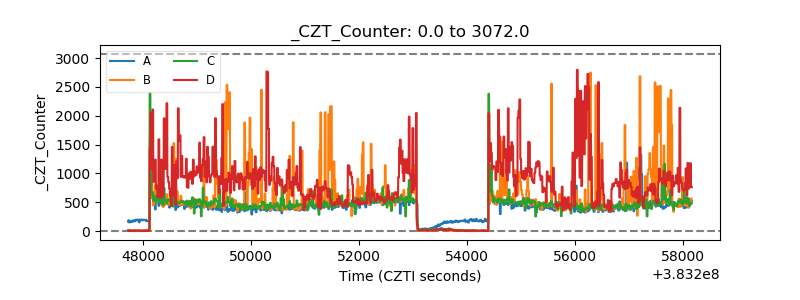 |
| +2.5 Volts monitor | 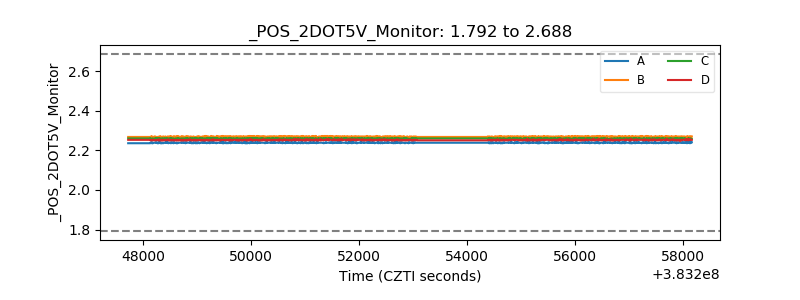 |
| +5 Volts monitor | 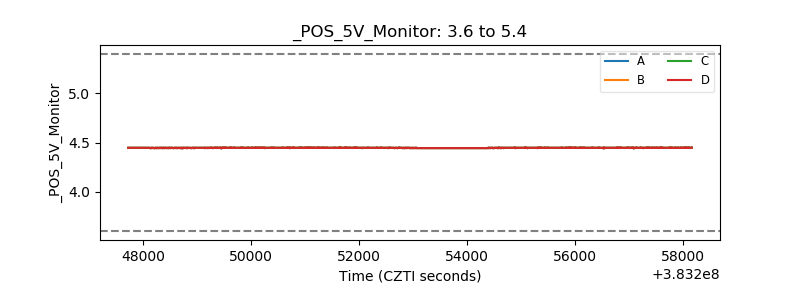 |
| _ROLL_ROT | 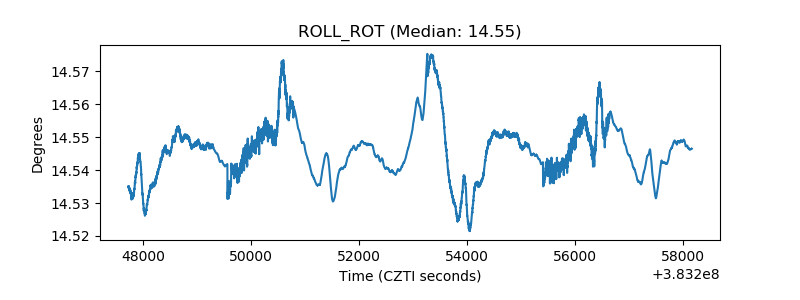 |
| _Roll_DEC | 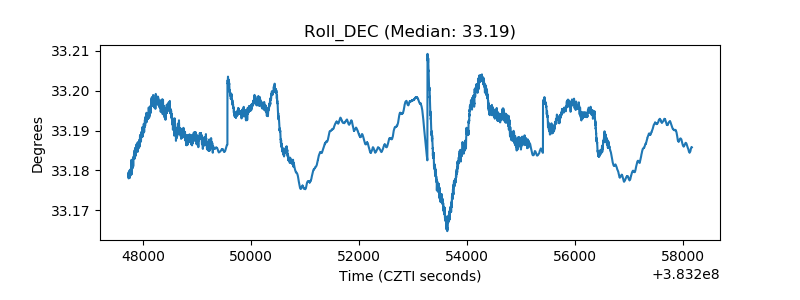 |
| _Roll_RA | 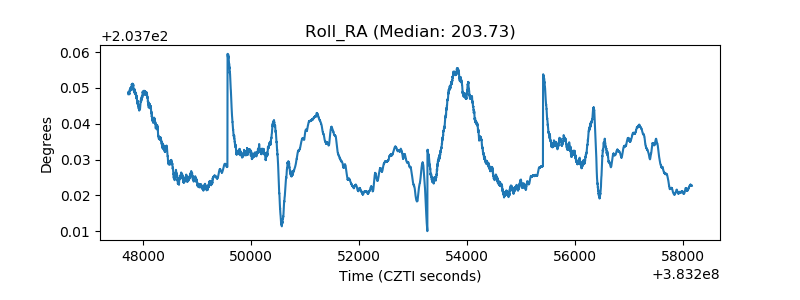 |
| Veto Counter | 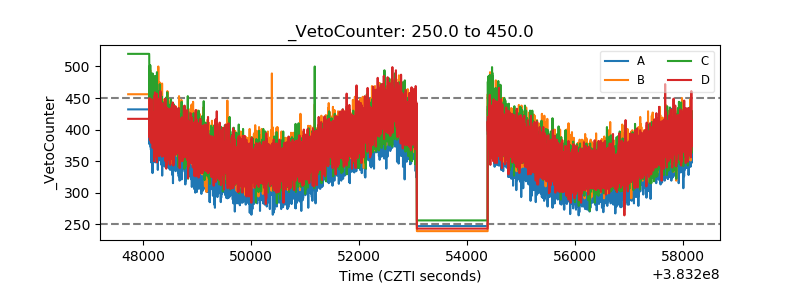 |