| Param | Original file | Final file |
|---|---|---|
| Filename | modeM0/AS1T05_008T01_9000004956_34629cztM0_level2.evt | modeM0/AS1T05_008T01_9000004956_34629cztM0_level2_quad_clean.evt |
| Size (bytes) | 497,684,160 | 76,233,600 |
| Size | 474.6 MB | 72.7 MB |
| Events in quadrant A | 2,638,558 | 490,900 |
| Events in quadrant B | 4,019,225 | 466,366 |
| Events in quadrant C | 3,085,838 | 489,545 |
| Events in quadrant D | 4,943,829 | 464,391 |
| Mode SS | |||
|---|---|---|---|
| Quadrant | BADHDUFLAG | Total packets | Discarded packets |
| A | 0 | 114 | 0 |
| B | 0 | 114 | 0 |
| C | 0 | 114 | 0 |
| D | 0 | 114 | 0 |
| Mode M9 | |||
|---|---|---|---|
| Quadrant | BADHDUFLAG | Total packets | Discarded packets |
| A | 0 | 23 | 0 |
| B | 0 | 23 | 0 |
| C | 0 | 23 | 0 |
| D | 0 | 24 | 0 |
| Mode M0 | |||
|---|---|---|---|
| Quadrant | BADHDUFLAG | Total packets | Discarded packets |
| A | 0 | 11595 | 3 |
| B | 0 | 15544 | 2 |
| C | 0 | 12448 | 2 |
| D | 0 | 18771 | 2 |
| Quadrant | Total seconds | Saturated seconds | Saturation percentage |
|---|---|---|---|
| A | 5683 | 5 | 0.087982% |
| B | 5683 | 447 | 7.865564% |
| C | 5683 | 74 | 1.302129% |
| D | 5683 | 127 | 2.234735% |
Noise dominated data is calculated using 1-second bins in cleaned event files. If a bin has >2000 counts, and if more than 50% of those come from <1% of pixels, then it is considered to be noise-dominated and hence unusable.
| Quadrant | # 1 sec bins | Bins with >0 counts | Bins with >2000 counts | High rate bins dominated by noise | Noise dominated (total time) | Noise dominated (detector-on time) | Marked lightcurve |
|---|---|---|---|---|---|---|---|
| A | 7147 | 5684 | 0 | 0 | 0.00% | 0.00% | 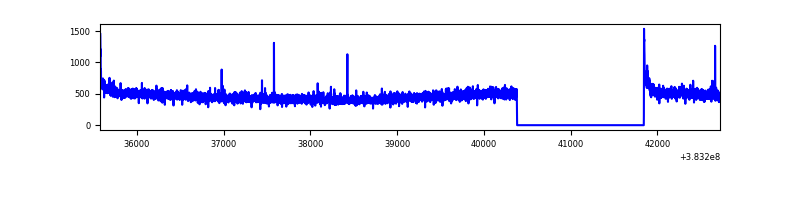 |
| B | 7147 | 5684 | 279 | 279 | 3.90% | 4.91% | 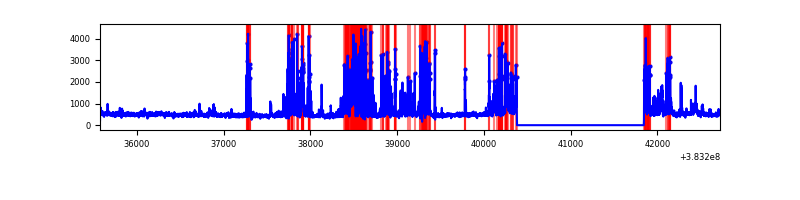 |
| C | 7147 | 5684 | 47 | 47 | 0.66% | 0.83% | 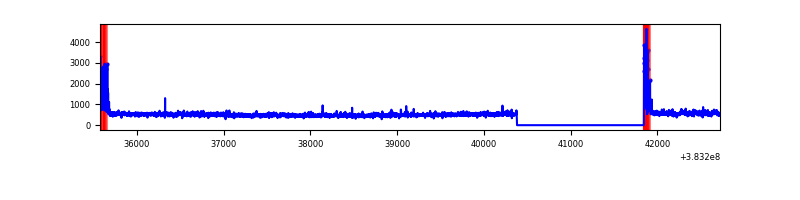 |
| D | 7147 | 5684 | 94 | 94 | 1.32% | 1.65% | 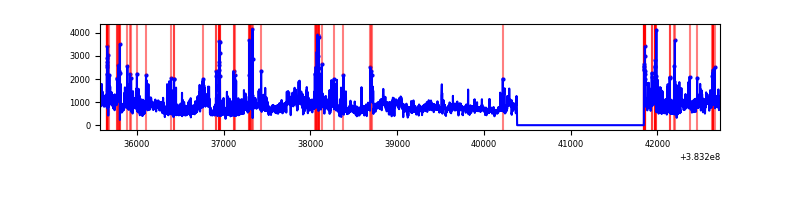 |
Top three noisy pixels from each quadrant. If the there are fewer than three noisy pixels in the level2.evt file, extra rows are filled as -1
| Pixel properties | Quadrant properties | ||||||
|---|---|---|---|---|---|---|---|
| Quadrant | DetID | PixID | Counts | Sigma | Mean | Median | Sigma |
| A | 10 | 83 | 48679 | 359.98 | 662 | 650 | 133.4 |
| A | 13 | 6 | 12099 | 85.81 | 662 | 650 | 133.4 |
| A | 13 | 254 | 11189 | 78.99 | 662 | 650 | 133.4 |
| B | 5 | 172 | 1157248 | 9297.66 | 639 | 622 | 124.4 |
| B | 4 | 171 | 159227 | 1274.96 | 639 | 622 | 124.4 |
| B | 0 | 189 | 79494 | 634.02 | 639 | 622 | 124.4 |
| C | 15 | 214 | 238242 | 1594.39 | 639 | 643 | 149.0 |
| C | 0 | 10 | 205435 | 1374.24 | 639 | 643 | 149.0 |
| C | 14 | 67 | 126449 | 844.21 | 639 | 643 | 149.0 |
| D | 8 | 195 | 1807347 | 10360.68 | 634 | 620 | 174.4 |
| D | 7 | 223 | 170106 | 971.92 | 634 | 620 | 174.4 |
| D | 10 | 118 | 119661 | 682.64 | 634 | 620 | 174.4 |
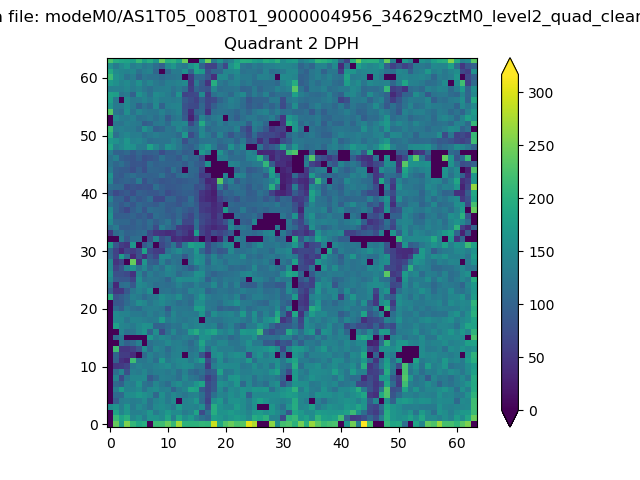
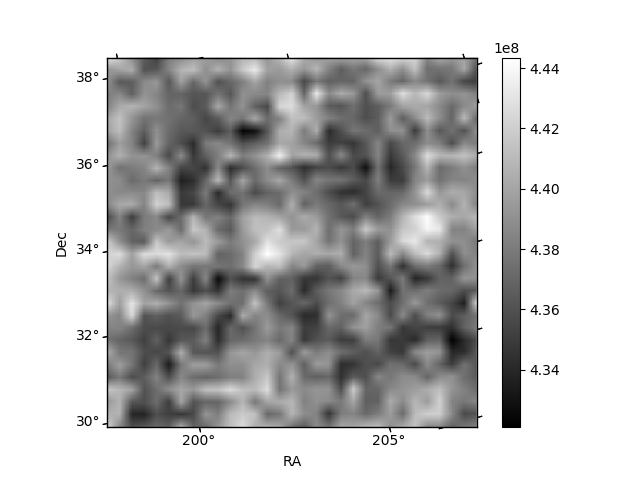
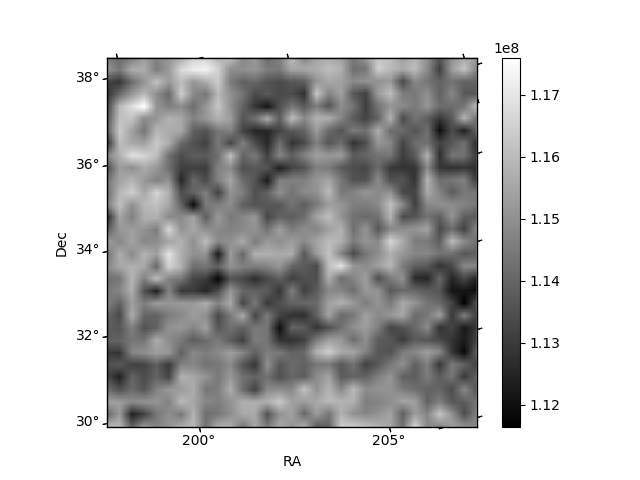
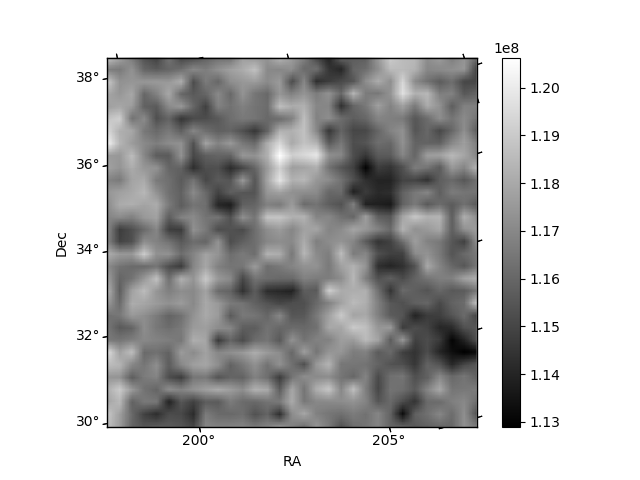
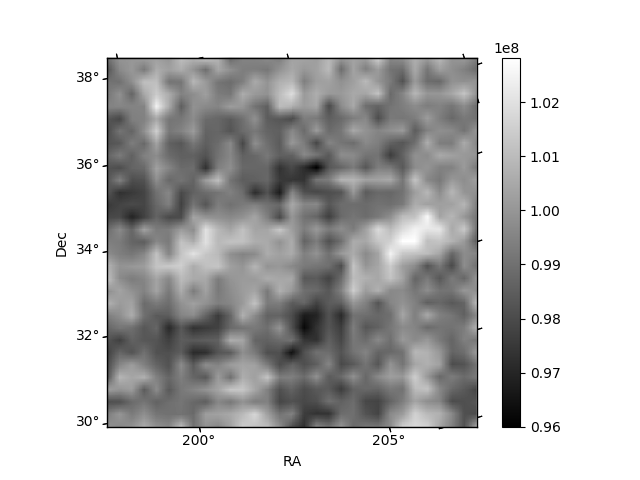
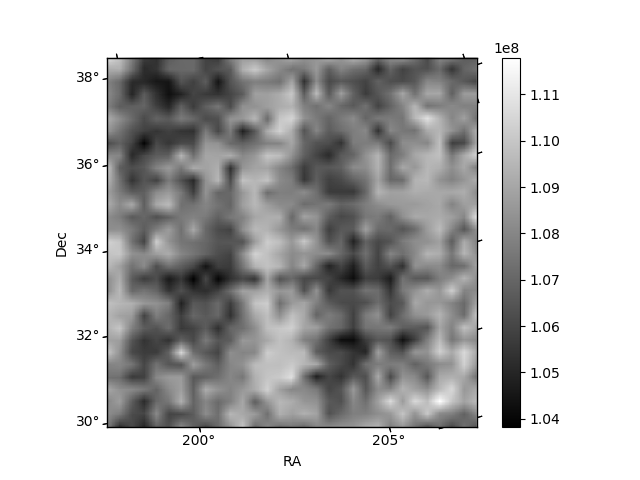
Histogram calculated using DETX and DETY for each event in the final _common_clean file
| Quadrant A | 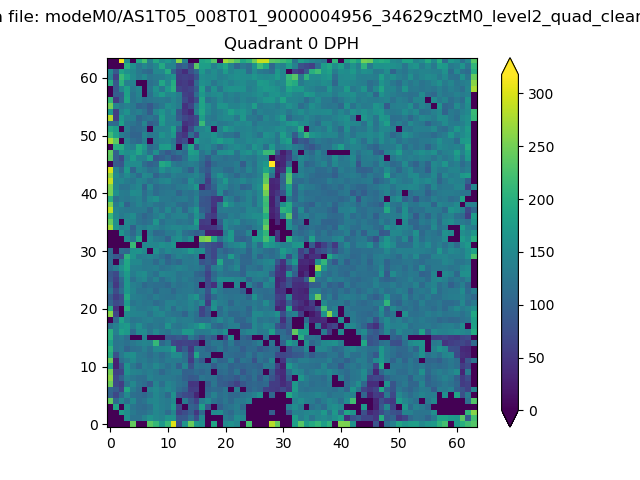 |
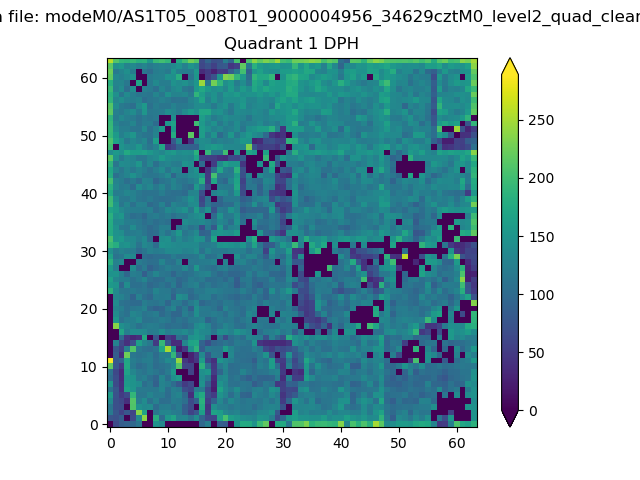 |
Quadrant B |
|---|---|---|---|
| Quadrant D | 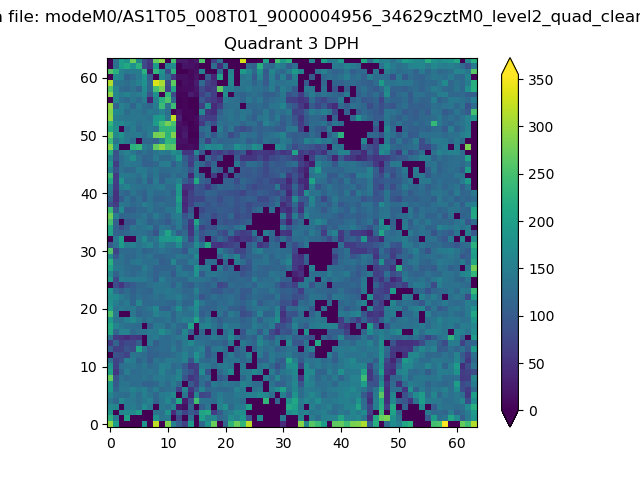 |
 |
Quadrant C |
| Plot type | Count rate plots | Images |
|---|---|---|
| Comparison with Poisson distribution Blue bars denote a histogram of data divided into 1 sec bins. Red curve is a Poisson curve with rate = median count rate of data. |
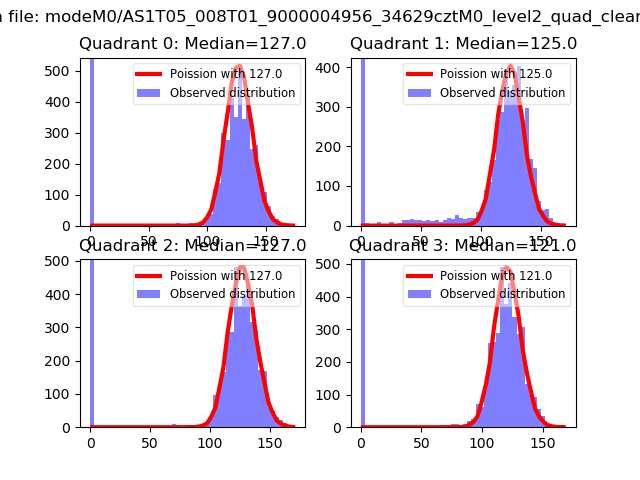 |
 |
| Quadrant-wise count rates Data is divided into 100 sec bins |
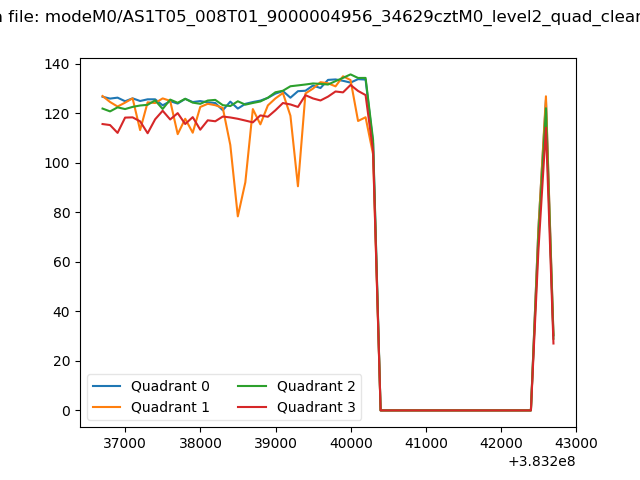 |
|
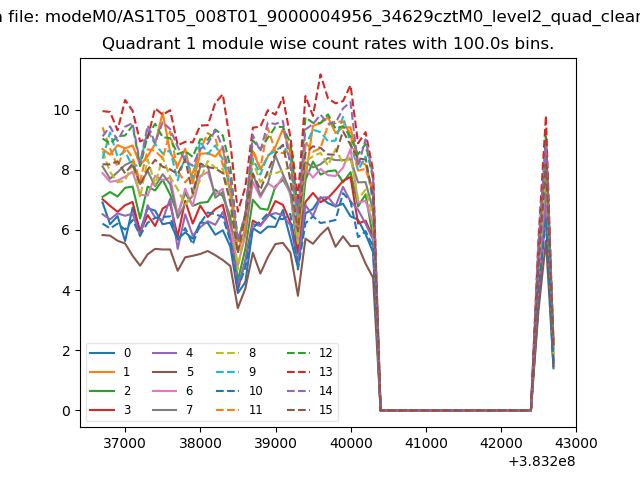
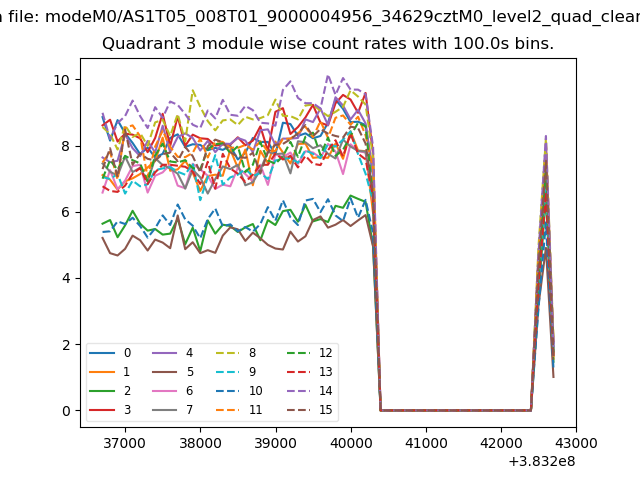
| Module-wise count rates for Quadrant A Data is divided into 100 sec bins |
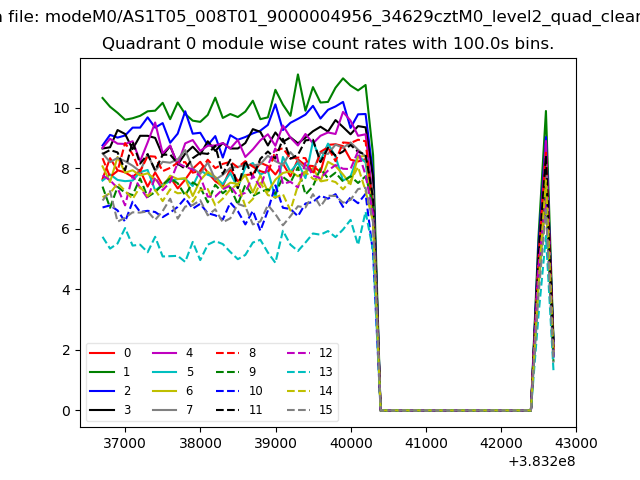 |
 |
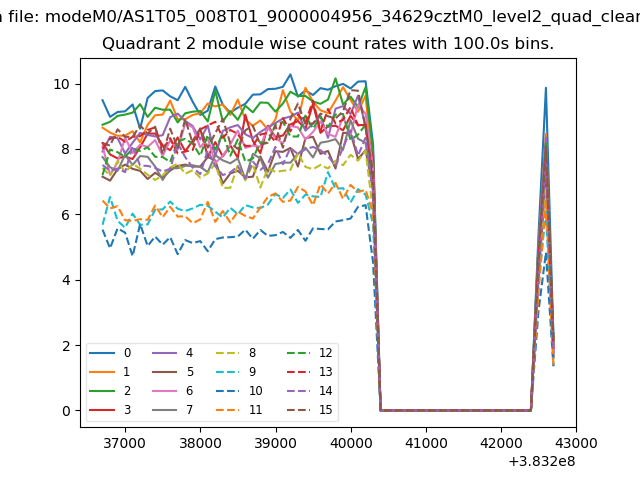
| Module-wise count rates for Quadrant B Data is divided into 100 sec bins |
 |
 |
| Module-wise count rates for Quadrant C Data is divided into 100 sec bins |
 |
 |
| Module-wise count rates for Quadrant D Data is divided into 100 sec bins |
 |
 |
| Parameter | Plot |
|---|---|
| CZT HV Monitor | 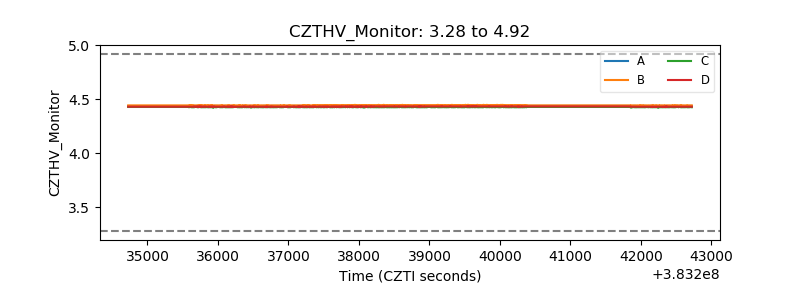 |
| D_VDD | 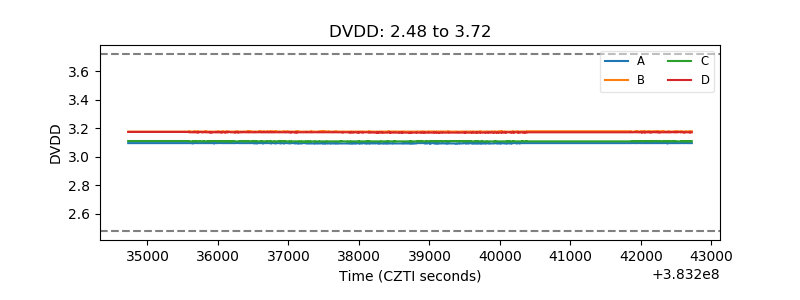 |
| Temperature 1 | 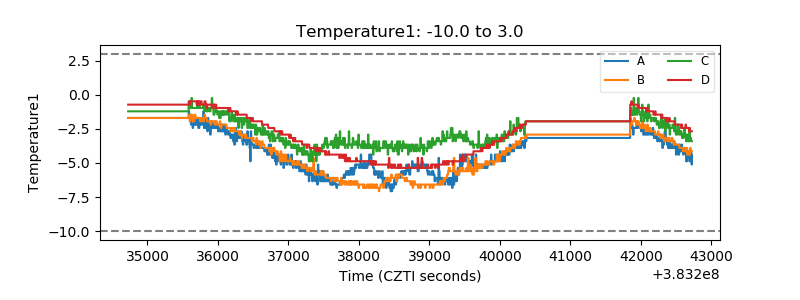 |
| Veto HV Monitor | 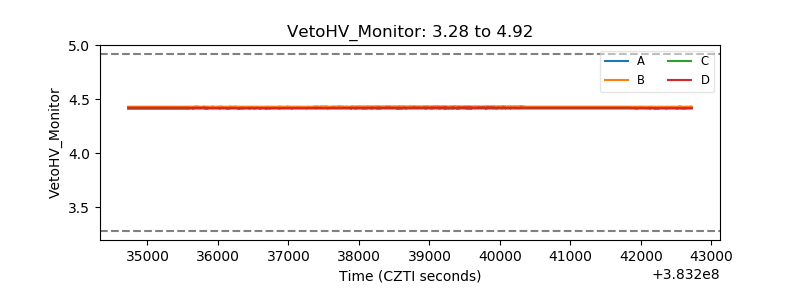 |
| Veto LLD | 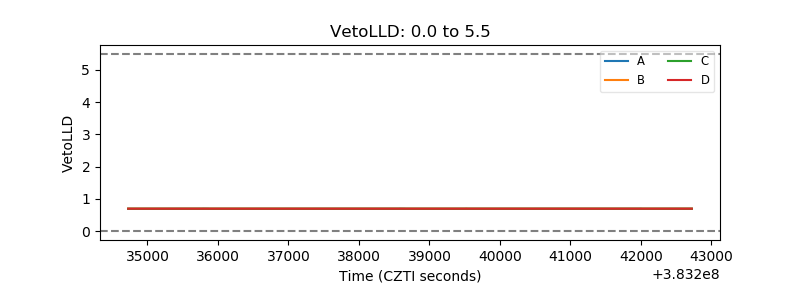 |
| Alpha Counter | 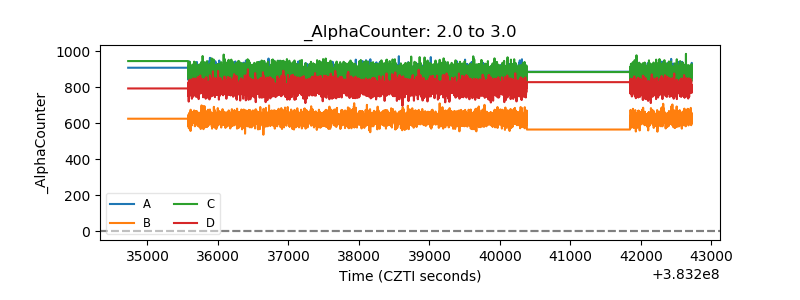 |
| _CPM_Rate | 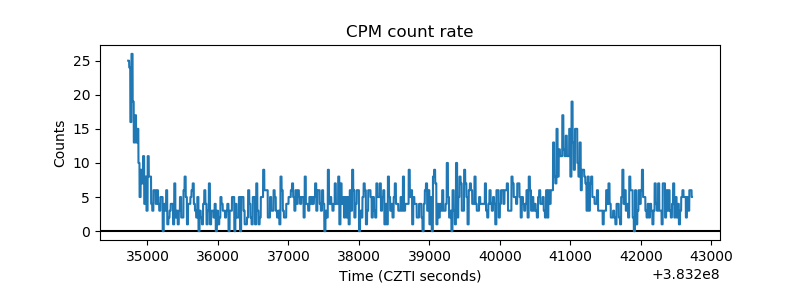 |
| CZT Counter | 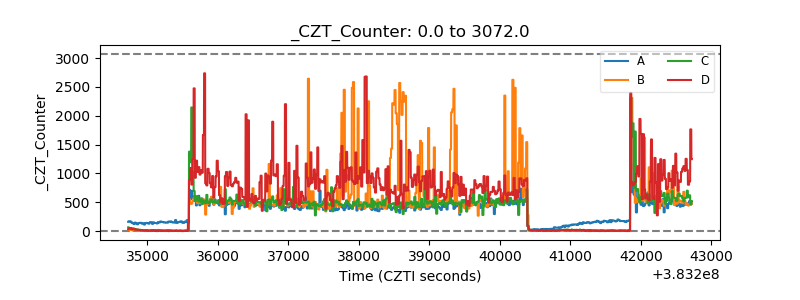 |
| +2.5 Volts monitor | 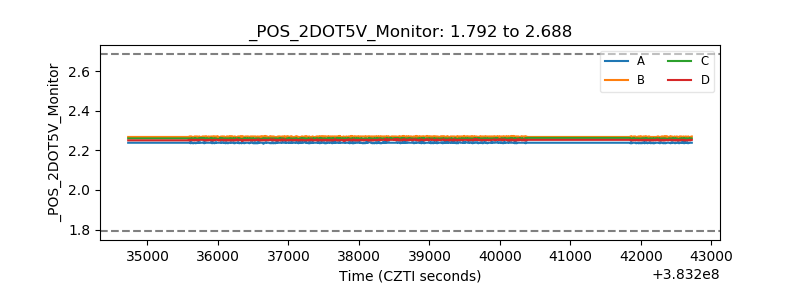 |
| +5 Volts monitor | 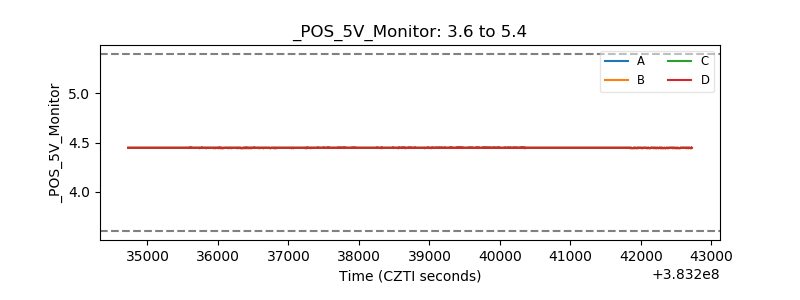 |
| _ROLL_ROT | 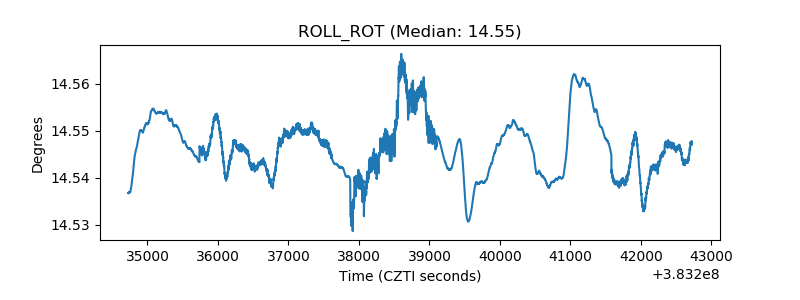 |
| _Roll_DEC | 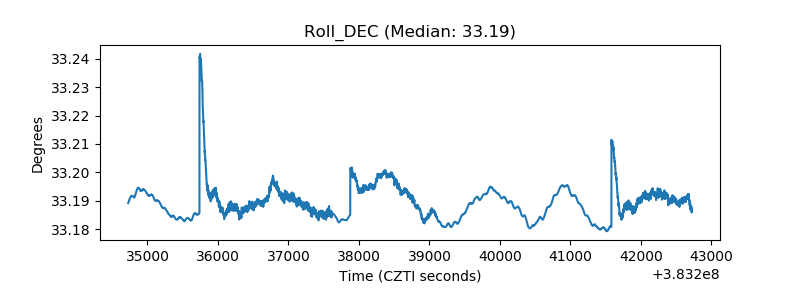 |
| _Roll_RA | 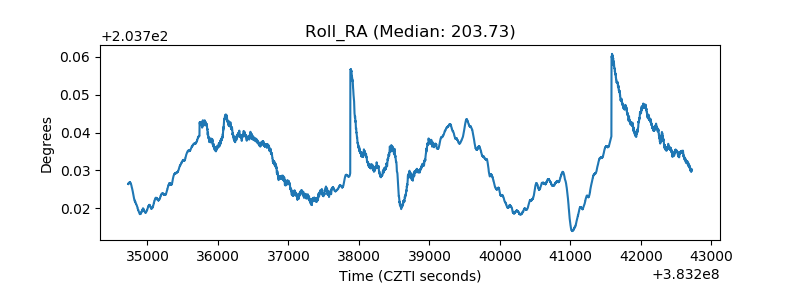 |
| Veto Counter | 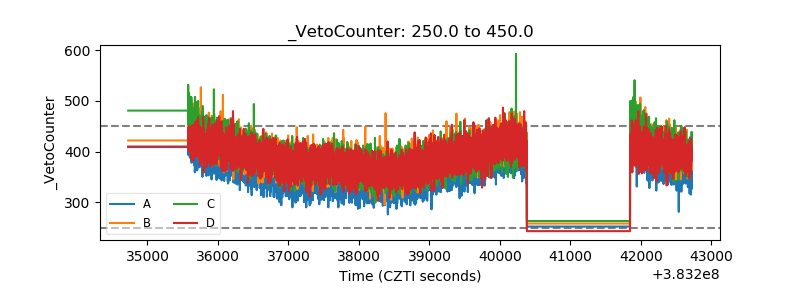 |