| Param | Original file | Final file |
|---|---|---|
| Filename | modeM0/AS1T05_008T01_9000004956cztM0_level2_bc.evt | modeM0/AS1T05_008T01_9000004956cztM0_level2_quad_clean.evt |
| Size (bytes) | 8,552,338,560 | 2,086,960,320 |
| Size | 8.0 GB | 1.9 GB |
| Events in quadrant A | 35,426,063 | 13,329,302 |
| Events in quadrant B | 57,252,419 | 12,983,060 |
| Events in quadrant C | 43,765,420 | 13,255,033 |
| Events in quadrant D | 111,396,565 | 12,366,740 |
| Mode SS | |||
|---|---|---|---|
| Quadrant | BADHDUFLAG | Total packets | Discarded packets |
| A | 0 | 3362 | 0 |
| B | 0 | 3362 | 0 |
| C | 0 | 3362 | 0 |
| D | 0 | 3362 | 0 |
| Mode M9 | |||
|---|---|---|---|
| Quadrant | BADHDUFLAG | Total packets | Discarded packets |
| A | 0 | 594 | 0 |
| B | 0 | 594 | 0 |
| C | 0 | 594 | 0 |
| D | 0 | 595 | 0 |
| Mode M0 | |||
|---|---|---|---|
| Quadrant | BADHDUFLAG | Total packets | Discarded packets |
| A | 0 | 337016 | 0 |
| B | 0 | 429361 | 0 |
| C | 0 | 349747 | 0 |
| D | 0 | 586422 | 0 |
| Quadrant | Total seconds | Saturated seconds | Saturation percentage |
|---|---|---|---|
| A | 164636 | 357 | 0.216842% |
| B | 164620 | 9077 | 5.513911% |
| C | 164628 | 1163 | 0.706441% |
| D | 164610 | 8887 | 5.398821% |
Noise dominated data is calculated using 1-second bins in cleaned event files. If a bin has >2000 counts, and if more than 50% of those come from <1% of pixels, then it is considered to be noise-dominated and hence unusable.
| Quadrant | # 1 sec bins | Bins with >0 counts | Bins with >2000 counts | High rate bins dominated by noise | Noise dominated (total time) | Noise dominated (detector-on time) | Marked lightcurve |
|---|---|---|---|---|---|---|---|
| A | 223464 | 164690 | 16 | 16 | 0.01% | 0.01% | 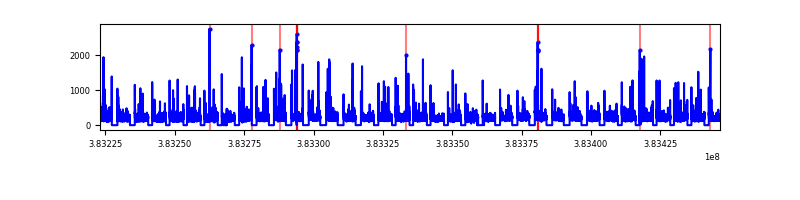 |
| B | 223463 | 164641 | 609 | 609 | 0.27% | 0.37% | 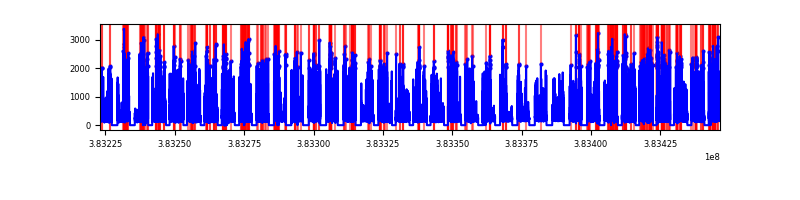 |
| C | 223463 | 164653 | 193 | 193 | 0.09% | 0.12% | 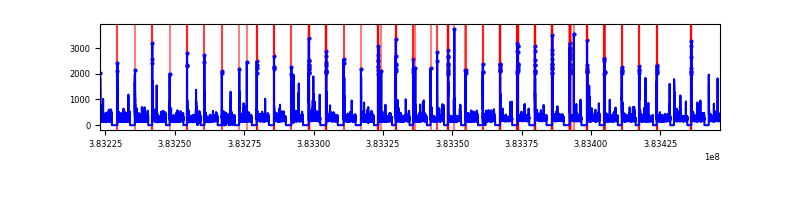 |
| D | 223463 | 164640 | 1558 | 1558 | 0.70% | 0.95% | 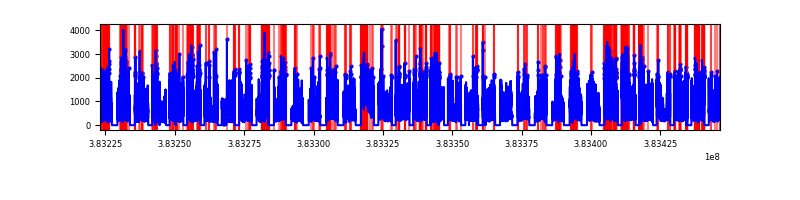 |
Top three noisy pixels from each quadrant. If the there are fewer than three noisy pixels in the level2.evt file, extra rows are filled as -1
| Pixel properties | Quadrant properties | ||||||
|---|---|---|---|---|---|---|---|
| Quadrant | DetID | PixID | Counts | Sigma | Mean | Median | Sigma |
| A | 10 | 83 | 940092 | 496.53 | 8578 | 8459 | 1876.3 |
| A | 9 | 143 | 349621 | 181.83 | 8578 | 8459 | 1876.3 |
| A | 13 | 6 | 329060 | 170.87 | 8578 | 8459 | 1876.3 |
| B | 5 | 172 | 19647682 | 11814.81 | 8405 | 8226 | 1662.3 |
| B | 5 | 255 | 1180604 | 705.29 | 8405 | 8226 | 1662.3 |
| B | 4 | 232 | 679059 | 403.56 | 8405 | 8226 | 1662.3 |
| C | 15 | 214 | 6548399 | 3452.73 | 8298 | 8247 | 1894.2 |
| C | 0 | 10 | 2379661 | 1251.94 | 8298 | 8247 | 1894.2 |
| C | 14 | 67 | 1394768 | 731.98 | 8298 | 8247 | 1894.2 |
| D | 8 | 195 | 53693851 | 25170.99 | 8172 | 7967 | 2132.8 |
| D | 10 | 203 | 3618696 | 1692.91 | 8172 | 7967 | 2132.8 |
| D | 2 | 250 | 2911319 | 1361.26 | 8172 | 7967 | 2132.8 |
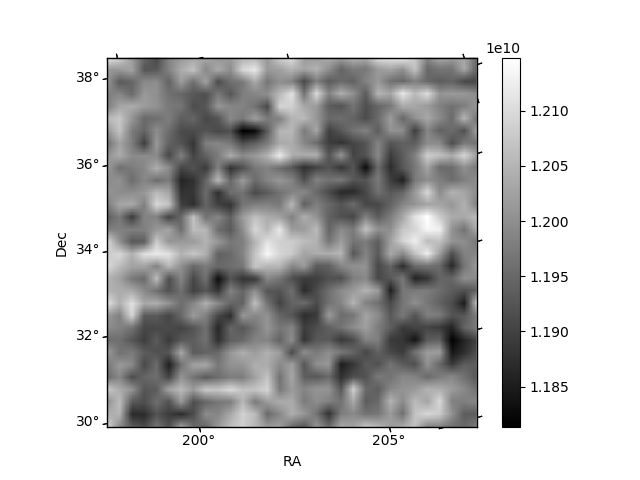
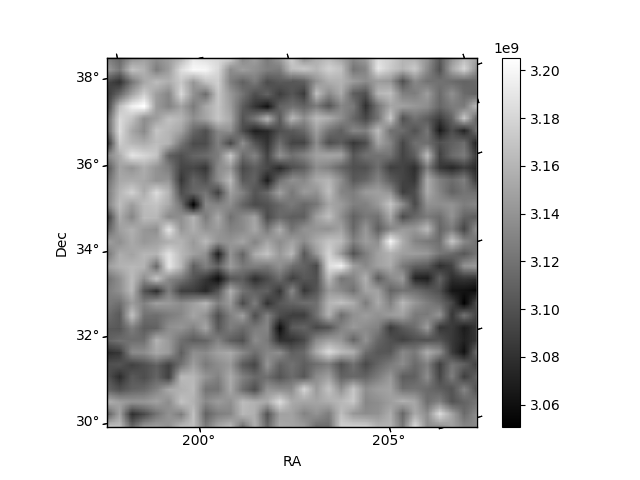
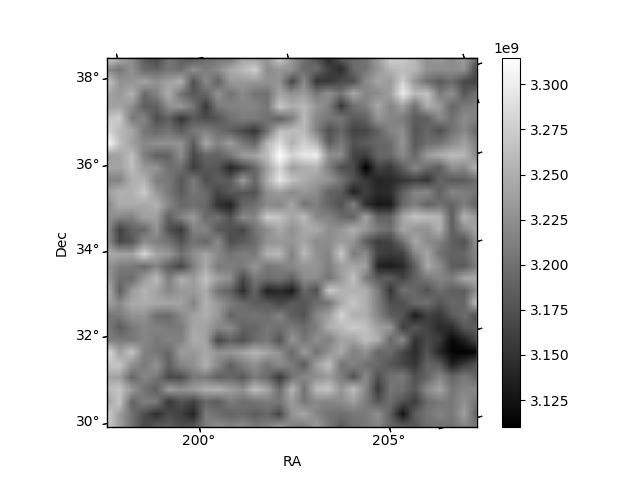
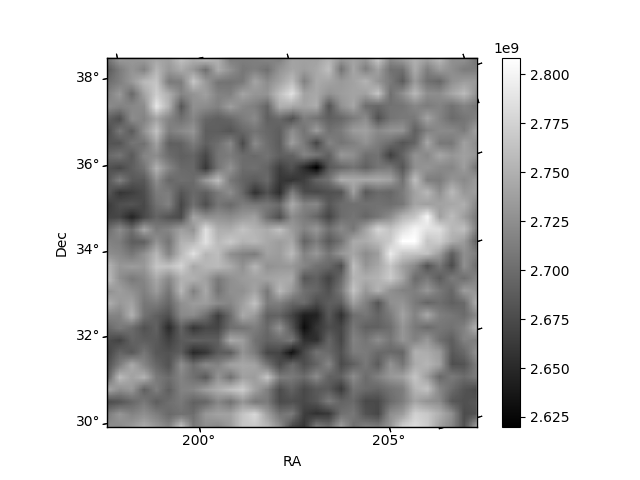
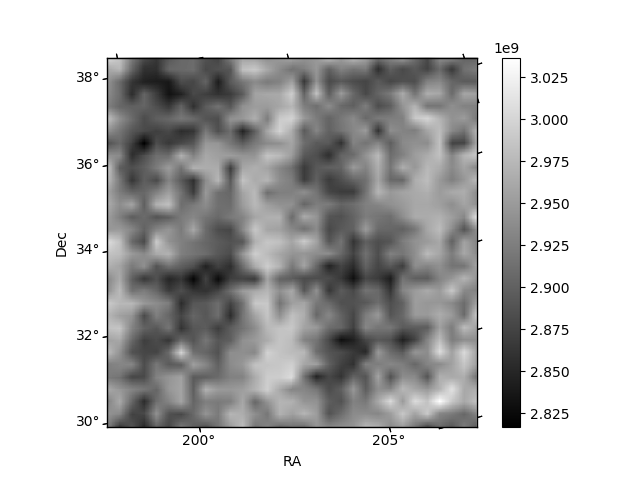
Histogram calculated using DETX and DETY for each event in the final _common_clean file
| Quadrant A | 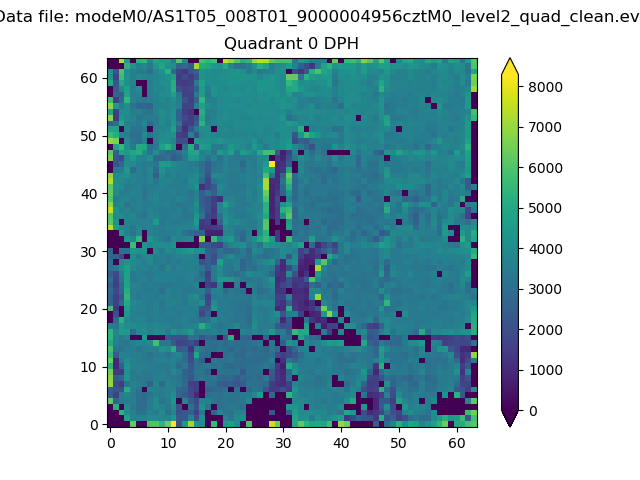 |
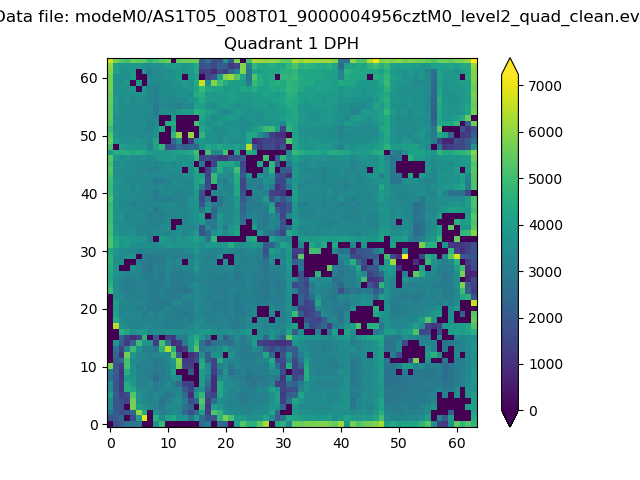 |
Quadrant B |
|---|---|---|---|
| Quadrant D | 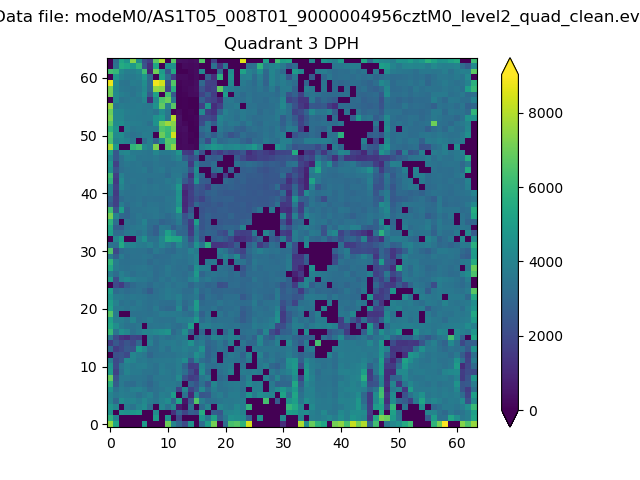 |
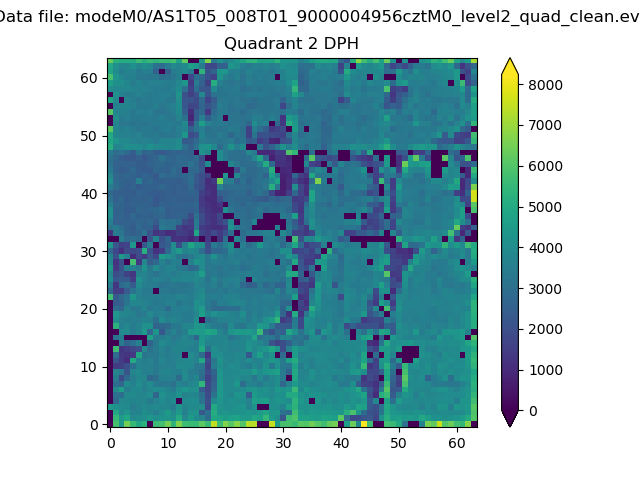 |
Quadrant C |
| Plot type | Count rate plots | Images |
|---|---|---|
| Comparison with Poisson distribution Blue bars denote a histogram of data divided into 1 sec bins. Red curve is a Poisson curve with rate = median count rate of data. |
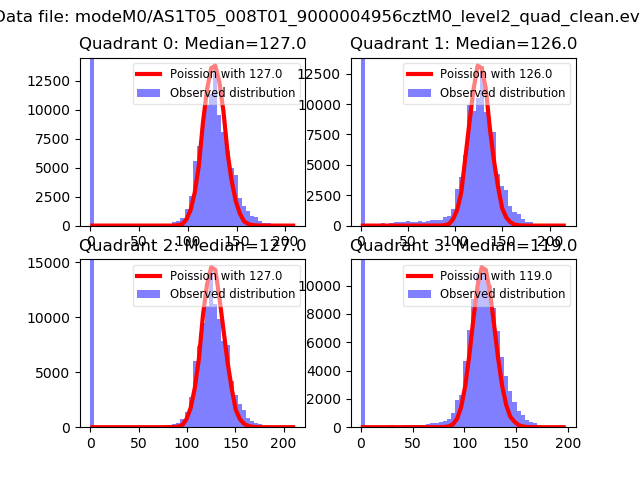 |
 |
| Quadrant-wise count rates Data is divided into 100 sec bins |
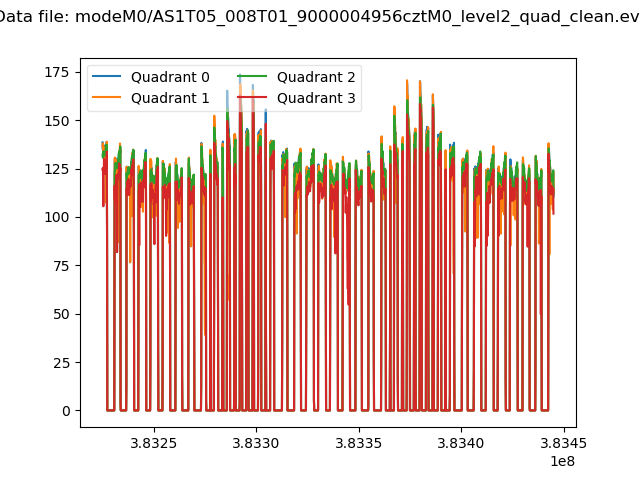 |
|
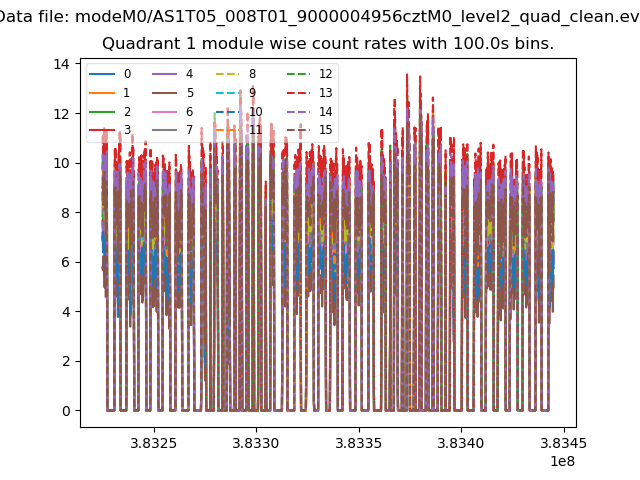
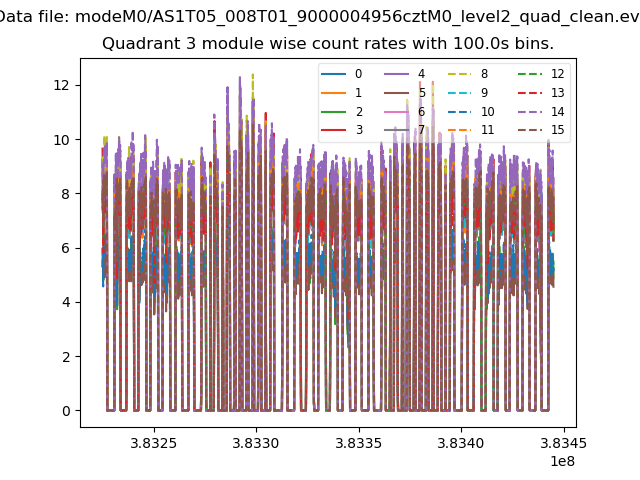
| Module-wise count rates for Quadrant A Data is divided into 100 sec bins |
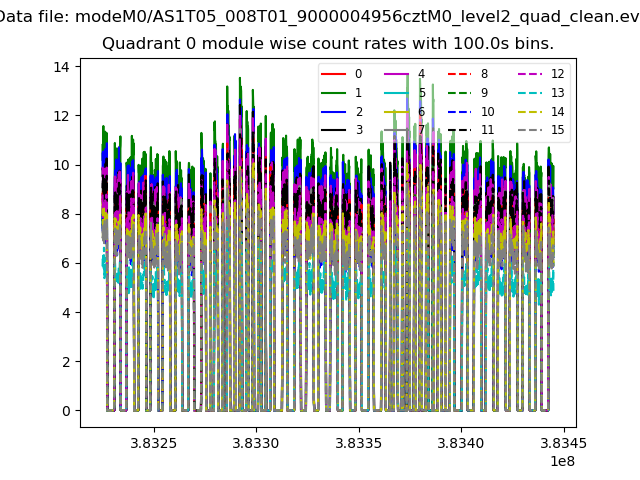 |
 |
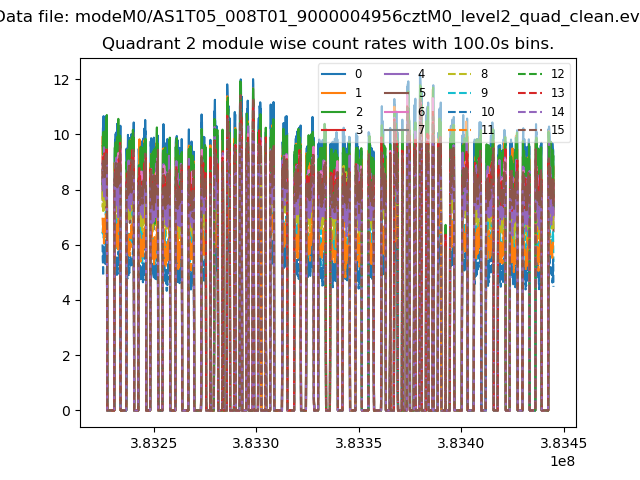
| Module-wise count rates for Quadrant B Data is divided into 100 sec bins |
 |
 |
| Module-wise count rates for Quadrant C Data is divided into 100 sec bins |
 |
 |
| Module-wise count rates for Quadrant D Data is divided into 100 sec bins |
 |
 |
| Parameter | Plot |
|---|---|
| CZT HV Monitor | 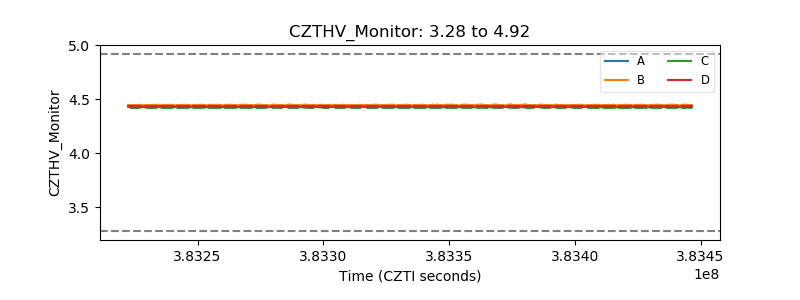 |
| D_VDD | 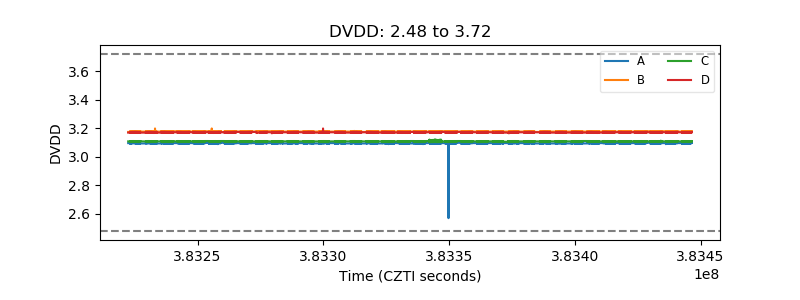 |
| Temperature 1 | 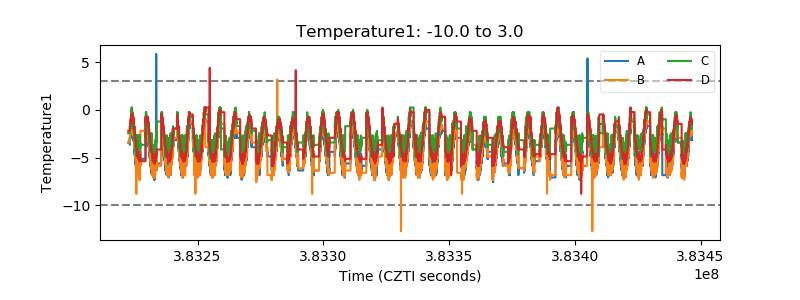 |
| Veto HV Monitor | 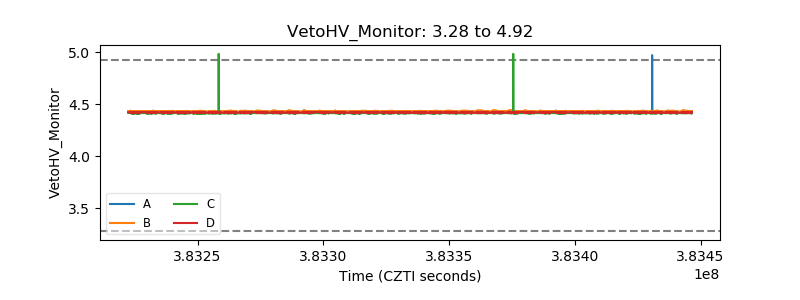 |
| Veto LLD | 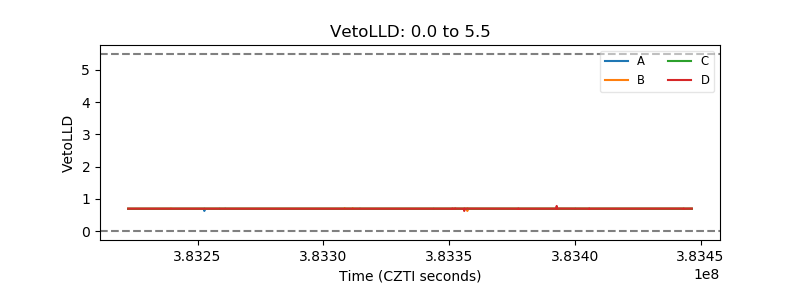 |
| Alpha Counter | 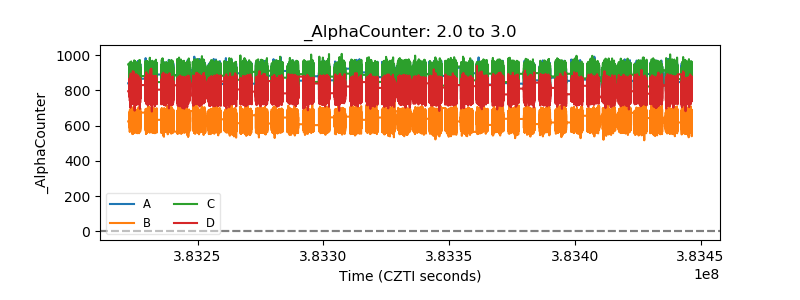 |
| _CPM_Rate | 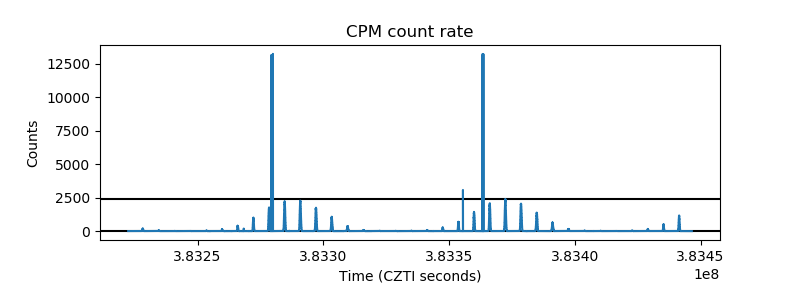 |
| CZT Counter | 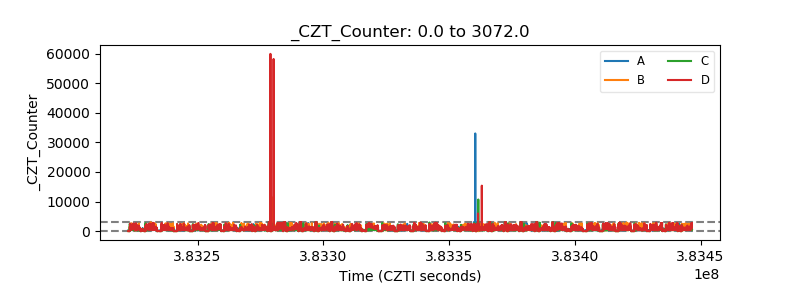 |
| +2.5 Volts monitor | 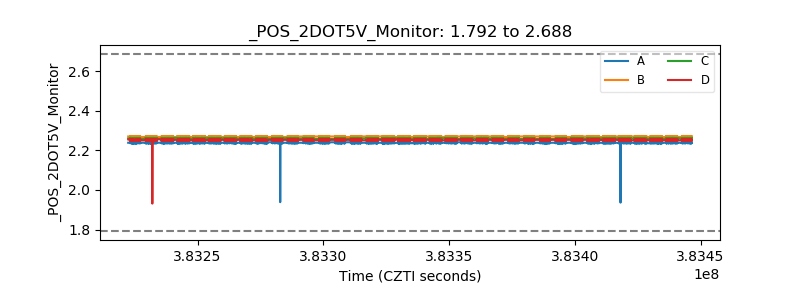 |
| +5 Volts monitor | 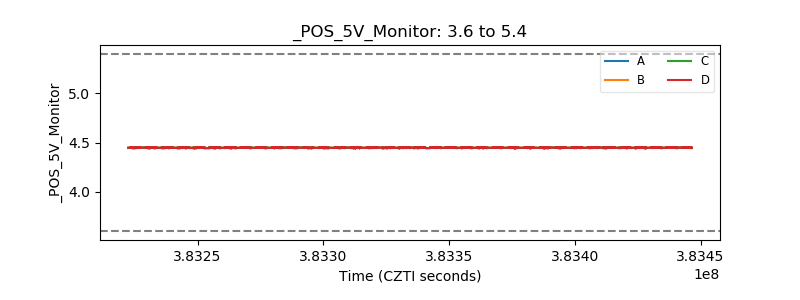 |
| _ROLL_ROT | 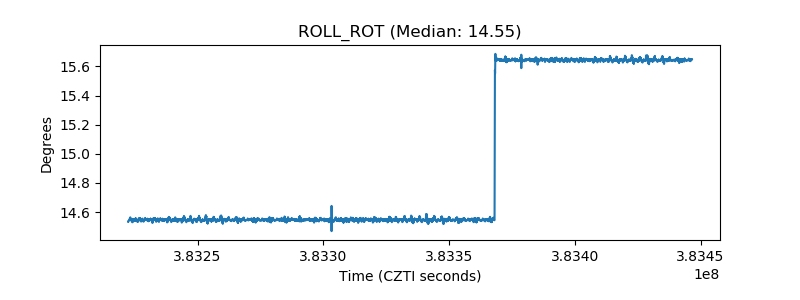 |
| _Roll_DEC | 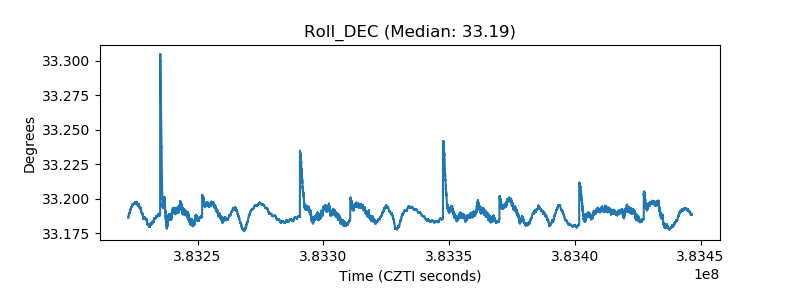 |
| _Roll_RA | 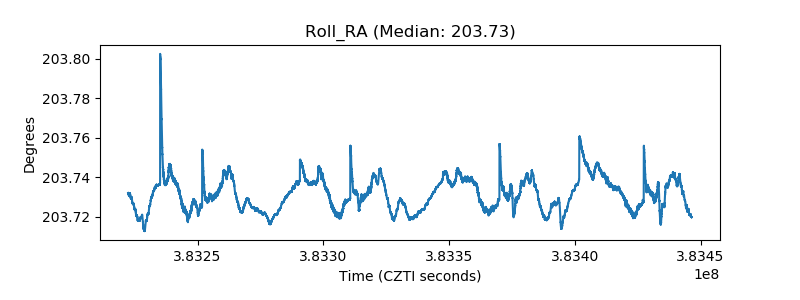 |
| Veto Counter | 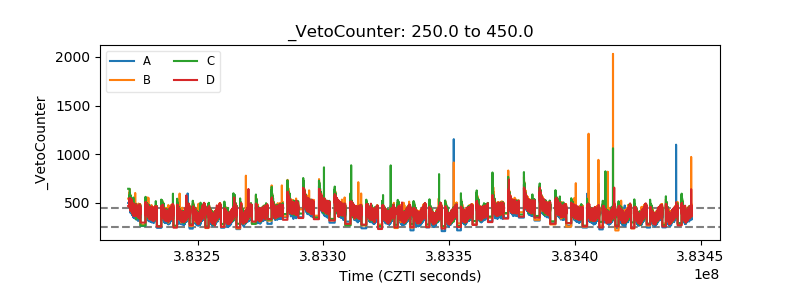 |