| Param | Original file | Final file |
|---|---|---|
| Filename | modeM0/AS1A11_058T02_9000004954_34626cztM0_level2.evt | modeM0/AS1A11_058T02_9000004954_34626cztM0_level2_quad_clean.evt |
| Size (bytes) | 363,300,480 | 40,104,000 |
| Size | 346.5 MB | 38.2 MB |
| Events in quadrant A | 1,926,984 | 248,471 |
| Events in quadrant B | 2,642,675 | 241,956 |
| Events in quadrant C | 2,072,652 | 241,913 |
| Events in quadrant D | 4,103,439 | 214,512 |
| Mode M9 | |||
|---|---|---|---|
| Quadrant | BADHDUFLAG | Total packets | Discarded packets |
| A | 0 | 7 | 0 |
| B | 0 | 7 | 0 |
| C | 0 | 7 | 0 |
| D | 0 | 8 | 0 |
| Mode M0 | |||
|---|---|---|---|
| Quadrant | BADHDUFLAG | Total packets | Discarded packets |
| A | 0 | 7919 | 1 |
| B | 0 | 10160 | 1 |
| C | 0 | 8125 | 1 |
| D | 0 | 14770 | 1 |
| Mode SS | |||
|---|---|---|---|
| Quadrant | BADHDUFLAG | Total packets | Discarded packets |
| A | 0 | 76 | 0 |
| B | 0 | 76 | 0 |
| C | 0 | 76 | 0 |
| D | 0 | 76 | 0 |
| Quadrant | Total seconds | Saturated seconds | Saturation percentage |
|---|---|---|---|
| A | 3775 | 6 | 0.158940% |
| B | 3775 | 147 | 3.894040% |
| C | 3775 | 26 | 0.688742% |
| D | 3775 | 277 | 7.337748% |
Noise dominated data is calculated using 1-second bins in cleaned event files. If a bin has >2000 counts, and if more than 50% of those come from <1% of pixels, then it is considered to be noise-dominated and hence unusable.
| Quadrant | # 1 sec bins | Bins with >0 counts | Bins with >2000 counts | High rate bins dominated by noise | Noise dominated (total time) | Noise dominated (detector-on time) | Marked lightcurve |
|---|---|---|---|---|---|---|---|
| A | 3775 | 3775 | 2 | 2 | 0.05% | 0.05% | 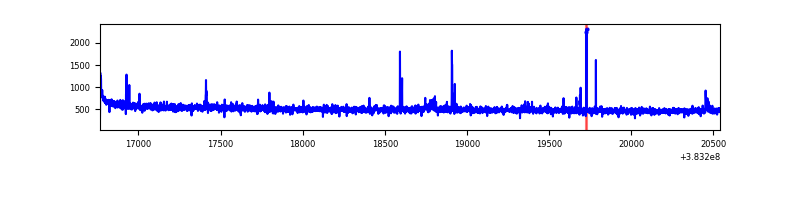 |
| B | 3775 | 3775 | 95 | 95 | 2.52% | 2.52% | 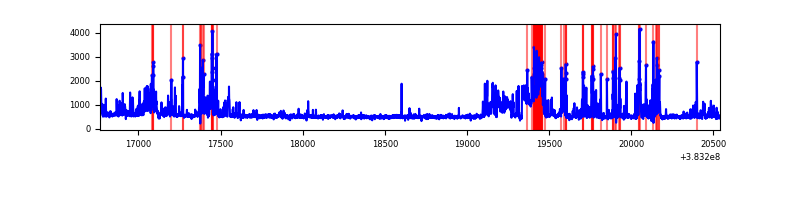 |
| C | 3775 | 3775 | 18 | 18 | 0.48% | 0.48% | 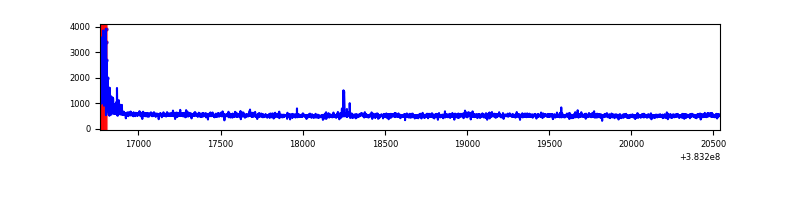 |
| D | 3775 | 3775 | 257 | 257 | 6.81% | 6.81% | 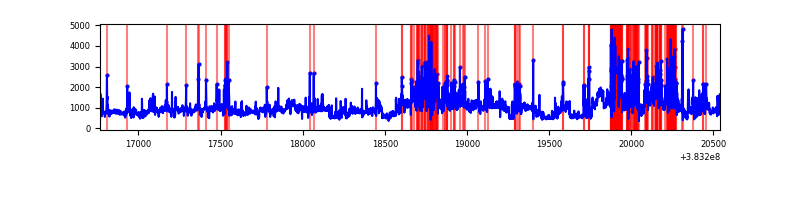 |
Top three noisy pixels from each quadrant. If the there are fewer than three noisy pixels in the level2.evt file, extra rows are filled as -1
| Pixel properties | Quadrant properties | ||||||
|---|---|---|---|---|---|---|---|
| Quadrant | DetID | PixID | Counts | Sigma | Mean | Median | Sigma |
| A | 10 | 83 | 25166 | 259.01 | 479 | 472 | 95.3 |
| A | 15 | 169 | 19849 | 203.24 | 479 | 472 | 95.3 |
| A | 9 | 143 | 10230 | 102.35 | 479 | 472 | 95.3 |
| B | 5 | 172 | 712165 | 8070.28 | 467 | 456 | 88.2 |
| B | 4 | 171 | 39345 | 440.97 | 467 | 456 | 88.2 |
| B | 4 | 232 | 19773 | 219.04 | 467 | 456 | 88.2 |
| C | 15 | 214 | 155610 | 1473.48 | 458 | 463 | 105.3 |
| C | 0 | 10 | 89315 | 843.85 | 458 | 463 | 105.3 |
| C | 14 | 67 | 18864 | 174.76 | 458 | 463 | 105.3 |
| D | 8 | 195 | 1398716 | 12558.35 | 452 | 441 | 111.3 |
| D | 3 | 13 | 302566 | 2713.48 | 452 | 441 | 111.3 |
| D | 13 | 249 | 228400 | 2047.37 | 452 | 441 | 111.3 |
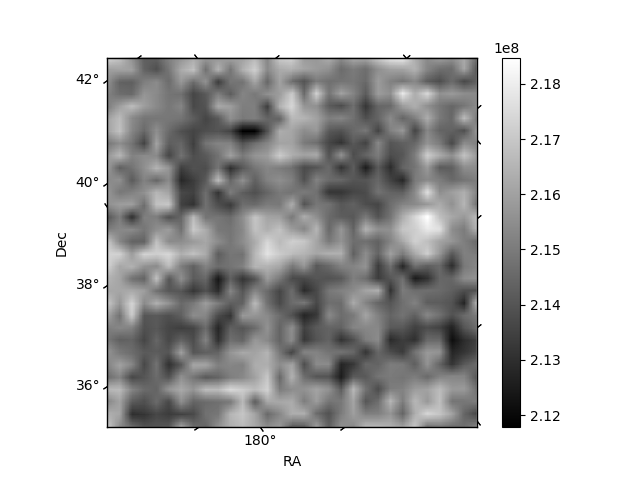
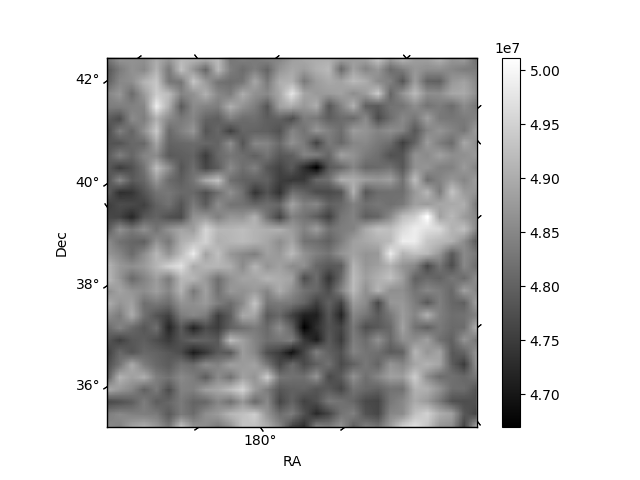
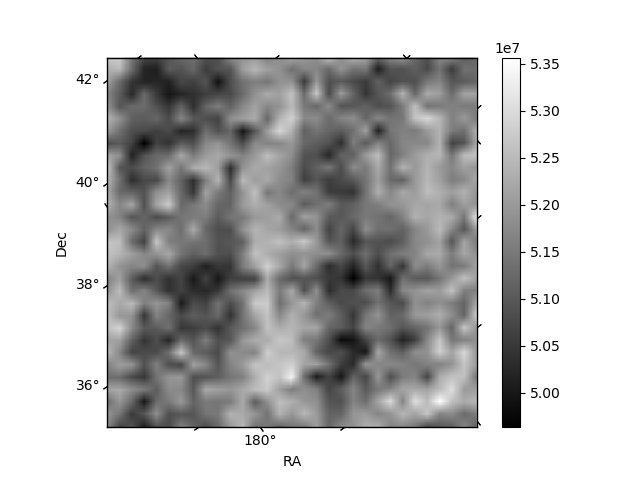
Histogram calculated using DETX and DETY for each event in the final _common_clean file
| Quadrant A | 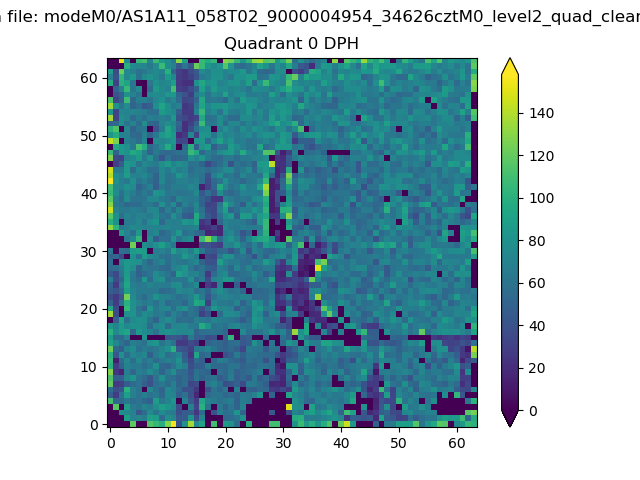 |
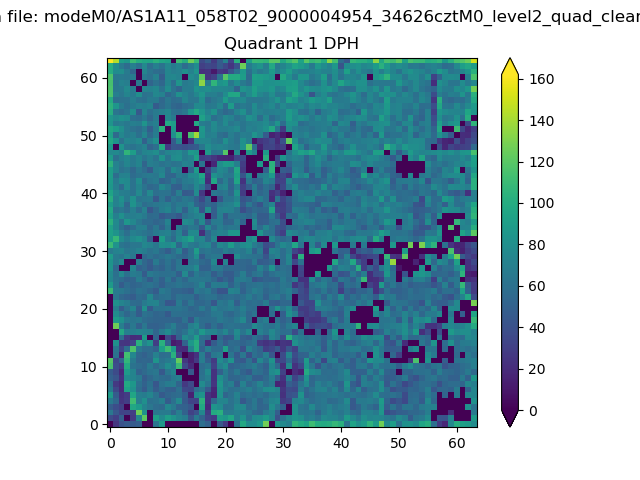 |
Quadrant B |
|---|---|---|---|
| Quadrant D | 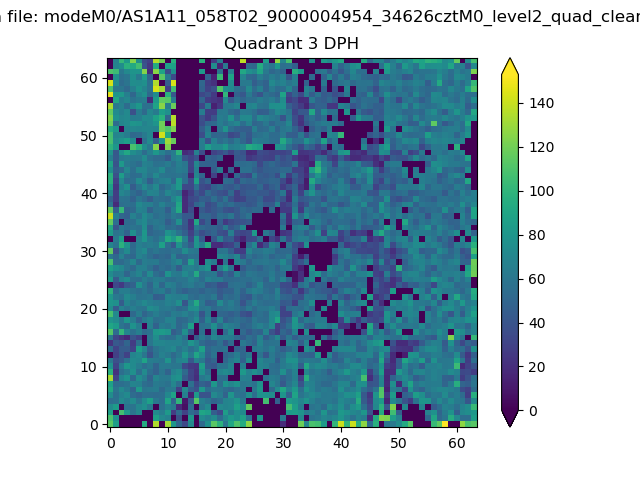 |
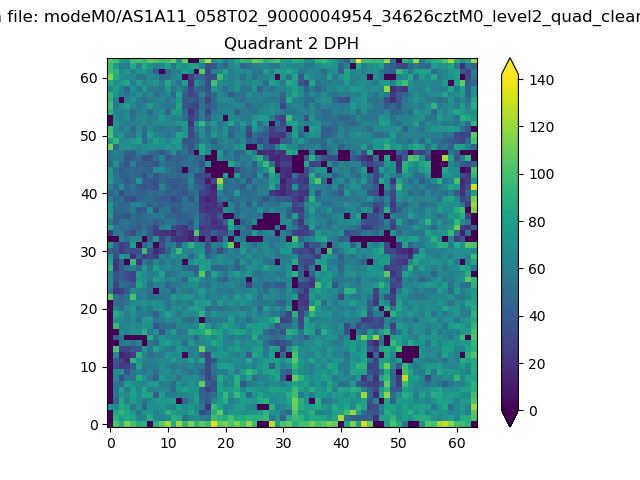 |
Quadrant C |
| Plot type | Count rate plots | Images |
|---|---|---|
| Comparison with Poisson distribution Blue bars denote a histogram of data divided into 1 sec bins. Red curve is a Poisson curve with rate = median count rate of data. |
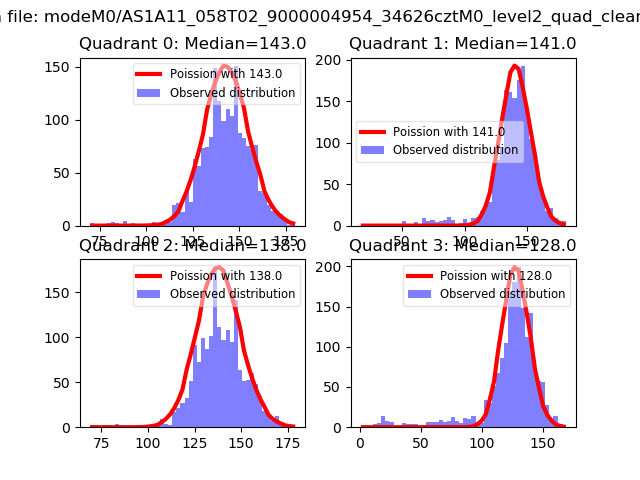 |
 |
| Quadrant-wise count rates Data is divided into 100 sec bins |
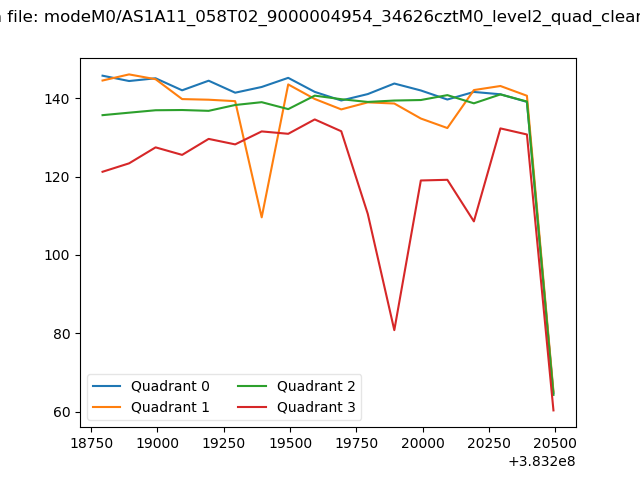 |
|
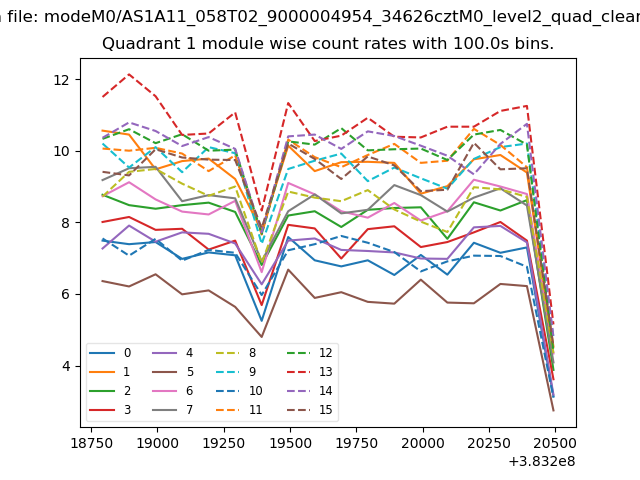
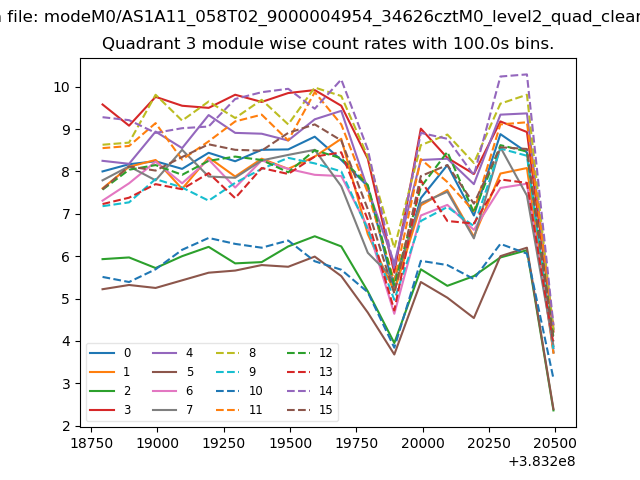
| Module-wise count rates for Quadrant A Data is divided into 100 sec bins |
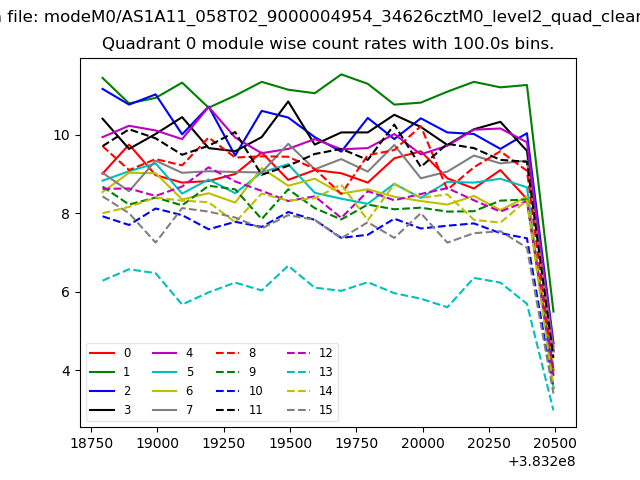 |
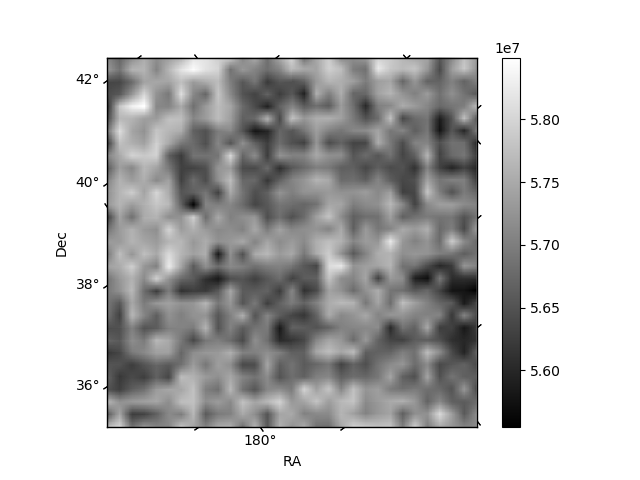 |
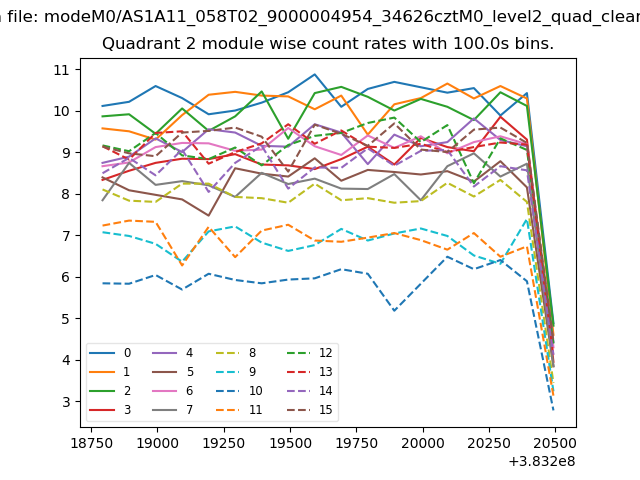
| Module-wise count rates for Quadrant B Data is divided into 100 sec bins |
 |
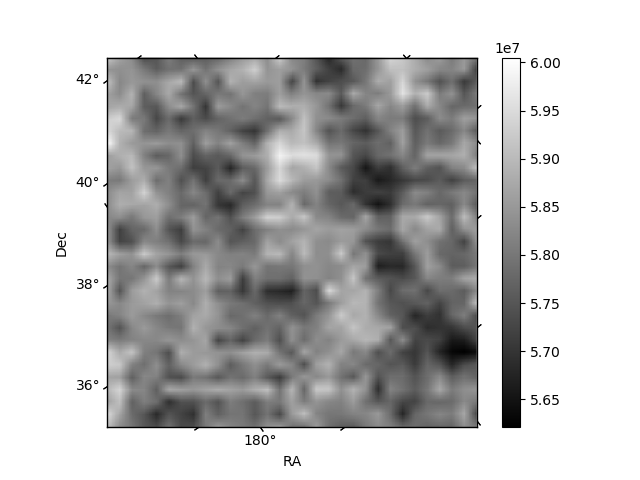 |
| Module-wise count rates for Quadrant C Data is divided into 100 sec bins |
 |
 |
| Module-wise count rates for Quadrant D Data is divided into 100 sec bins |
 |
 |
| Parameter | Plot |
|---|---|
| CZT HV Monitor | 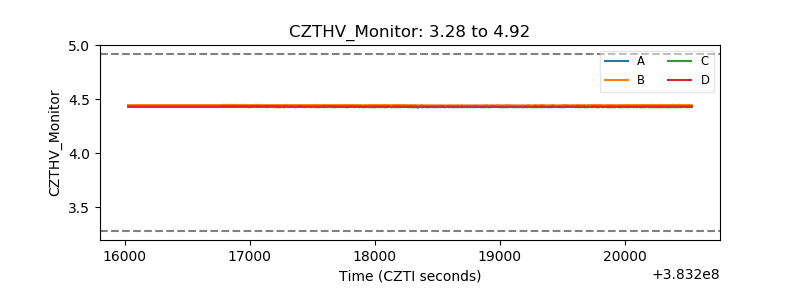 |
| D_VDD | 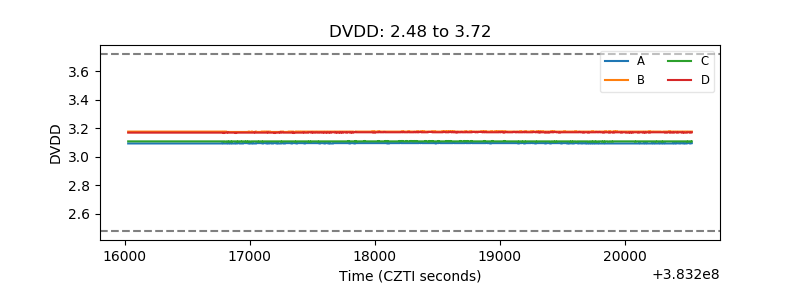 |
| Temperature 1 | 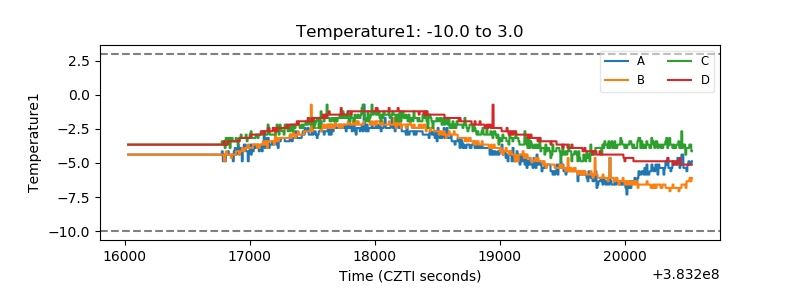 |
| Veto HV Monitor | 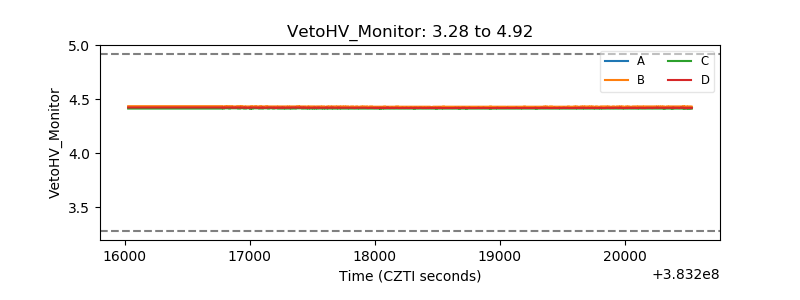 |
| Veto LLD | 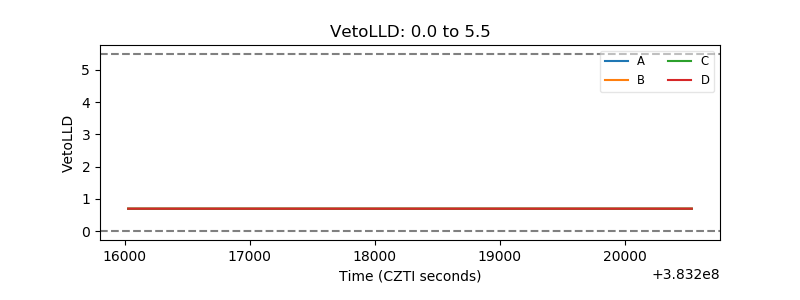 |
| Alpha Counter | 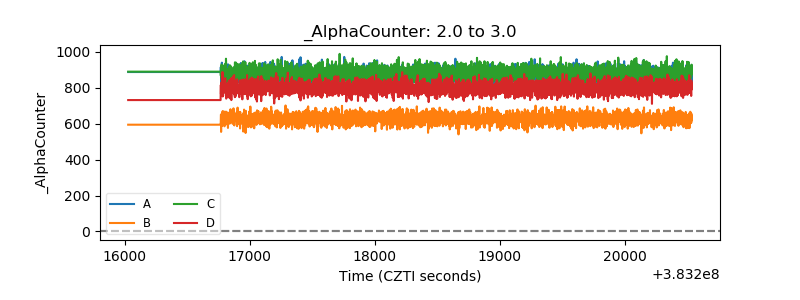 |
| _CPM_Rate | 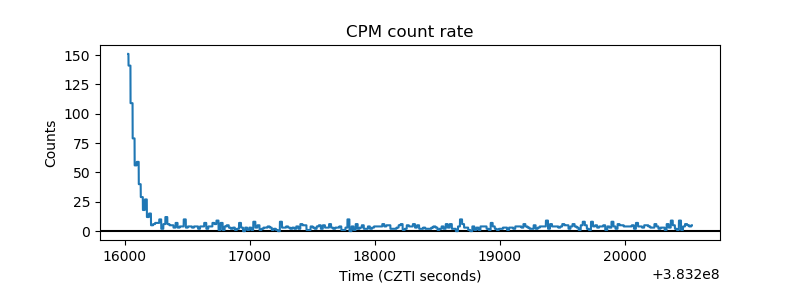 |
| CZT Counter | 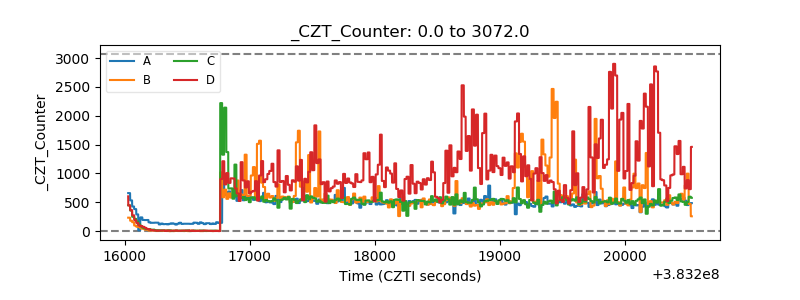 |
| +2.5 Volts monitor | 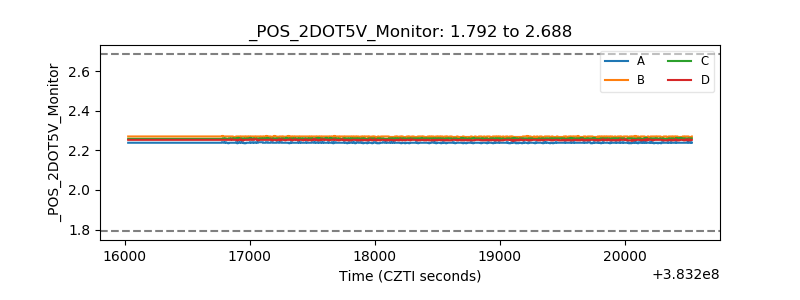 |
| +5 Volts monitor | 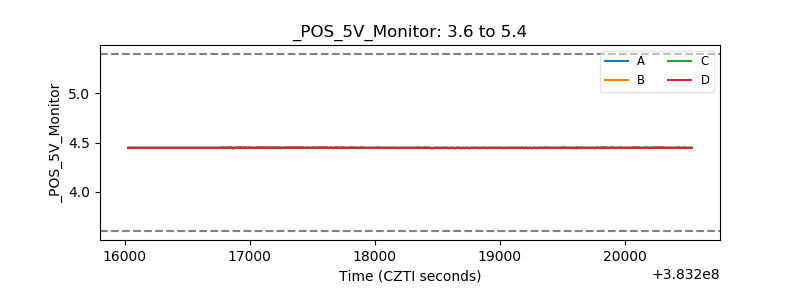 |
| _ROLL_ROT | 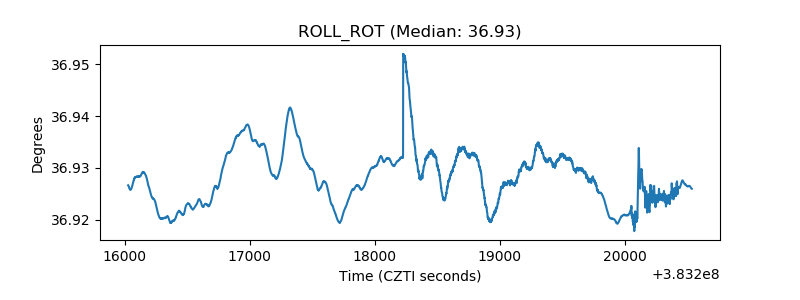 |
| _Roll_DEC | 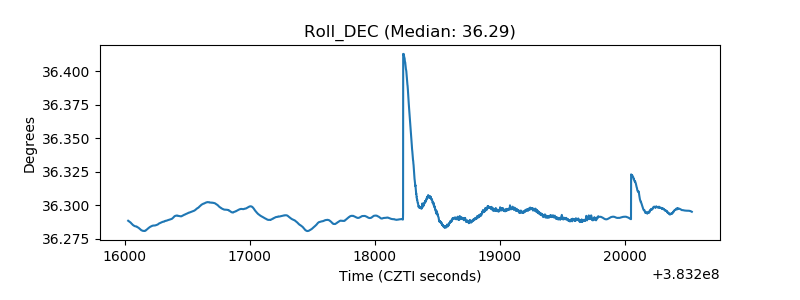 |
| _Roll_RA | 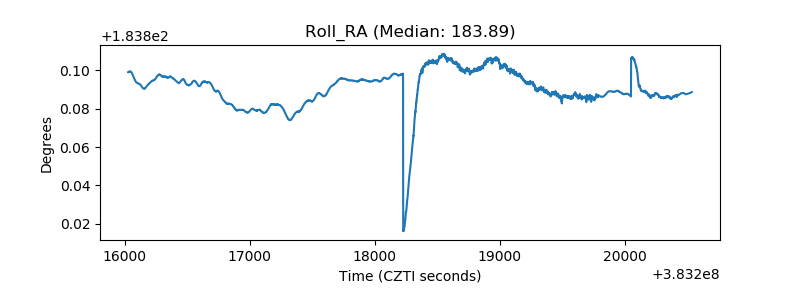 |
| Veto Counter | 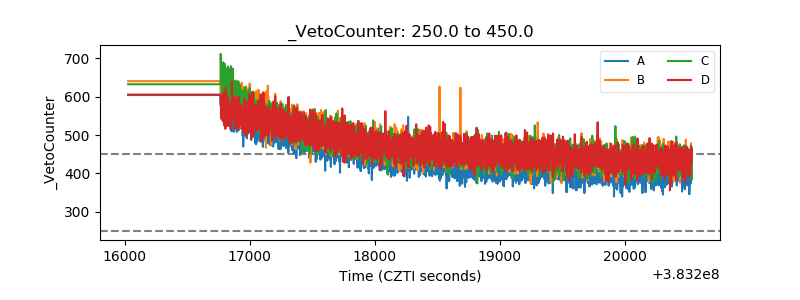 |