| Param | Original file | Final file |
|---|---|---|
| Filename | modeM0/AS1A11_058T02_9000004954_34625cztM0_level2.evt | modeM0/AS1A11_058T02_9000004954_34625cztM0_level2_quad_clean.evt |
| Size (bytes) | 442,863,360 | 51,845,760 |
| Size | 422.3 MB | 49.4 MB |
| Events in quadrant A | 2,666,859 | 311,103 |
| Events in quadrant B | 3,215,371 | 313,429 |
| Events in quadrant C | 2,920,761 | 298,978 |
| Events in quadrant D | 4,264,042 | 289,137 |
| Mode M9 | |||
|---|---|---|---|
| Quadrant | BADHDUFLAG | Total packets | Discarded packets |
| A | 0 | 28 | 0 |
| B | 0 | 28 | 0 |
| C | 0 | 28 | 0 |
| D | 0 | 29 | 0 |
| Mode M0 | |||
|---|---|---|---|
| Quadrant | BADHDUFLAG | Total packets | Discarded packets |
| A | 0 | 10720 | 3 |
| B | 0 | 12547 | 2 |
| C | 0 | 11305 | 2 |
| D | 0 | 16181 | 2 |
| Mode SS | |||
|---|---|---|---|
| Quadrant | BADHDUFLAG | Total packets | Discarded packets |
| A | 0 | 104 | 0 |
| B | 0 | 104 | 0 |
| C | 0 | 104 | 0 |
| D | 0 | 104 | 0 |
| Quadrant | Total seconds | Saturated seconds | Saturation percentage |
|---|---|---|---|
| A | 5089 | 5 | 0.098251% |
| B | 5089 | 126 | 2.475928% |
| C | 5089 | 71 | 1.395166% |
| D | 5089 | 63 | 1.237964% |
Noise dominated data is calculated using 1-second bins in cleaned event files. If a bin has >2000 counts, and if more than 50% of those come from <1% of pixels, then it is considered to be noise-dominated and hence unusable.
| Quadrant | # 1 sec bins | Bins with >0 counts | Bins with >2000 counts | High rate bins dominated by noise | Noise dominated (total time) | Noise dominated (detector-on time) | Marked lightcurve |
|---|---|---|---|---|---|---|---|
| A | 7213 | 5090 | 0 | 0 | 0.00% | 0.00% |  |
| B | 7213 | 5090 | 69 | 69 | 0.96% | 1.36% | 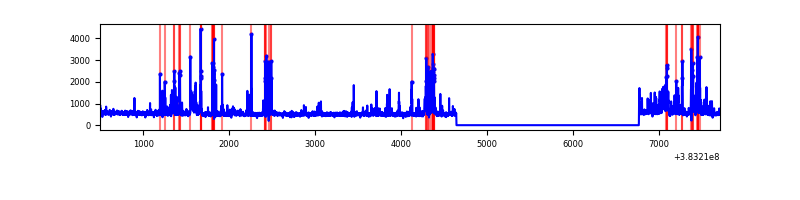 |
| C | 7213 | 5090 | 52 | 52 | 0.72% | 1.02% |  |
| D | 7213 | 5090 | 43 | 43 | 0.60% | 0.84% |  |
Top three noisy pixels from each quadrant. If the there are fewer than three noisy pixels in the level2.evt file, extra rows are filled as -1
| Pixel properties | Quadrant properties | ||||||
|---|---|---|---|---|---|---|---|
| Quadrant | DetID | PixID | Counts | Sigma | Mean | Median | Sigma |
| A | 10 | 83 | 43748 | 327.37 | 669 | 660 | 131.6 |
| A | 13 | 6 | 18124 | 132.69 | 669 | 660 | 131.6 |
| A | 15 | 169 | 14711 | 106.76 | 669 | 660 | 131.6 |
| B | 5 | 172 | 500086 | 4073.78 | 650 | 635 | 122.6 |
| B | 10 | 245 | 42392 | 340.59 | 650 | 635 | 122.6 |
| B | 4 | 171 | 40001 | 321.09 | 650 | 635 | 122.6 |
| C | 0 | 10 | 225303 | 1562.37 | 628 | 633 | 143.8 |
| C | 15 | 214 | 214864 | 1489.78 | 628 | 633 | 143.8 |
| C | 14 | 67 | 20408 | 137.52 | 628 | 633 | 143.8 |
| D | 8 | 195 | 1453991 | 9229.32 | 641 | 622 | 157.5 |
| D | 12 | 6 | 79059 | 498.1 | 641 | 622 | 157.5 |
| D | 2 | 249 | 59245 | 372.27 | 641 | 622 | 157.5 |
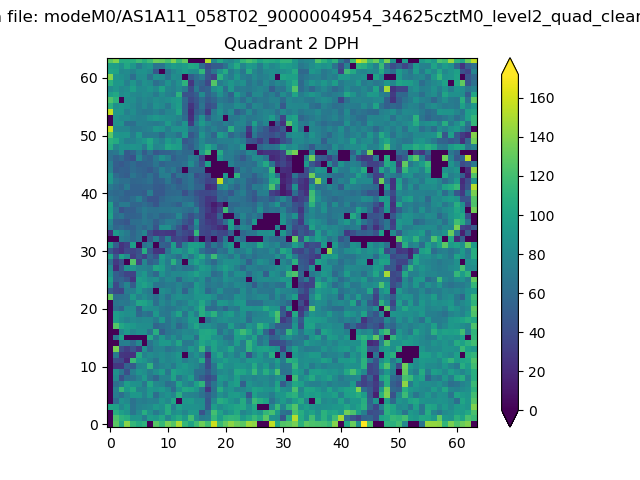
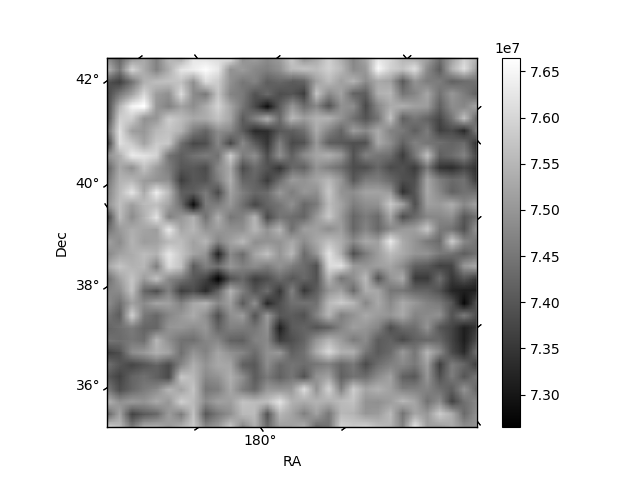
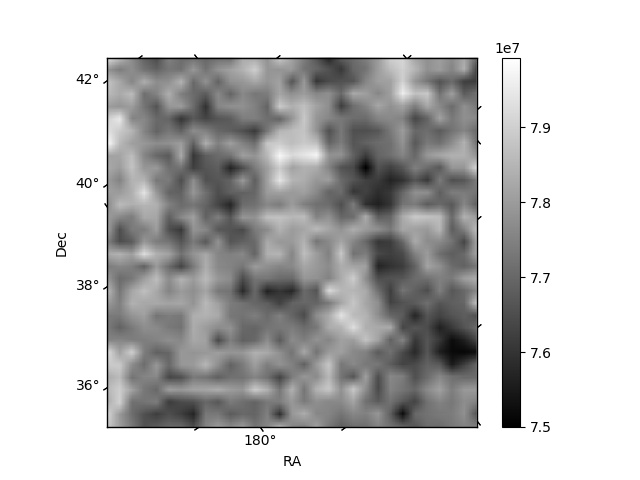
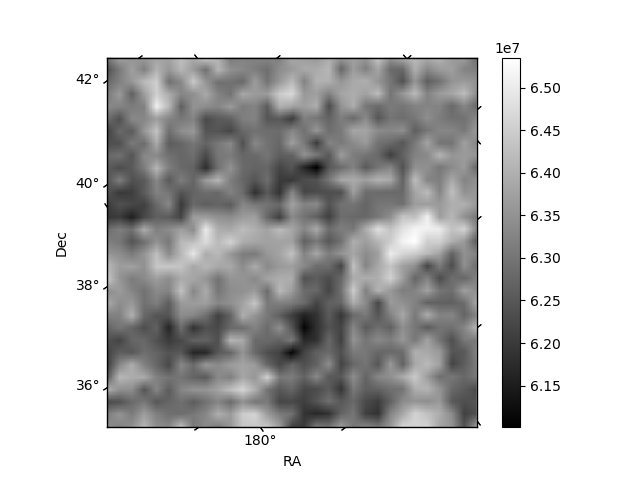
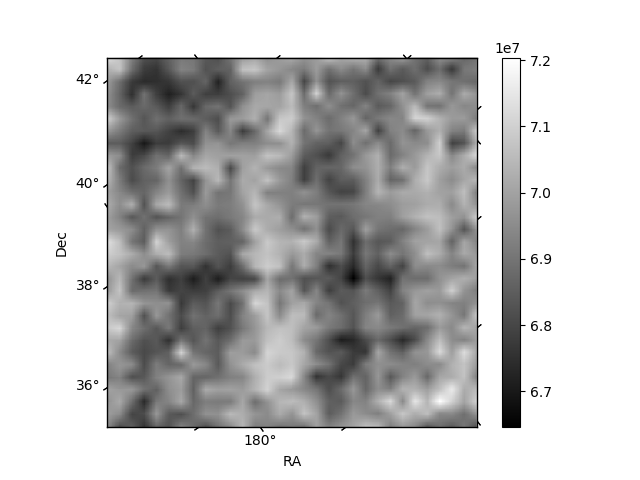
Histogram calculated using DETX and DETY for each event in the final _common_clean file
| Quadrant A | 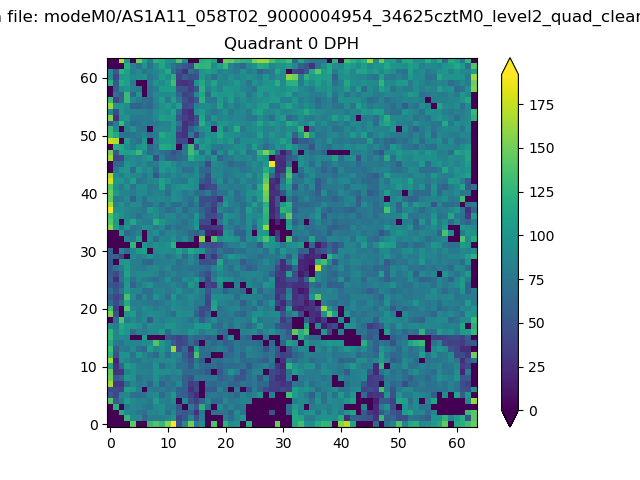 |
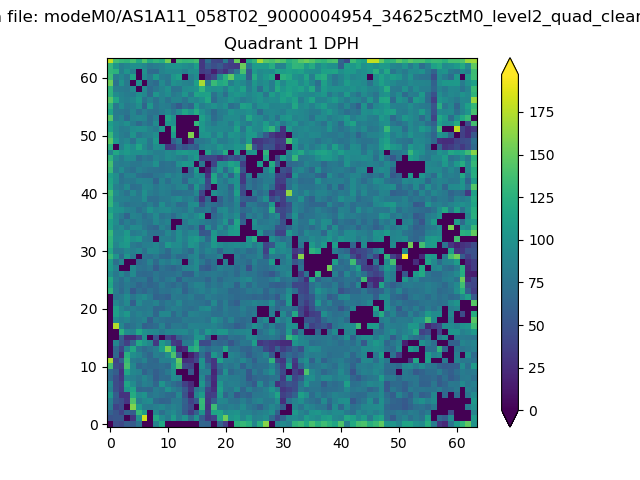 |
Quadrant B |
|---|---|---|---|
| Quadrant D | 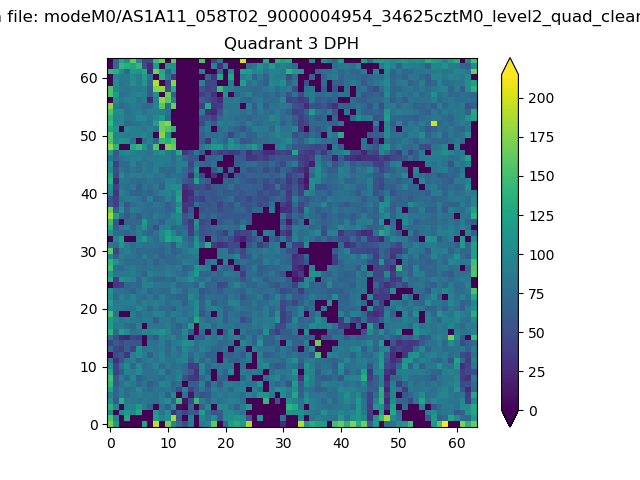 |
 |
Quadrant C |
| Plot type | Count rate plots | Images |
|---|---|---|
| Comparison with Poisson distribution Blue bars denote a histogram of data divided into 1 sec bins. Red curve is a Poisson curve with rate = median count rate of data. |
 |
 |
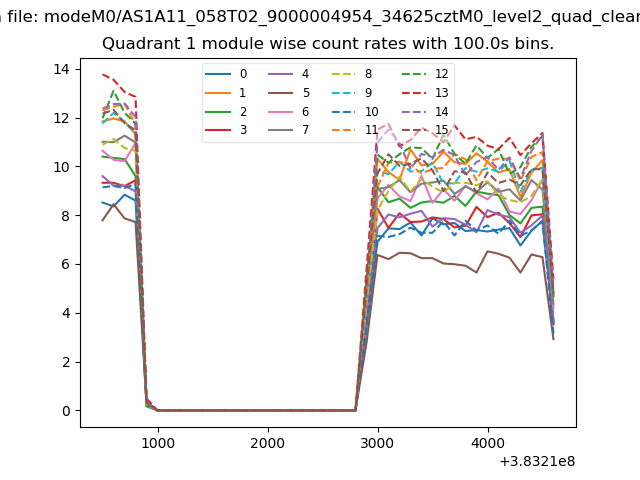
| Quadrant-wise count rates Data is divided into 100 sec bins |
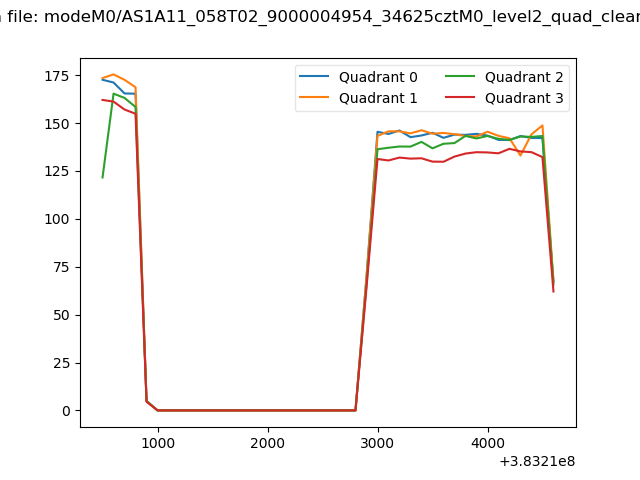 |
|
| Module-wise count rates for Quadrant A Data is divided into 100 sec bins |
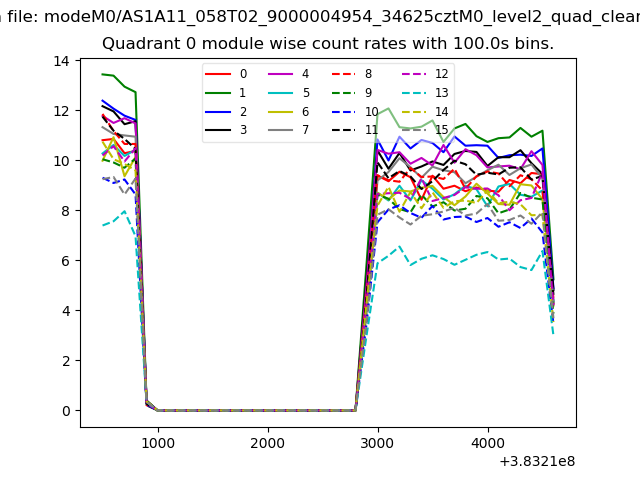 |
 |
| Module-wise count rates for Quadrant B Data is divided into 100 sec bins |
 |
 |
| Module-wise count rates for Quadrant C Data is divided into 100 sec bins |
 |
 |
| Module-wise count rates for Quadrant D Data is divided into 100 sec bins |
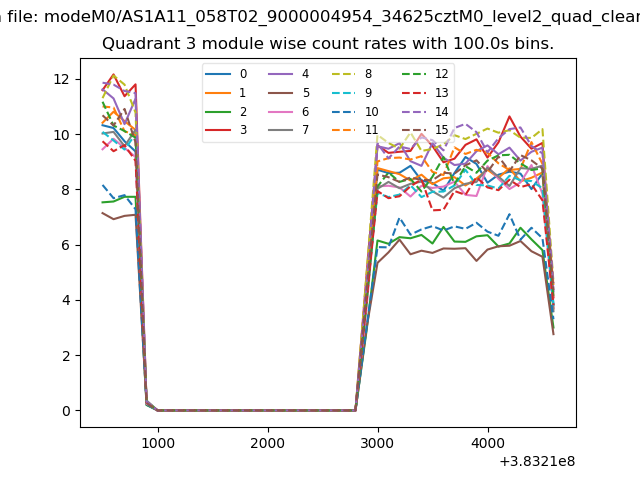 |
 |
| Parameter | Plot |
|---|---|
| CZT HV Monitor | 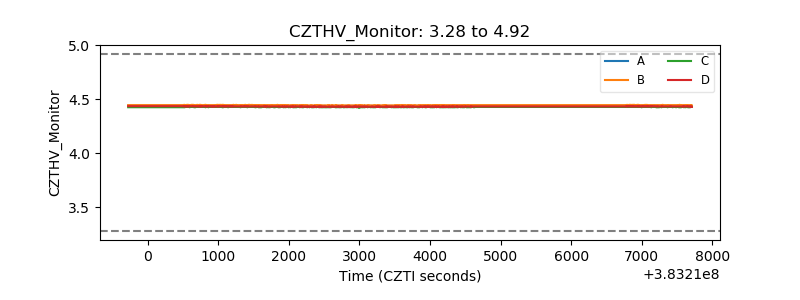 |
| D_VDD | 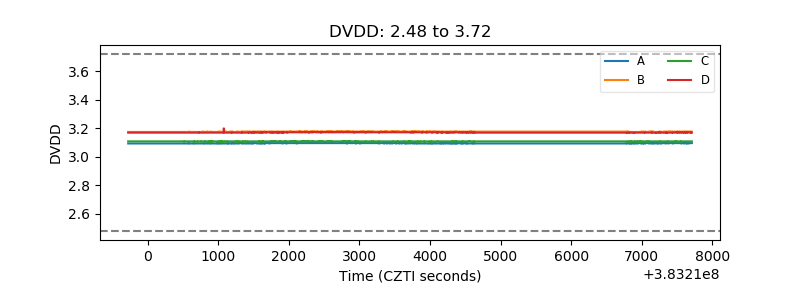 |
| Temperature 1 | 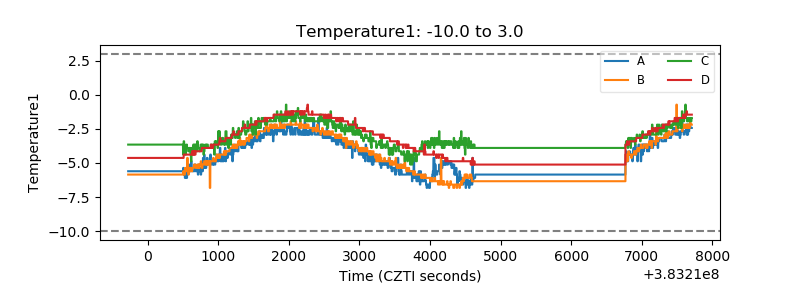 |
| Veto HV Monitor | 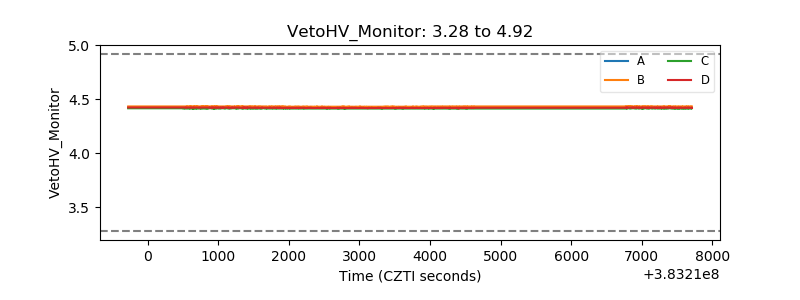 |
| Veto LLD | 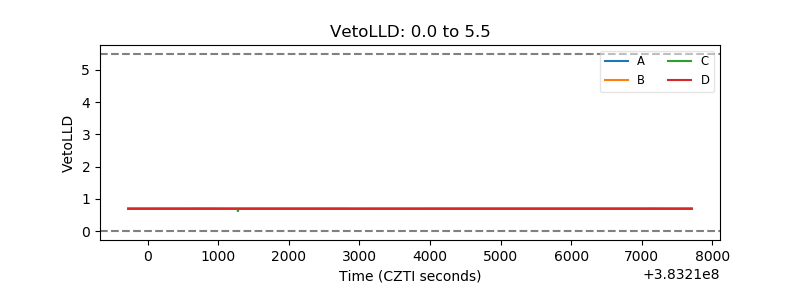 |
| Alpha Counter | 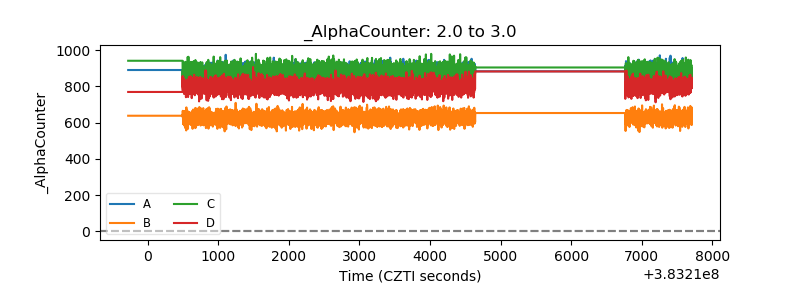 |
| _CPM_Rate |  |
| CZT Counter | 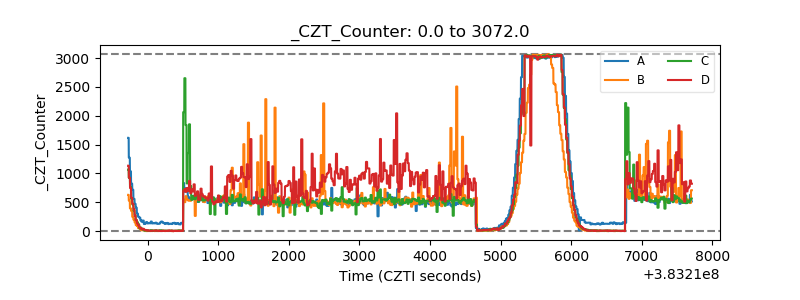 |
| +2.5 Volts monitor | 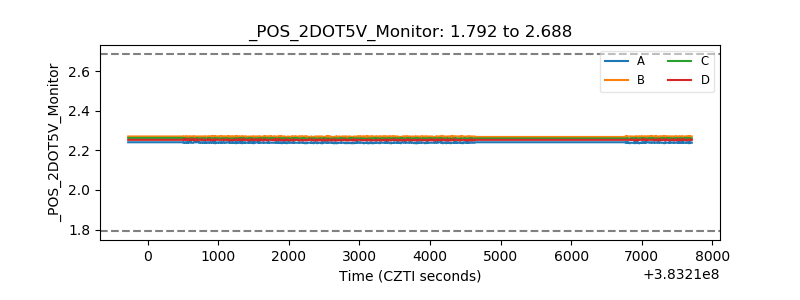 |
| +5 Volts monitor | 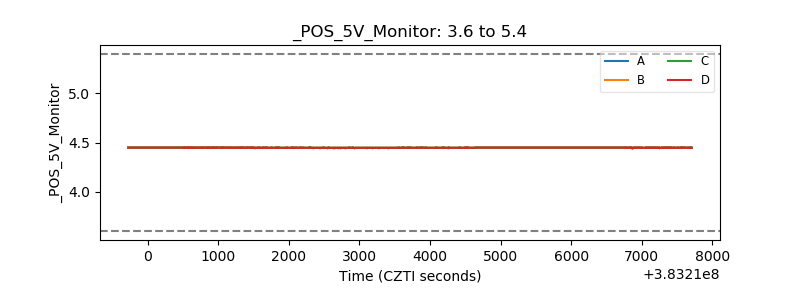 |
| _ROLL_ROT | 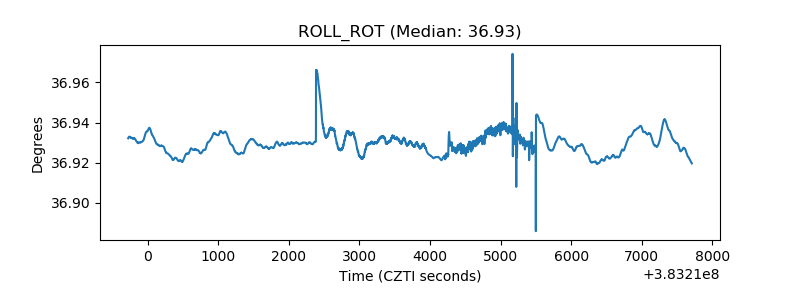 |
| _Roll_DEC | 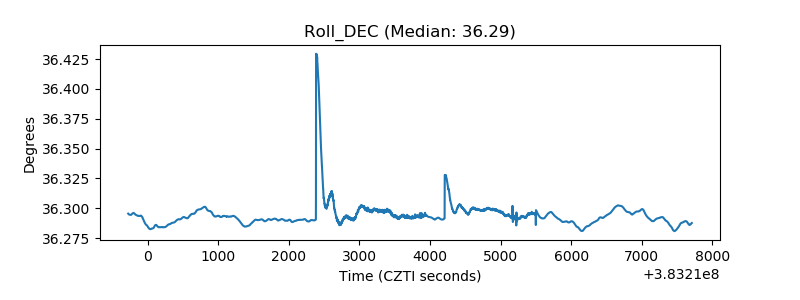 |
| _Roll_RA | 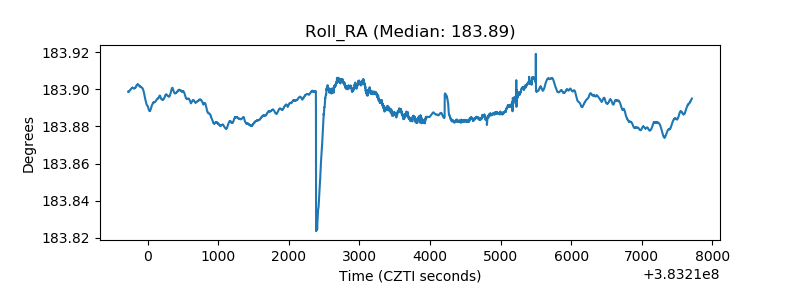 |
| Veto Counter | 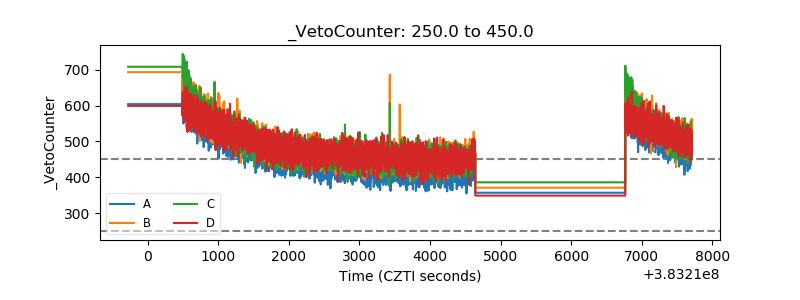 |