| Param | Original file | Final file |
|---|---|---|
| Filename | modeM0/AS1A11_058T02_9000004954_34623cztM0_level2.evt | modeM0/AS1A11_058T02_9000004954_34623cztM0_level2_quad_clean.evt |
| Size (bytes) | 25,600,320 | 7,197,120 |
| Size | 24.4 MB | 6.9 MB |
| Events in quadrant A | 193,010 | 57,152 |
| Events in quadrant B | 183,504 | 37,747 |
| Events in quadrant C | 181,602 | 47,547 |
| Events in quadrant D | 190,734 | 43,337 |
| Mode M9 | |||
|---|---|---|---|
| Quadrant | BADHDUFLAG | Total packets | Discarded packets |
| A | 0 | 3 | 1 |
| B | 0 | 3 | 1 |
| C | 0 | 4 | 1 |
| D | 0 | 6 | 6 |
| Mode M0 | |||
|---|---|---|---|
| Quadrant | BADHDUFLAG | Total packets | Discarded packets |
| A | 0 | 2764 | 1958 |
| B | 0 | 4366 | 3662 |
| C | 0 | 3058 | 2335 |
| D | 0 | 3771 | 3000 |
| Mode SS | |||
|---|---|---|---|
| Quadrant | BADHDUFLAG | Total packets | Discarded packets |
| A | 0 | 30 | 16 |
| B | 0 | 26 | 14 |
| C | 0 | 23 | 18 |
| D | 0 | 28 | 18 |
| Quadrant | Total seconds | Saturated seconds | Saturation percentage |
|---|---|---|---|
| A | 392 | 1 | 0.255102% |
| B | 260 | 7 | 2.692308% |
| C | 336 | 3 | 0.892857% |
| D | 312 | 0 | 0.000000% |
Noise dominated data is calculated using 1-second bins in cleaned event files. If a bin has >2000 counts, and if more than 50% of those come from <1% of pixels, then it is considered to be noise-dominated and hence unusable.
| Quadrant | # 1 sec bins | Bins with >0 counts | Bins with >2000 counts | High rate bins dominated by noise | Noise dominated (total time) | Noise dominated (detector-on time) | Marked lightcurve |
|---|---|---|---|---|---|---|---|
| A | 1186 | 597 | 0 | 0 | 0.00% | 0.00% | 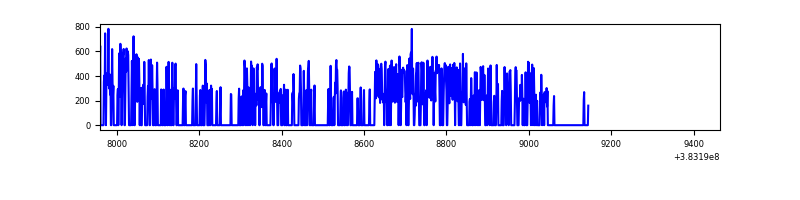 |
| B | 1181 | 410 | 4 | 4 | 0.34% | 0.98% | 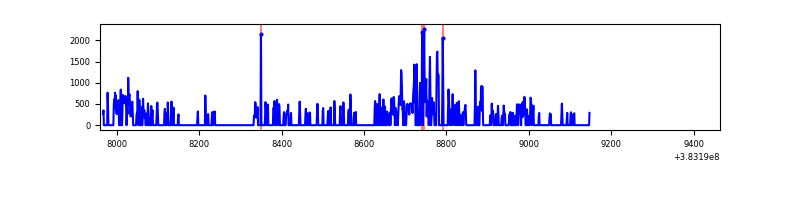 |
| C | 1469 | 530 | 1 | 1 | 0.07% | 0.19% | 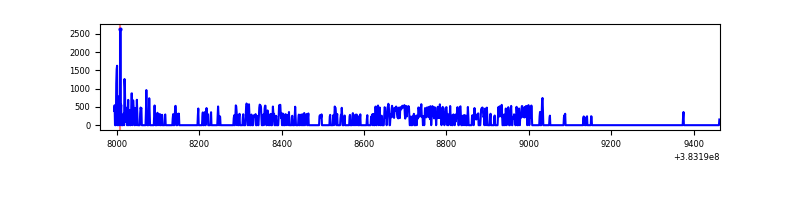 |
| D | 1136 | 485 | 0 | 0 | 0.00% | 0.00% | 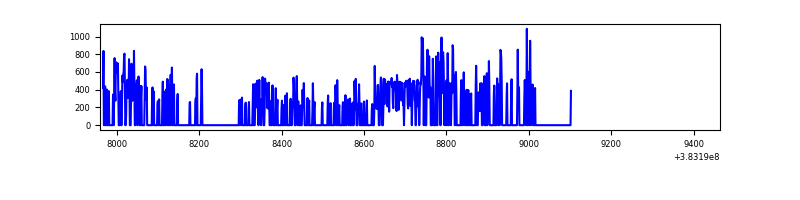 |
Top three noisy pixels from each quadrant. If the there are fewer than three noisy pixels in the level2.evt file, extra rows are filled as -1
| Pixel properties | Quadrant properties | ||||||
|---|---|---|---|---|---|---|---|
| Quadrant | DetID | PixID | Counts | Sigma | Mean | Median | Sigma |
| A | 10 | 83 | 6137 | 522.21 | 47 | 46 | 11.7 |
| A | 9 | 143 | 1222 | 100.82 | 47 | 46 | 11.7 |
| A | 7 | 16 | 687 | 54.96 | 47 | 46 | 11.7 |
| B | 5 | 172 | 58818 | 7263.67 | 31 | 30 | 8.1 |
| B | 4 | 232 | 858 | 102.31 | 31 | 30 | 8.1 |
| B | 0 | 189 | 832 | 99.09 | 31 | 30 | 8.1 |
| C | 15 | 214 | 14351 | 1347.24 | 38 | 38 | 10.6 |
| C | 0 | 10 | 14133 | 1326.72 | 38 | 38 | 10.6 |
| C | 10 | 49 | 1726 | 158.89 | 38 | 38 | 10.6 |
| D | 8 | 195 | 48537 | 4537.49 | 36 | 35 | 10.7 |
| D | 3 | 238 | 1289 | 117.31 | 36 | 35 | 10.7 |
| D | 1 | 47 | 1267 | 115.26 | 36 | 35 | 10.7 |
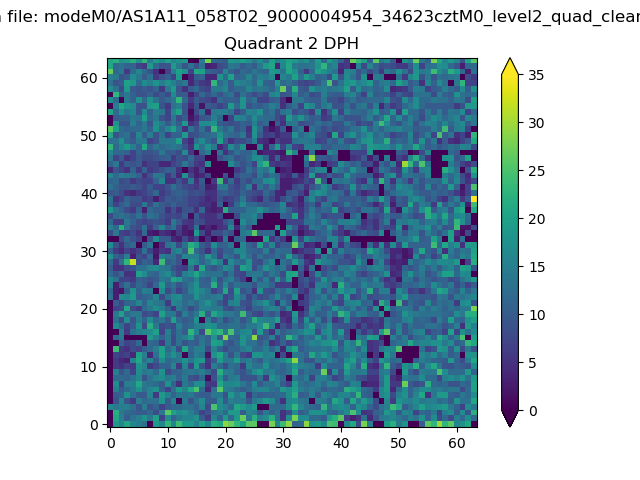
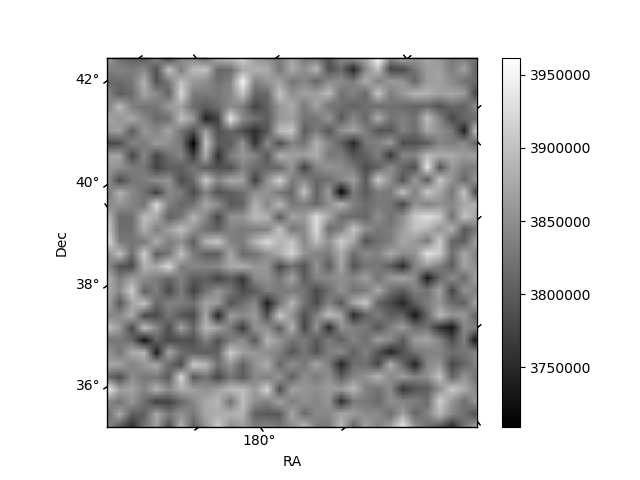
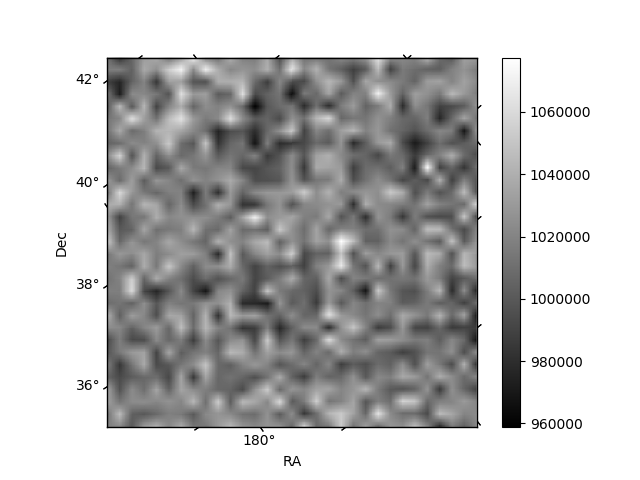
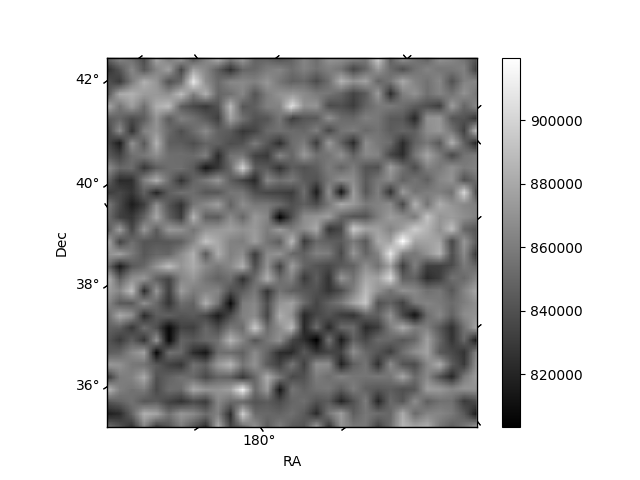
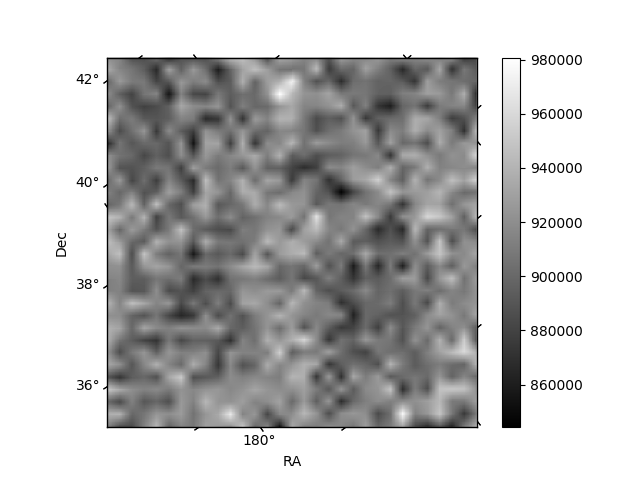
Histogram calculated using DETX and DETY for each event in the final _common_clean file
| Quadrant A | 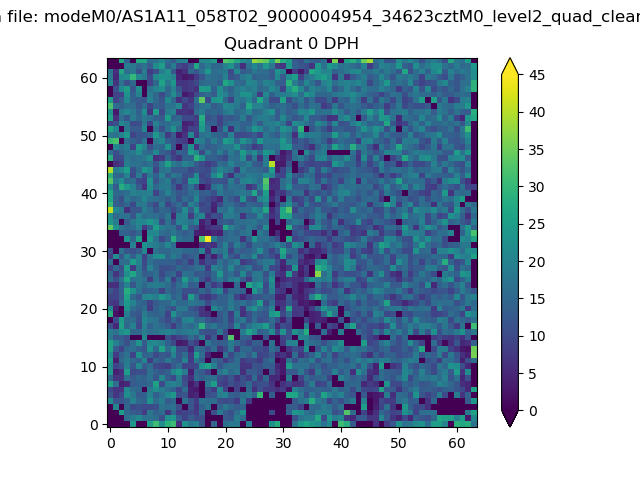 |
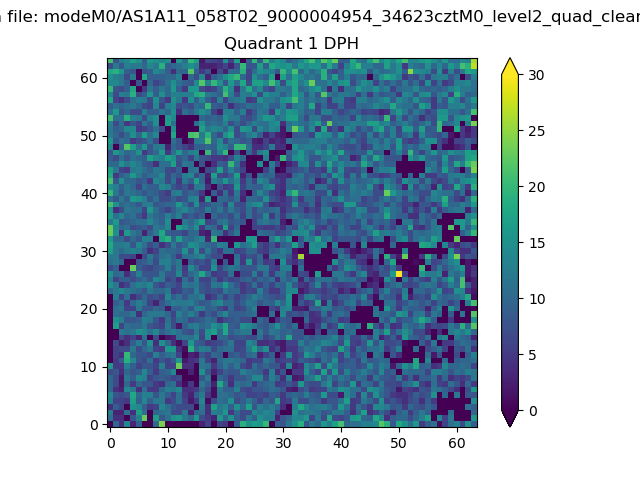 |
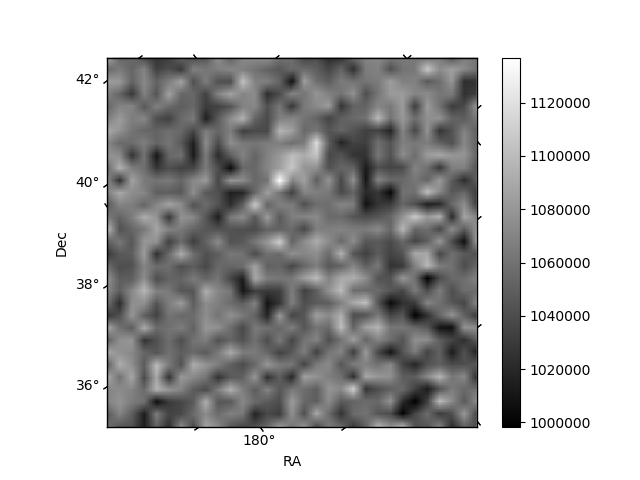
Quadrant B |
|---|---|---|---|
| Quadrant D | 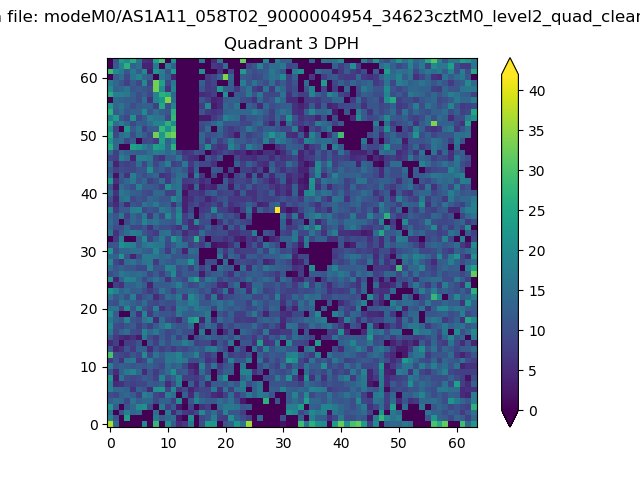 |
 |
Quadrant C |
| Plot type | Count rate plots | Images |
|---|---|---|
| Comparison with Poisson distribution Blue bars denote a histogram of data divided into 1 sec bins. Red curve is a Poisson curve with rate = median count rate of data. |
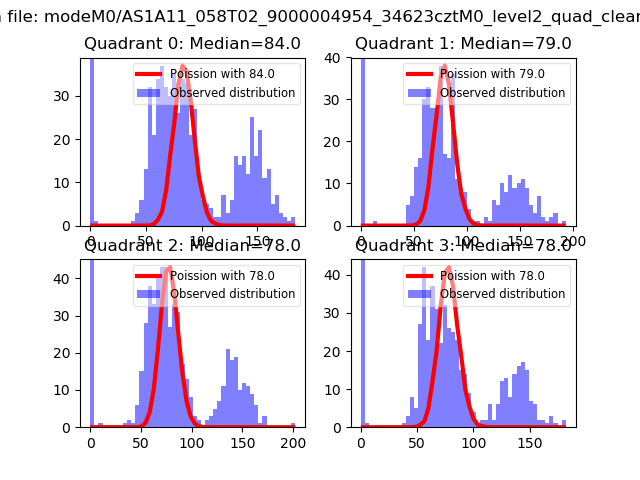 |
 |
| Quadrant-wise count rates Data is divided into 100 sec bins |
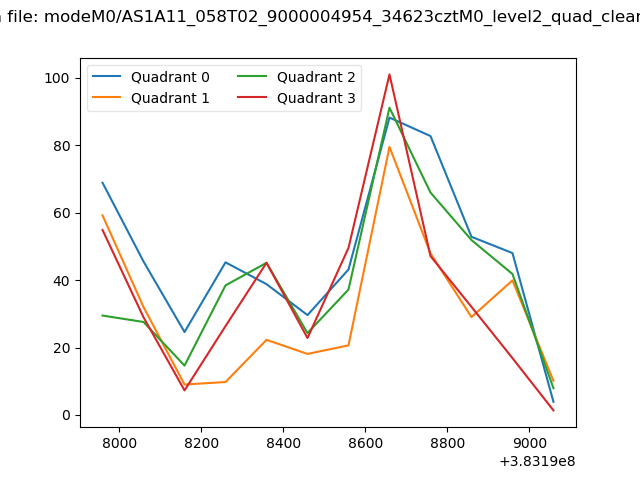 |
|
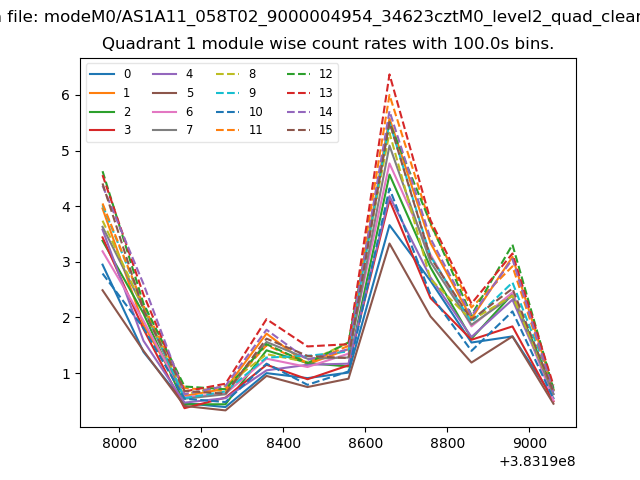
| Module-wise count rates for Quadrant A Data is divided into 100 sec bins |
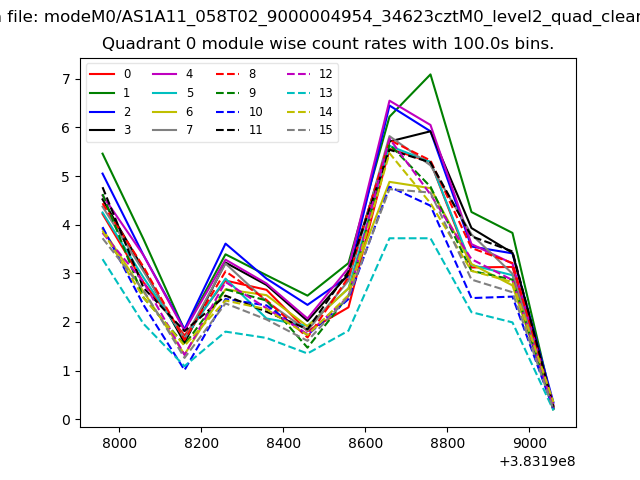 |
 |
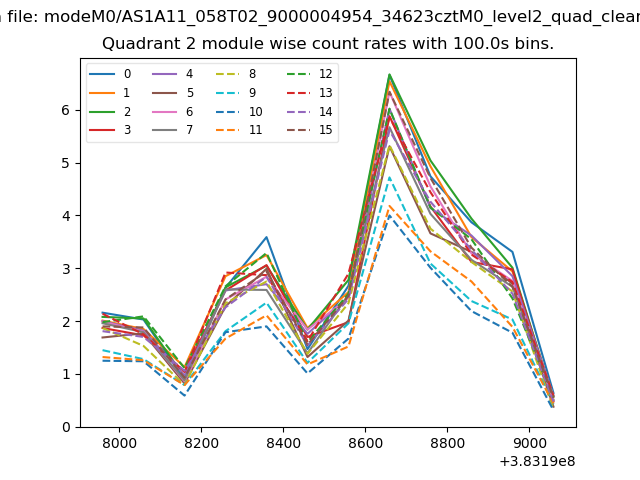
| Module-wise count rates for Quadrant B Data is divided into 100 sec bins |
 |
 |
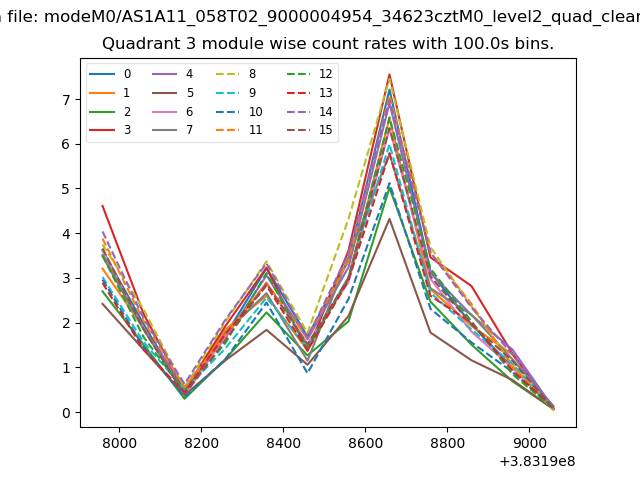
| Module-wise count rates for Quadrant C Data is divided into 100 sec bins |
 |
 |
| Module-wise count rates for Quadrant D Data is divided into 100 sec bins |
 |
 |
| Parameter | Plot |
|---|---|
| CZT HV Monitor | 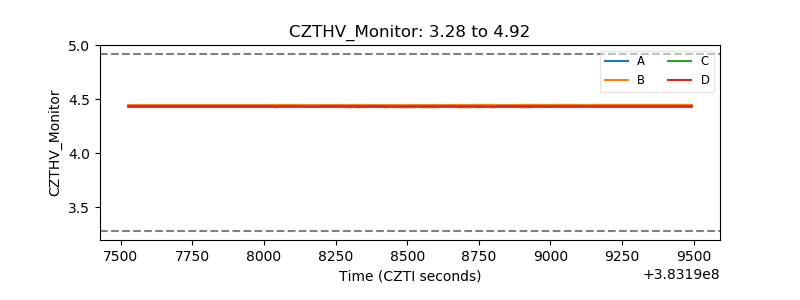 |
| D_VDD | 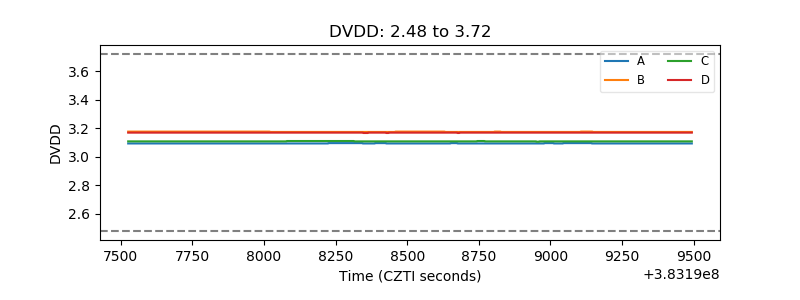 |
| Temperature 1 | 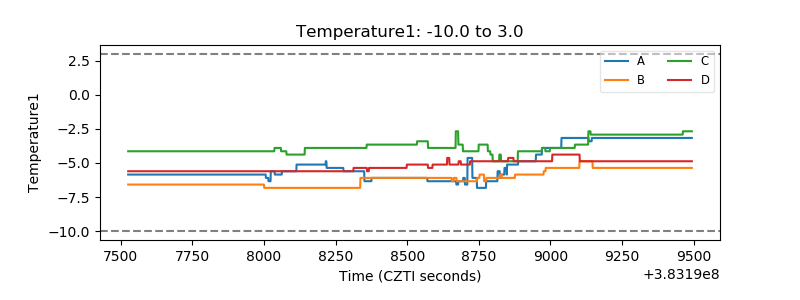 |
| Veto HV Monitor | 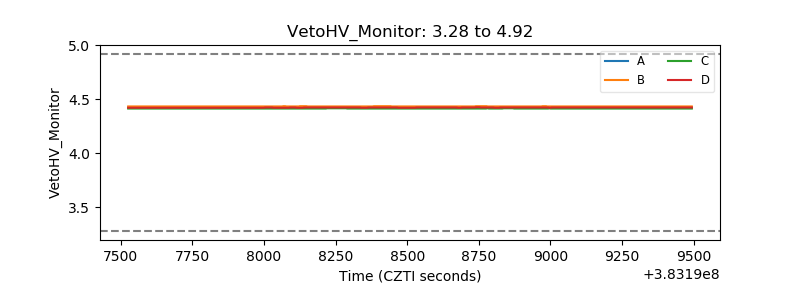 |
| Veto LLD | 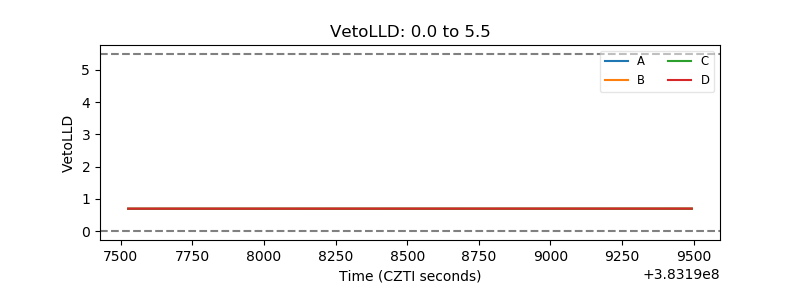 |
| Alpha Counter | 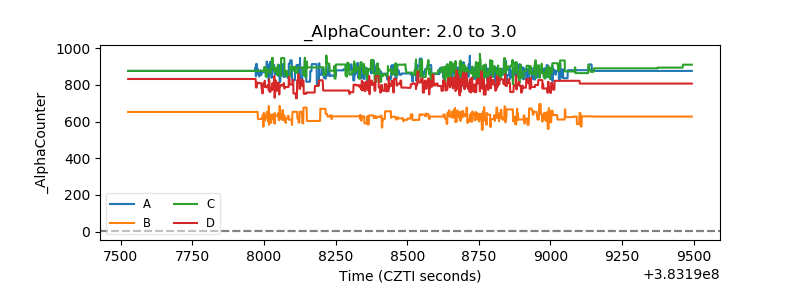 |
| _CPM_Rate | 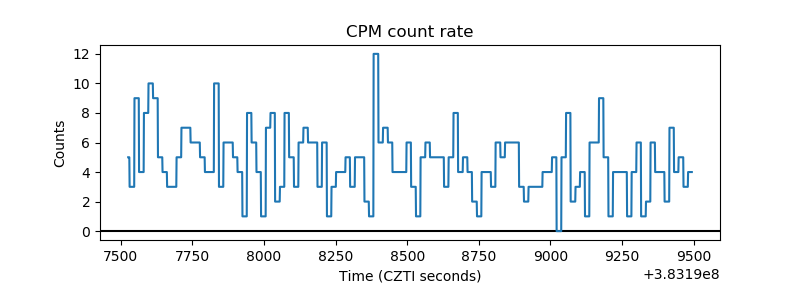 |
| CZT Counter | 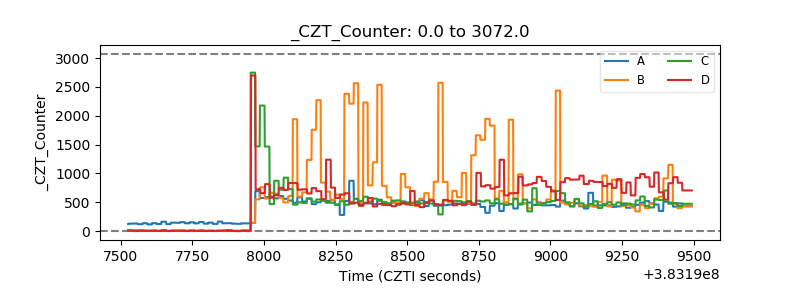 |
| +2.5 Volts monitor | 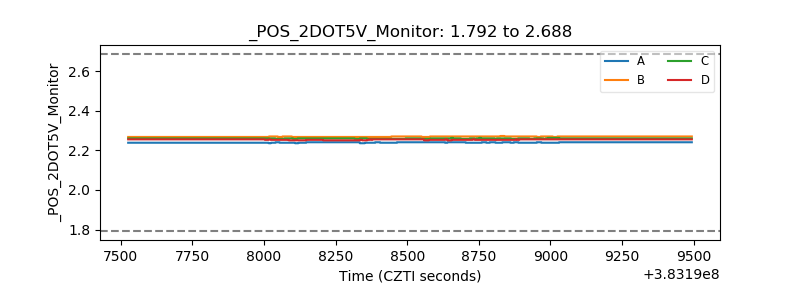 |
| +5 Volts monitor | 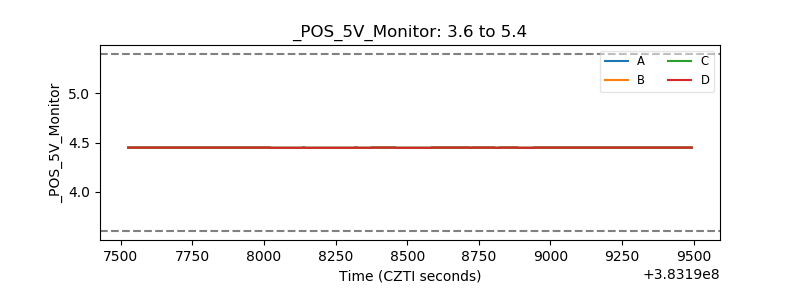 |
| _ROLL_ROT | 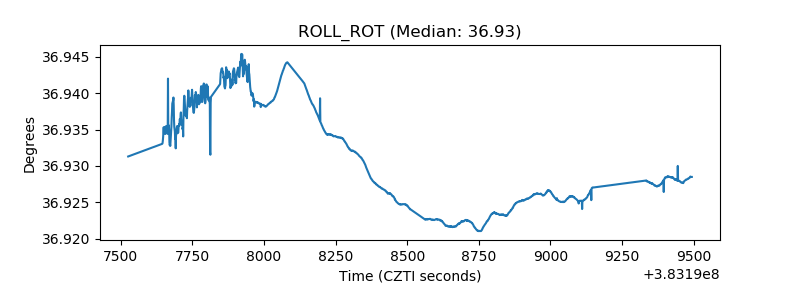 |
| _Roll_DEC | 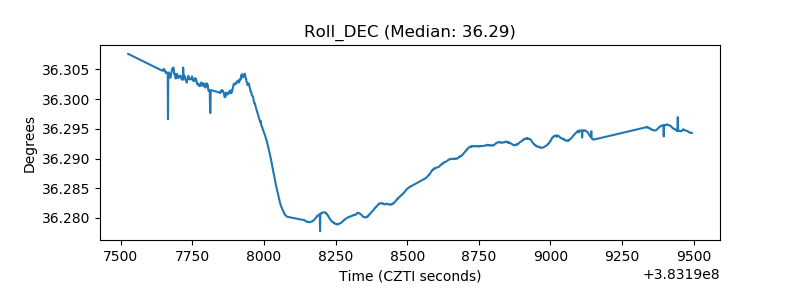 |
| _Roll_RA | 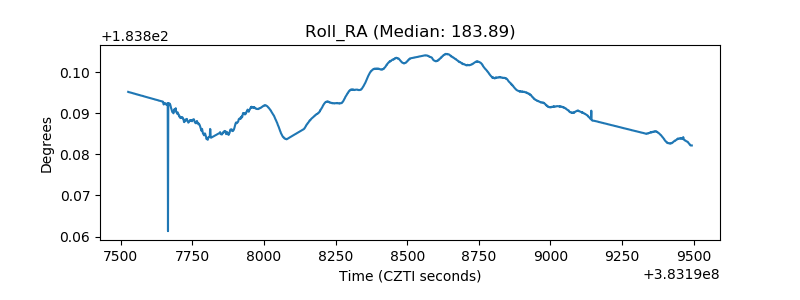 |
| Veto Counter | 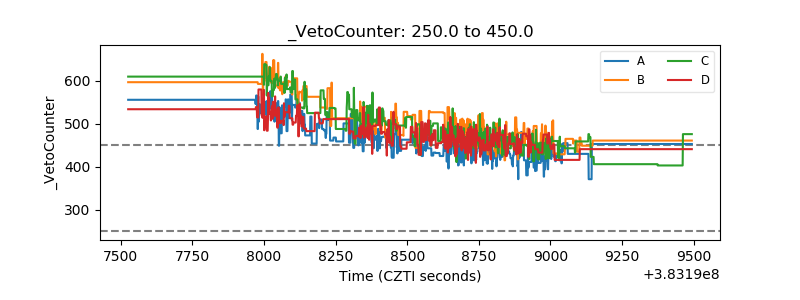 |