| Param | Original file | Final file |
|---|---|---|
| Filename | modeM0/AS1A11_058T02_9000004954_34616cztM0_level2.evt | modeM0/AS1A11_058T02_9000004954_34616cztM0_level2_quad_clean.evt |
| Size (bytes) | 418,049,280 | 47,975,040 |
| Size | 398.7 MB | 45.8 MB |
| Events in quadrant A | 1,911,809 | 316,828 |
| Events in quadrant B | 2,436,566 | 317,973 |
| Events in quadrant C | 2,044,300 | 317,408 |
| Events in quadrant D | 6,012,405 | 234,008 |
| Mode M9 | |||
|---|---|---|---|
| Quadrant | BADHDUFLAG | Total packets | Discarded packets |
| A | 0 | 13 | 0 |
| B | 0 | 13 | 0 |
| C | 0 | 13 | 0 |
| D | 0 | 13 | 0 |
| Mode M0 | |||
|---|---|---|---|
| Quadrant | BADHDUFLAG | Total packets | Discarded packets |
| A | 0 | 8091 | 2 |
| B | 0 | 9655 | 1 |
| C | 0 | 8351 | 1 |
| D | 0 | 20459 | 1 |
| Mode SS | |||
|---|---|---|---|
| Quadrant | BADHDUFLAG | Total packets | Discarded packets |
| A | 0 | 78 | 0 |
| B | 0 | 78 | 0 |
| C | 0 | 78 | 0 |
| D | 0 | 78 | 0 |
| Quadrant | Total seconds | Saturated seconds | Saturation percentage |
|---|---|---|---|
| A | 3755 | 41 | 1.091877% |
| B | 3755 | 133 | 3.541944% |
| C | 3755 | 30 | 0.798935% |
| D | 3755 | 1456 | 38.774967% |
Noise dominated data is calculated using 1-second bins in cleaned event files. If a bin has >2000 counts, and if more than 50% of those come from <1% of pixels, then it is considered to be noise-dominated and hence unusable.
| Quadrant | # 1 sec bins | Bins with >0 counts | Bins with >2000 counts | High rate bins dominated by noise | Noise dominated (total time) | Noise dominated (detector-on time) | Marked lightcurve |
|---|---|---|---|---|---|---|---|
| A | 5038 | 3756 | 33 | 33 | 0.66% | 0.88% | 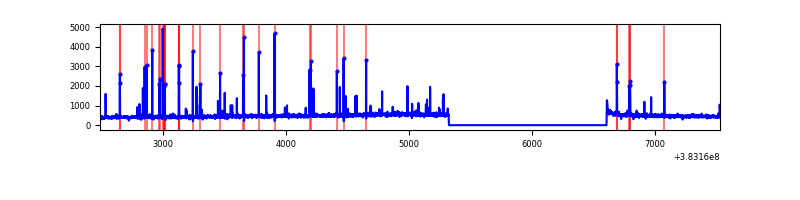 |
| B | 5038 | 3756 | 86 | 86 | 1.71% | 2.29% | 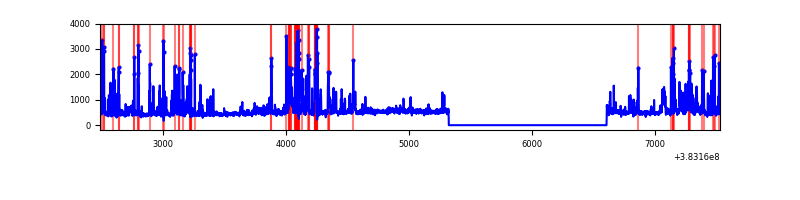 |
| C | 5038 | 3756 | 17 | 17 | 0.34% | 0.45% | 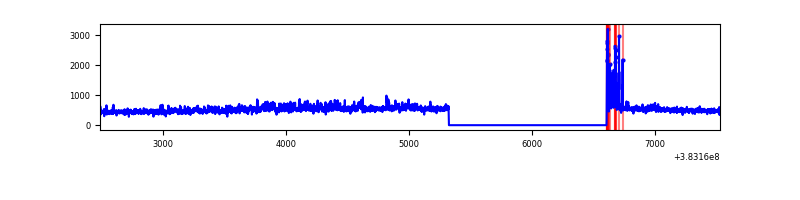 |
| D | 5038 | 3756 | 1170 | 1170 | 23.22% | 31.15% |  |
Top three noisy pixels from each quadrant. If the there are fewer than three noisy pixels in the level2.evt file, extra rows are filled as -1
| Pixel properties | Quadrant properties | ||||||
|---|---|---|---|---|---|---|---|
| Quadrant | DetID | PixID | Counts | Sigma | Mean | Median | Sigma |
| A | 15 | 169 | 161590 | 1800.8 | 441 | 432 | 89.5 |
| A | 10 | 83 | 24681 | 270.96 | 441 | 432 | 89.5 |
| A | 13 | 6 | 11745 | 126.41 | 441 | 432 | 89.5 |
| B | 5 | 172 | 547605 | 6375.44 | 433 | 422 | 85.8 |
| B | 4 | 232 | 97528 | 1131.42 | 433 | 422 | 85.8 |
| B | 3 | 112 | 20579 | 234.86 | 433 | 422 | 85.8 |
| C | 15 | 214 | 156001 | 1564.99 | 424 | 428 | 99.4 |
| C | 14 | 67 | 131036 | 1313.86 | 424 | 428 | 99.4 |
| C | 0 | 10 | 75631 | 756.51 | 424 | 428 | 99.4 |
| D | 2 | 249 | 3152007 | 32799.34 | 350 | 342 | 96.1 |
| D | 8 | 195 | 913875 | 9507.13 | 350 | 342 | 96.1 |
| D | 2 | 207 | 119486 | 1239.93 | 350 | 342 | 96.1 |
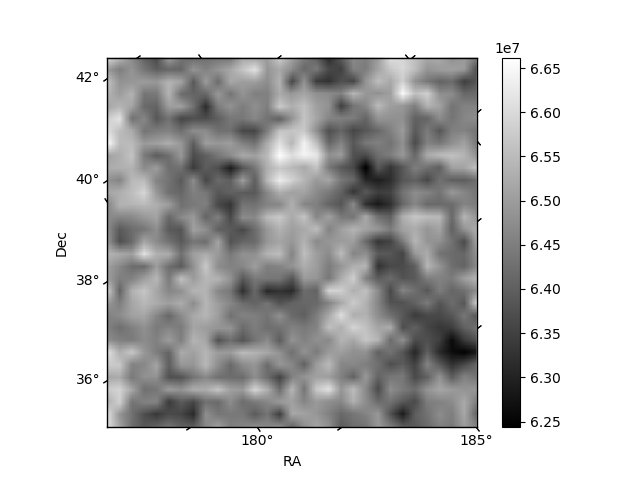
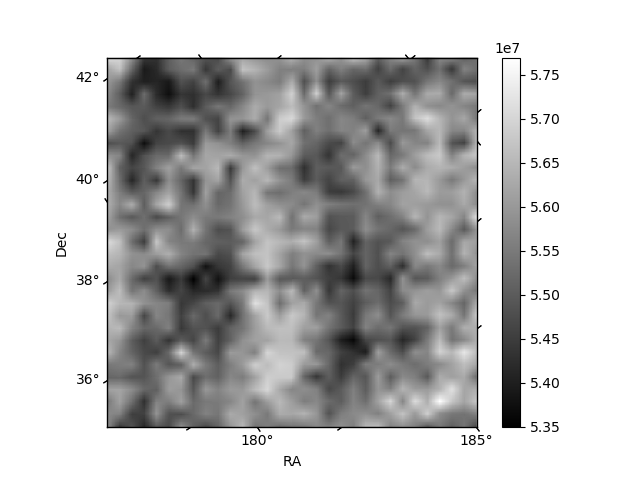
Histogram calculated using DETX and DETY for each event in the final _common_clean file
| Quadrant A | 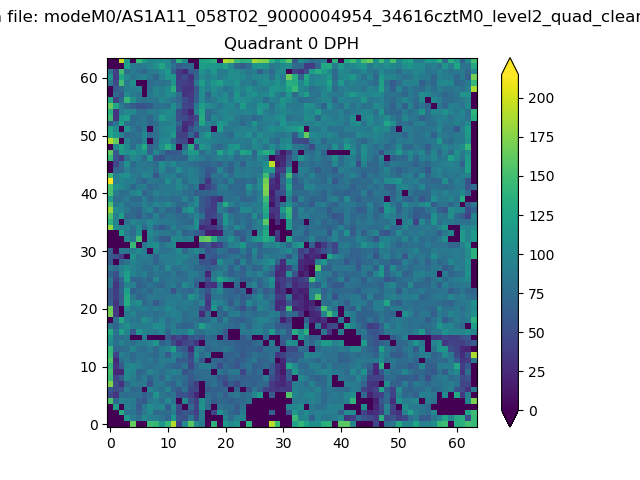 |
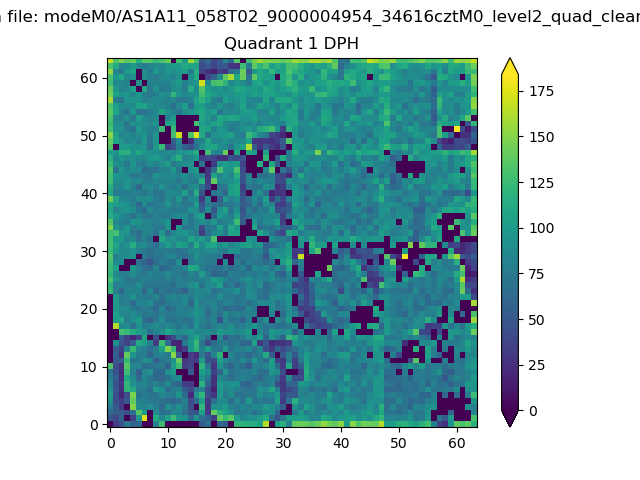 |
Quadrant B |
|---|---|---|---|
| Quadrant D | 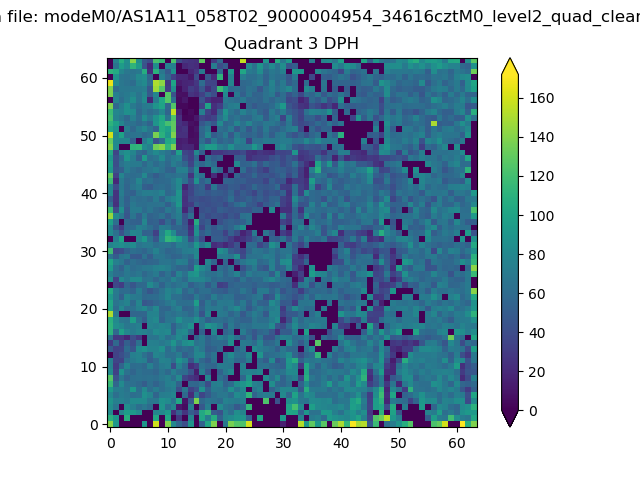 |
 |
Quadrant C |
| Plot type | Count rate plots | Images |
|---|---|---|
| Comparison with Poisson distribution Blue bars denote a histogram of data divided into 1 sec bins. Red curve is a Poisson curve with rate = median count rate of data. |
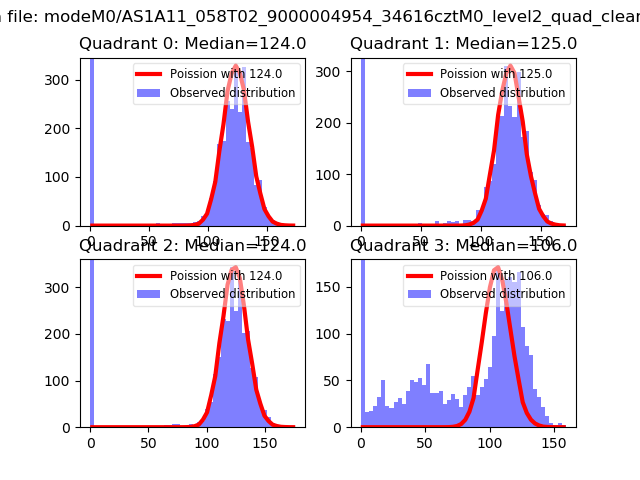 |
 |
| Quadrant-wise count rates Data is divided into 100 sec bins |
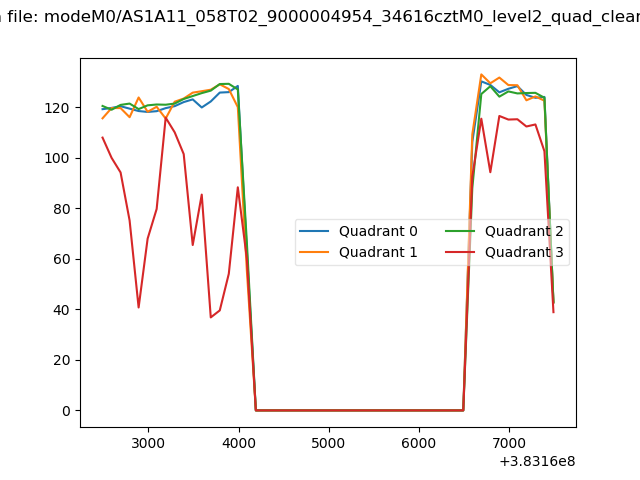 |
|
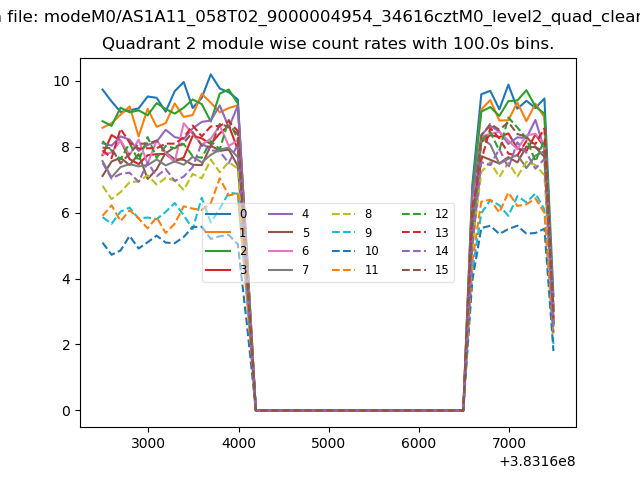
| Module-wise count rates for Quadrant A Data is divided into 100 sec bins |
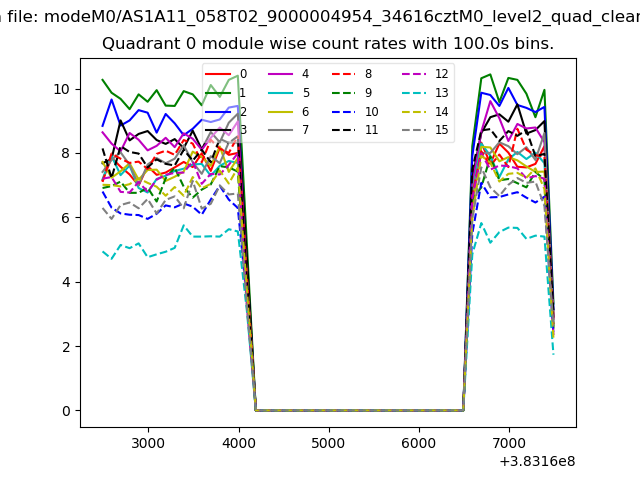 |
 |
| Module-wise count rates for Quadrant B Data is divided into 100 sec bins |
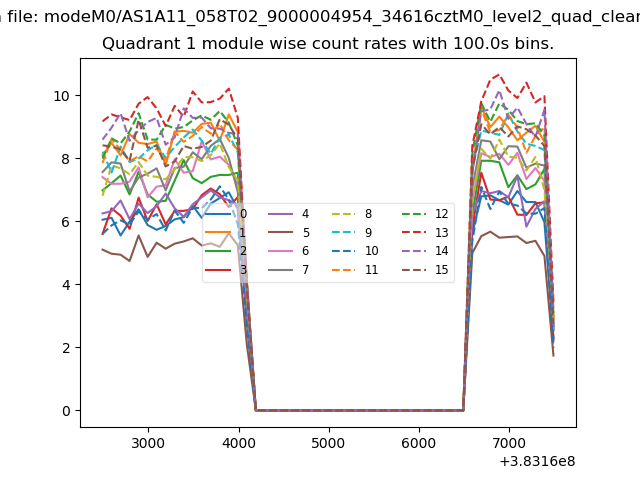 |
 |
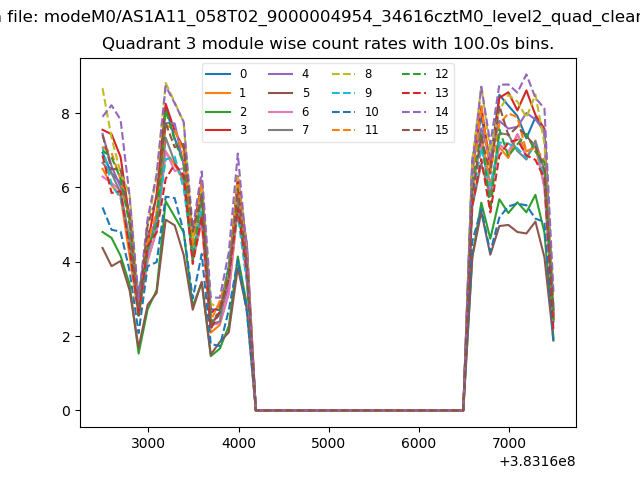
| Module-wise count rates for Quadrant C Data is divided into 100 sec bins |
 |
 |
| Module-wise count rates for Quadrant D Data is divided into 100 sec bins |
 |
 |
| Parameter | Plot |
|---|---|
| CZT HV Monitor | 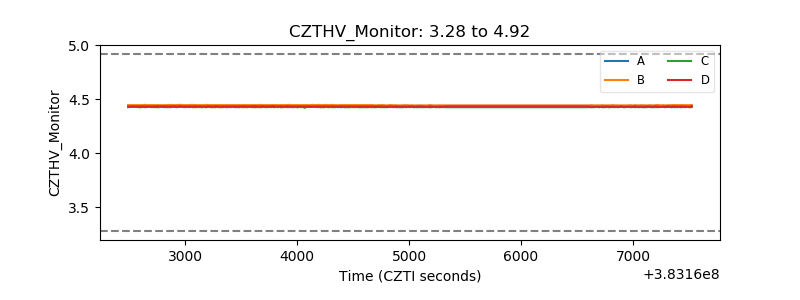 |
| D_VDD | 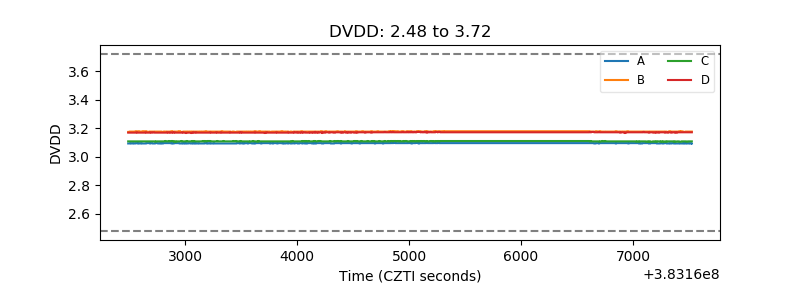 |
| Temperature 1 | 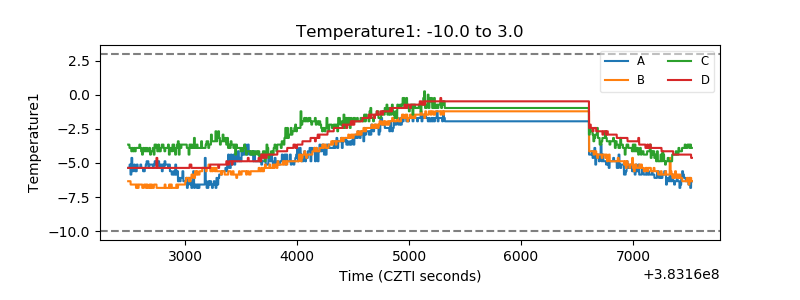 |
| Veto HV Monitor | 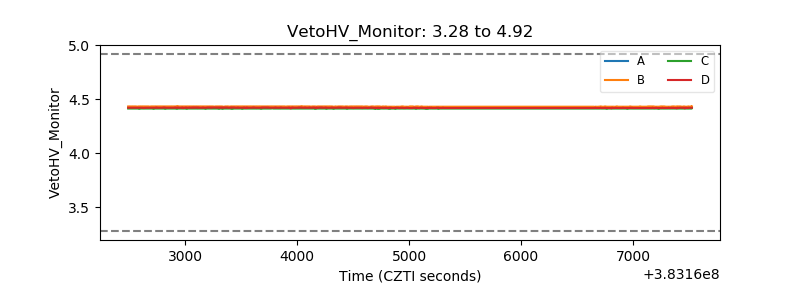 |
| Veto LLD | 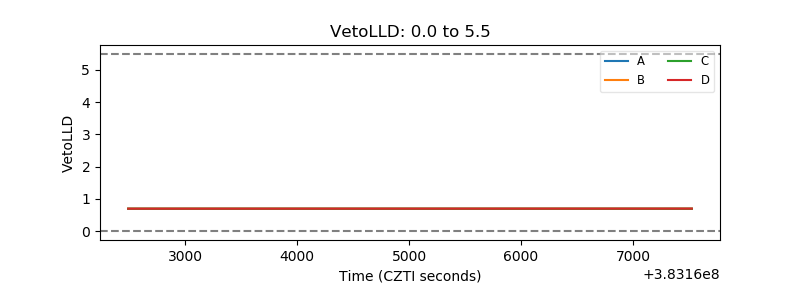 |
| Alpha Counter | 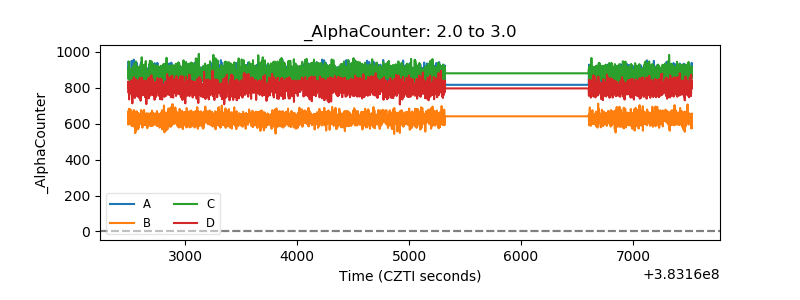 |
| _CPM_Rate | 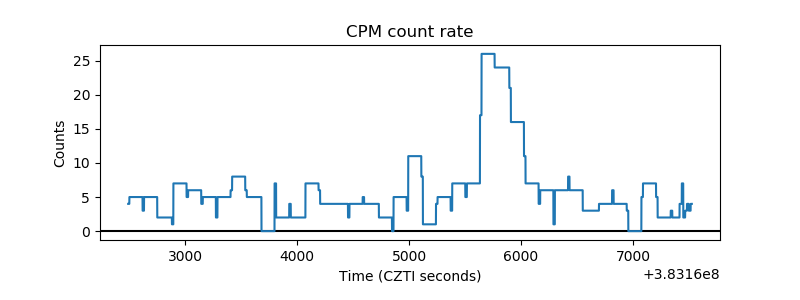 |
| CZT Counter | 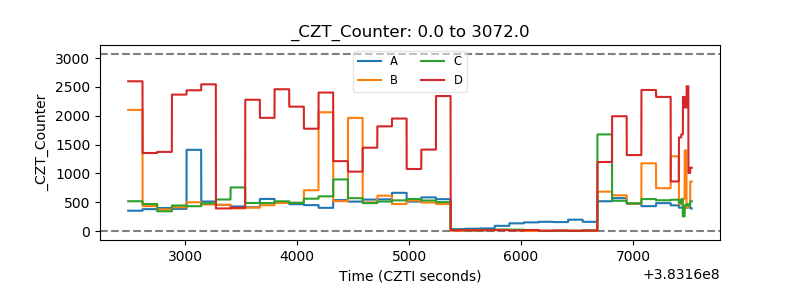 |
| +2.5 Volts monitor | 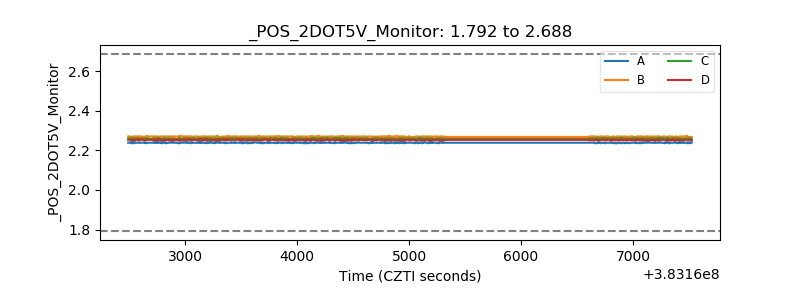 |
| +5 Volts monitor | 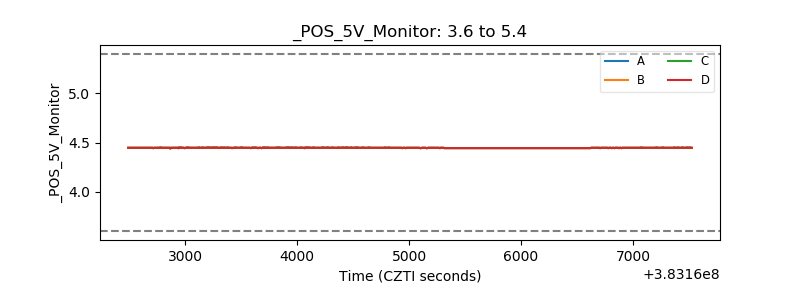 |
| _ROLL_ROT | 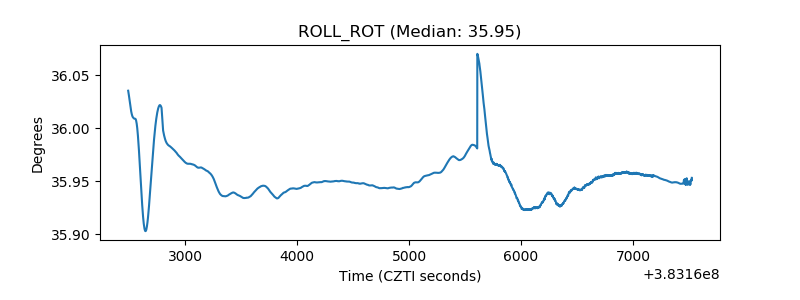 |
| _Roll_DEC | 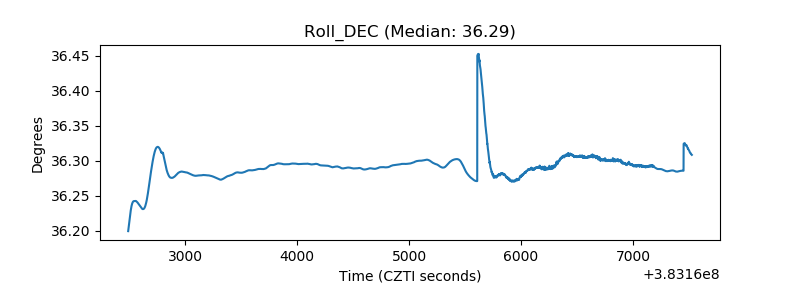 |
| _Roll_RA | 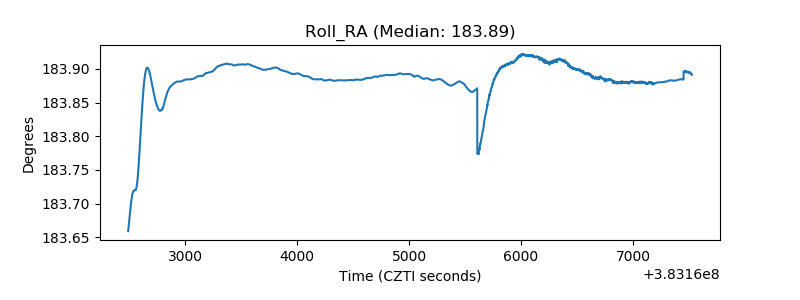 |
| Veto Counter | 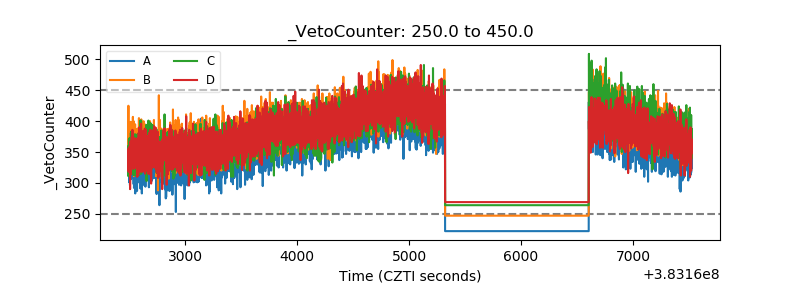 |