| Param | Original file | Final file |
|---|---|---|
| Filename | modeM0/AS1A11_046T09_9000004952_34614cztM0_level2.evt | modeM0/AS1A11_046T09_9000004952_34614cztM0_level2_quad_clean.evt |
| Size (bytes) | 455,163,840 | 76,942,080 |
| Size | 434.1 MB | 73.4 MB |
| Events in quadrant A | 2,624,162 | 498,887 |
| Events in quadrant B | 3,221,059 | 490,189 |
| Events in quadrant C | 2,914,554 | 494,819 |
| Events in quadrant D | 4,653,436 | 462,839 |
| Mode SS | |||
|---|---|---|---|
| Quadrant | BADHDUFLAG | Total packets | Discarded packets |
| A | 0 | 112 | 0 |
| B | 0 | 112 | 0 |
| C | 0 | 112 | 0 |
| D | 0 | 112 | 0 |
| Mode M9 | |||
|---|---|---|---|
| Quadrant | BADHDUFLAG | Total packets | Discarded packets |
| A | 0 | 33 | 0 |
| B | 0 | 33 | 0 |
| C | 0 | 33 | 0 |
| D | 0 | 34 | 0 |
| Mode M0 | |||
|---|---|---|---|
| Quadrant | BADHDUFLAG | Total packets | Discarded packets |
| A | 0 | 11352 | 3 |
| B | 0 | 12981 | 2 |
| C | 0 | 11741 | 2 |
| D | 0 | 17402 | 2 |
| Quadrant | Total seconds | Saturated seconds | Saturation percentage |
|---|---|---|---|
| A | 5471 | 13 | 0.237617% |
| B | 5471 | 219 | 4.002925% |
| C | 5471 | 58 | 1.060135% |
| D | 5471 | 252 | 4.606105% |
Noise dominated data is calculated using 1-second bins in cleaned event files. If a bin has >2000 counts, and if more than 50% of those come from <1% of pixels, then it is considered to be noise-dominated and hence unusable.
| Quadrant | # 1 sec bins | Bins with >0 counts | Bins with >2000 counts | High rate bins dominated by noise | Noise dominated (total time) | Noise dominated (detector-on time) | Marked lightcurve |
|---|---|---|---|---|---|---|---|
| A | 7053 | 5472 | 7 | 7 | 0.10% | 0.13% |  |
| B | 7053 | 5472 | 151 | 151 | 2.14% | 2.76% | 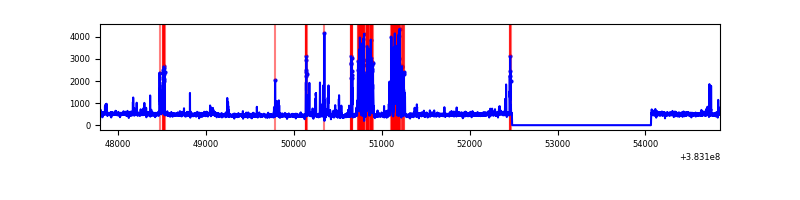 |
| C | 7053 | 5472 | 33 | 33 | 0.47% | 0.60% | 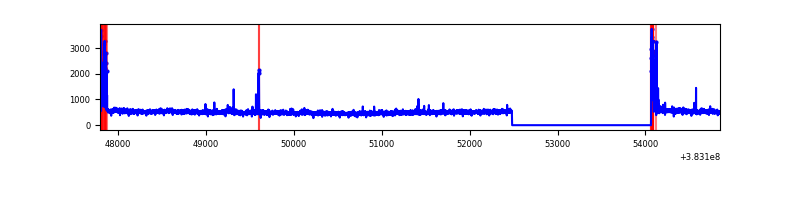 |
| D | 7053 | 5472 | 221 | 221 | 3.13% | 4.04% | 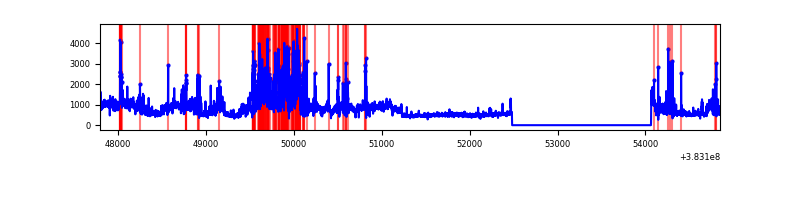 |
Top three noisy pixels from each quadrant. If the there are fewer than three noisy pixels in the level2.evt file, extra rows are filled as -1
| Pixel properties | Quadrant properties | ||||||
|---|---|---|---|---|---|---|---|
| Quadrant | DetID | PixID | Counts | Sigma | Mean | Median | Sigma |
| A | 15 | 169 | 62651 | 477.65 | 643 | 630 | 129.8 |
| A | 10 | 83 | 45950 | 349.03 | 643 | 630 | 129.8 |
| A | 13 | 6 | 14958 | 110.35 | 643 | 630 | 129.8 |
| B | 5 | 172 | 663556 | 5469.1 | 632 | 618 | 121.2 |
| B | 12 | 111 | 14852 | 117.43 | 632 | 618 | 121.2 |
| B | 5 | 200 | 14837 | 117.3 | 632 | 618 | 121.2 |
| C | 15 | 214 | 228550 | 1569.54 | 622 | 625 | 145.2 |
| C | 0 | 10 | 154773 | 1061.5 | 622 | 625 | 145.2 |
| C | 14 | 67 | 64155 | 437.48 | 622 | 625 | 145.2 |
| D | 8 | 195 | 1161322 | 7667.54 | 616 | 600 | 151.4 |
| D | 3 | 13 | 607800 | 4011.07 | 616 | 600 | 151.4 |
| D | 13 | 249 | 129569 | 851.95 | 616 | 600 | 151.4 |
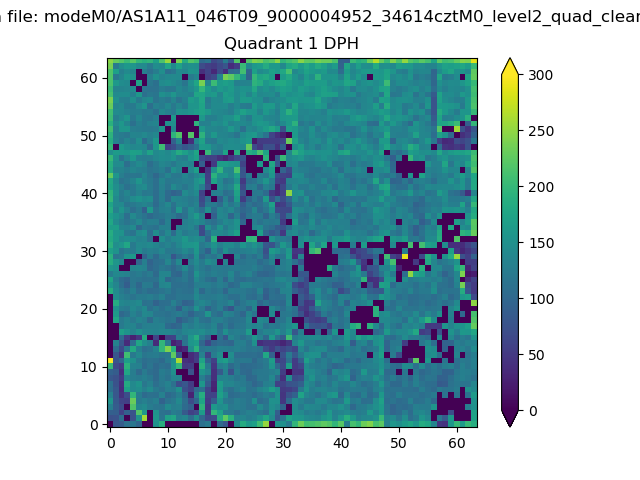
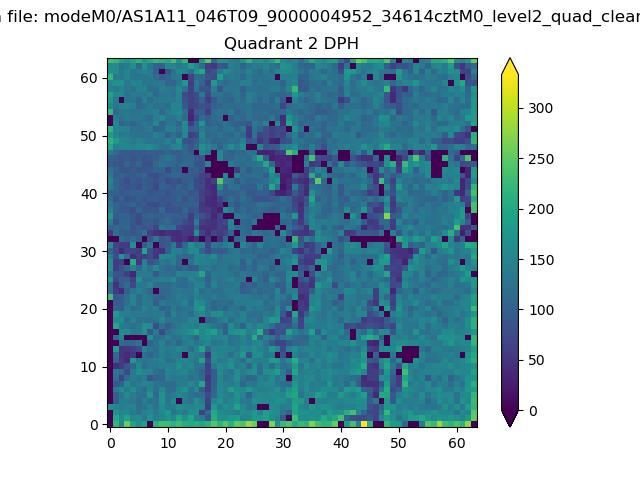
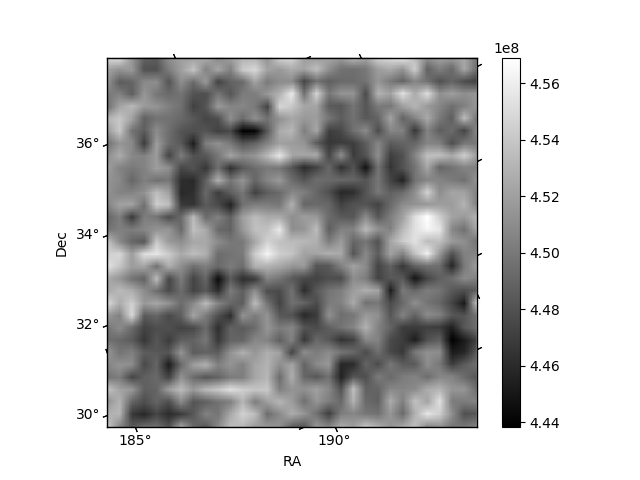
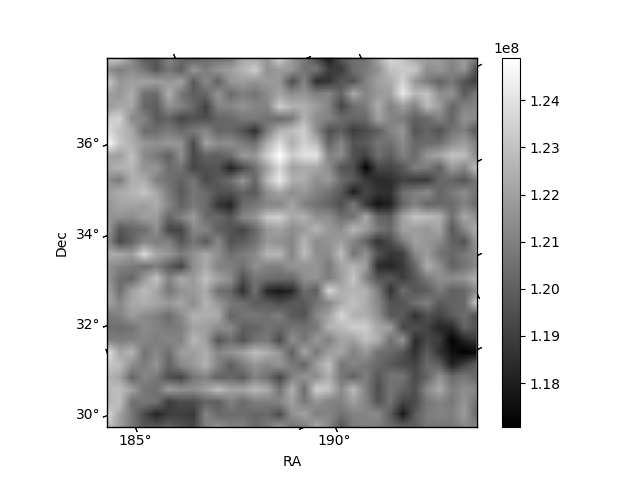
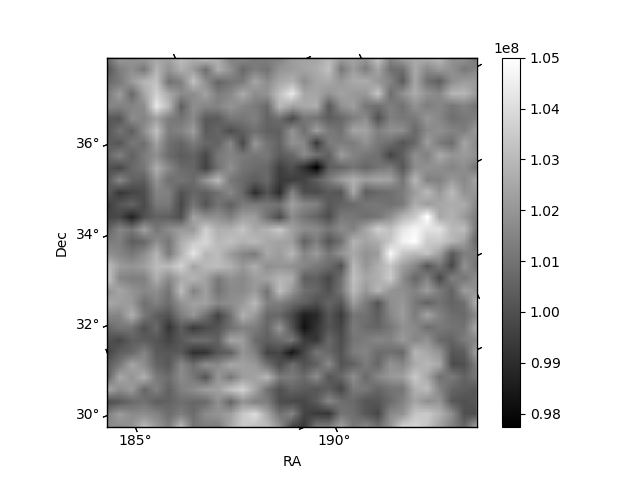
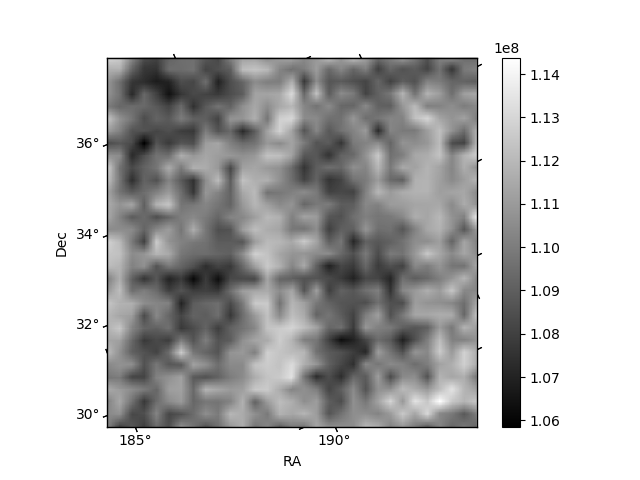
Histogram calculated using DETX and DETY for each event in the final _common_clean file
| Quadrant A | 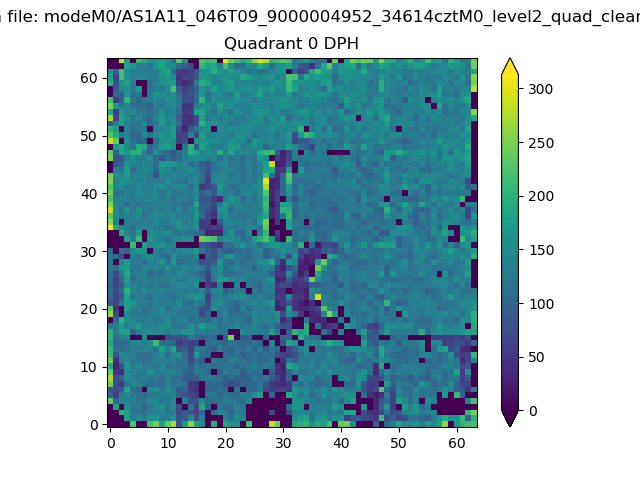 |
 |
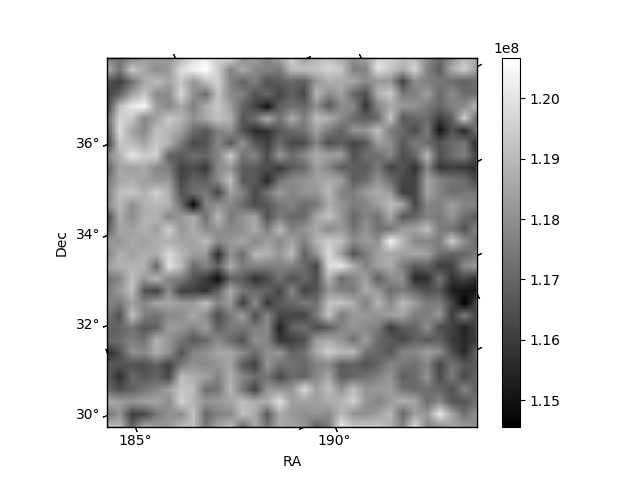
Quadrant B |
|---|---|---|---|
| Quadrant D | 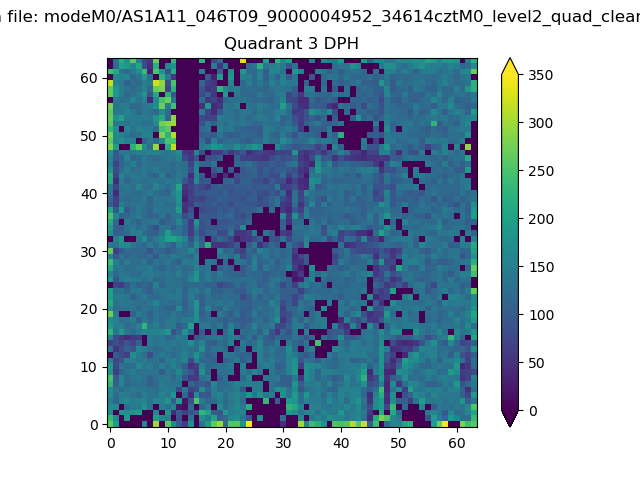 |
 |
Quadrant C |
| Plot type | Count rate plots | Images |
|---|---|---|
| Comparison with Poisson distribution Blue bars denote a histogram of data divided into 1 sec bins. Red curve is a Poisson curve with rate = median count rate of data. |
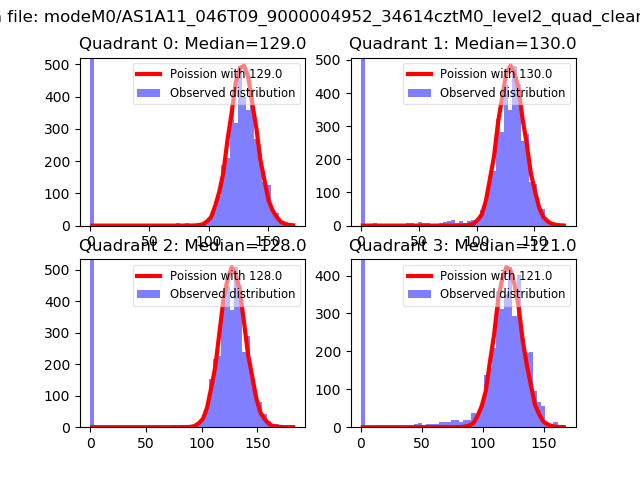 |
 |
| Quadrant-wise count rates Data is divided into 100 sec bins |
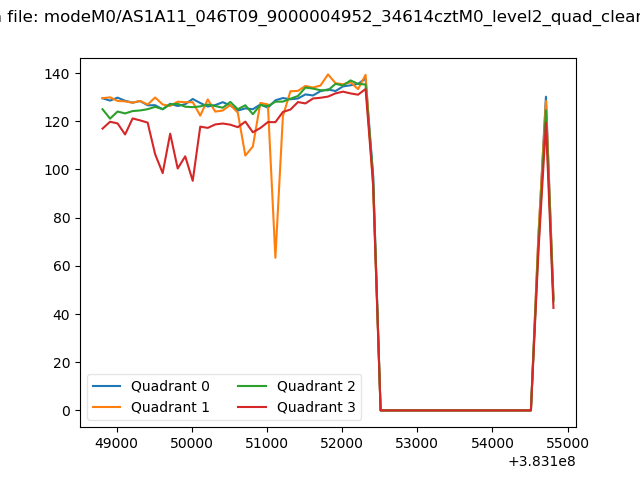 |
|
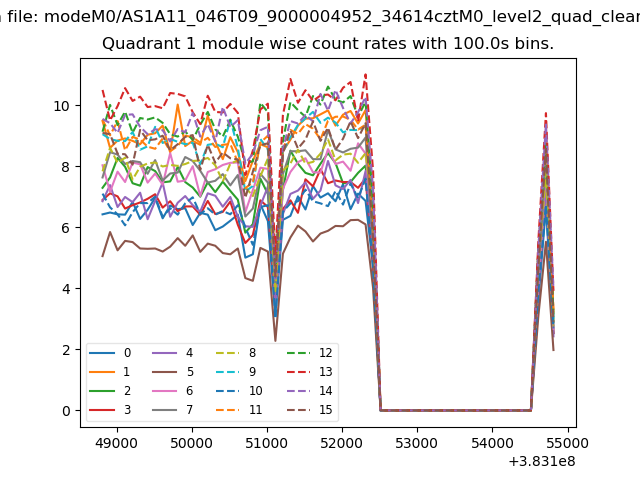
| Module-wise count rates for Quadrant A Data is divided into 100 sec bins |
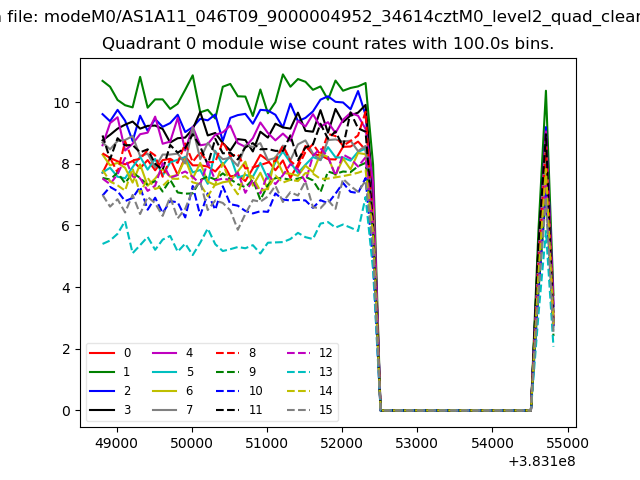 |
 |
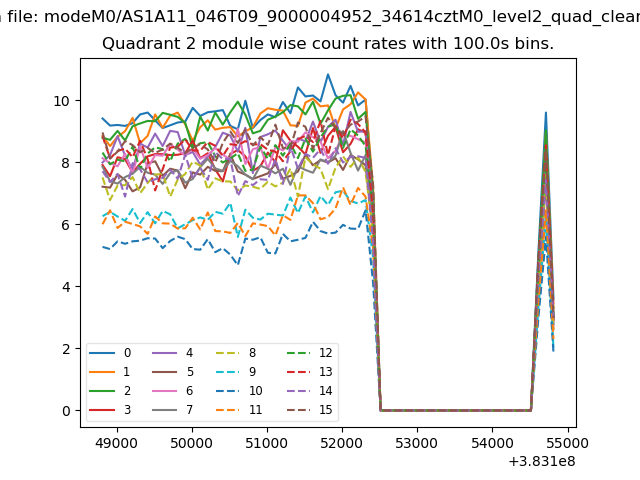
| Module-wise count rates for Quadrant B Data is divided into 100 sec bins |
 |
 |
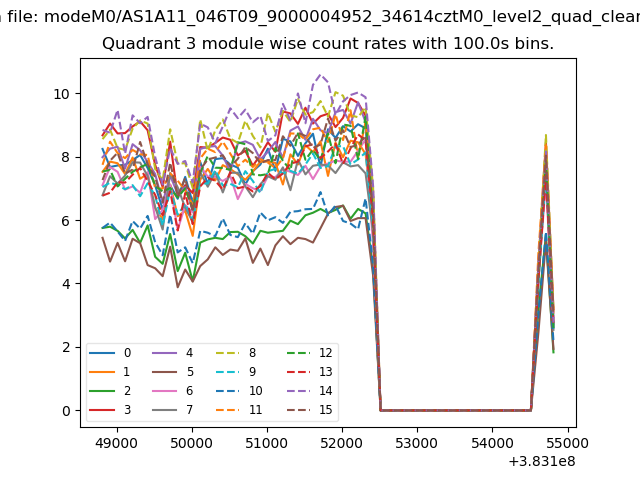
| Module-wise count rates for Quadrant C Data is divided into 100 sec bins |
 |
 |
| Module-wise count rates for Quadrant D Data is divided into 100 sec bins |
 |
 |
| Parameter | Plot |
|---|---|
| CZT HV Monitor | 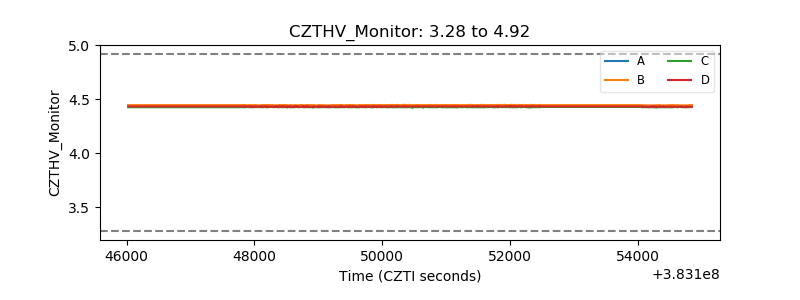 |
| D_VDD |  |
| Temperature 1 |  |
| Veto HV Monitor | 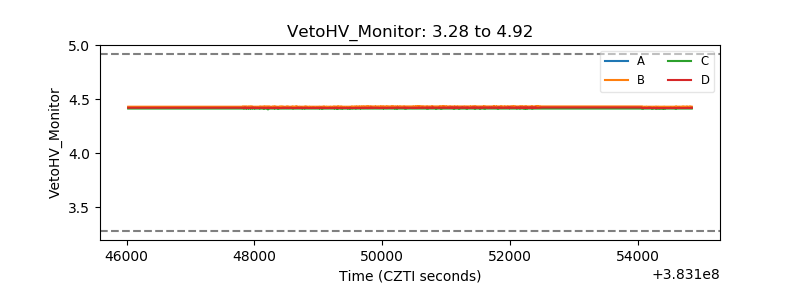 |
| Veto LLD | 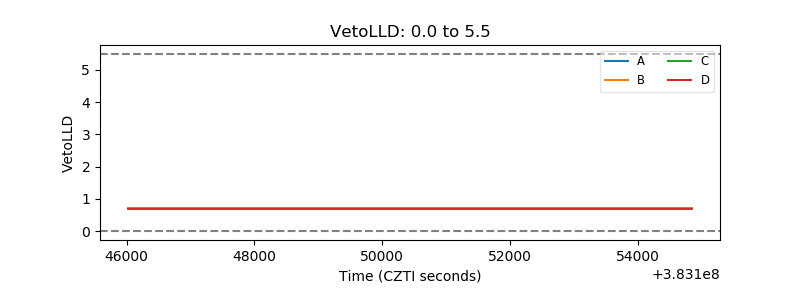 |
| Alpha Counter | 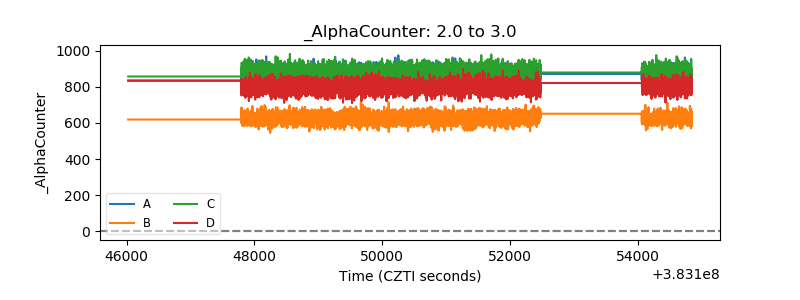 |
| _CPM_Rate |  |
| CZT Counter | 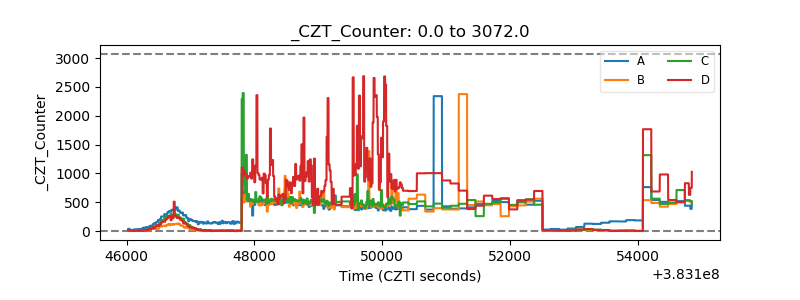 |
| +2.5 Volts monitor | 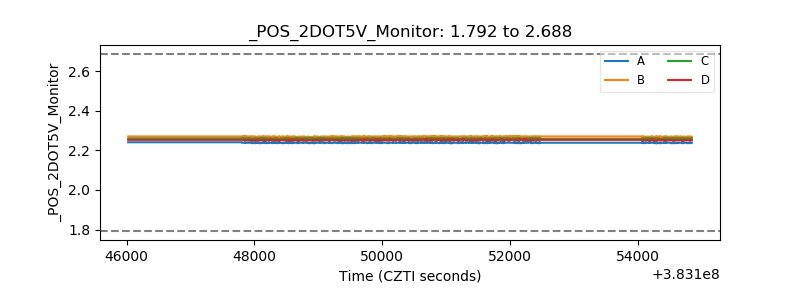 |
| +5 Volts monitor | 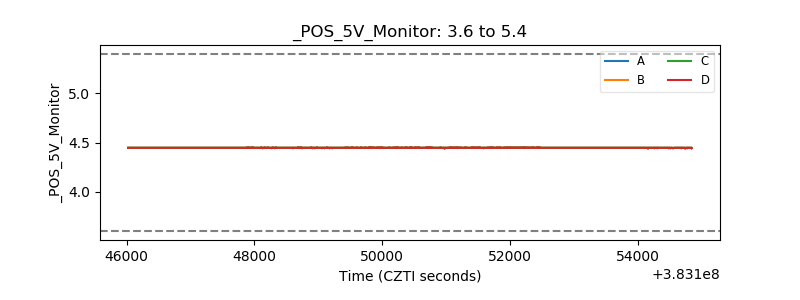 |
| _ROLL_ROT | 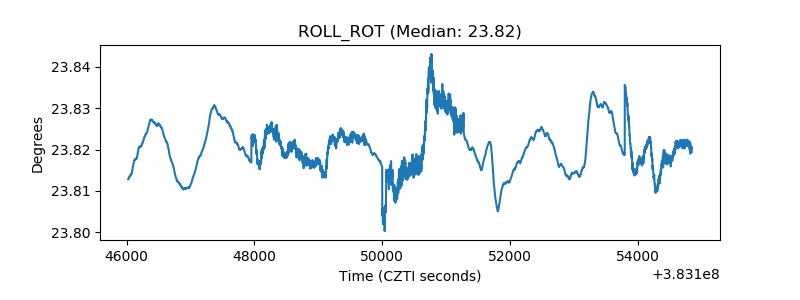 |
| _Roll_DEC | 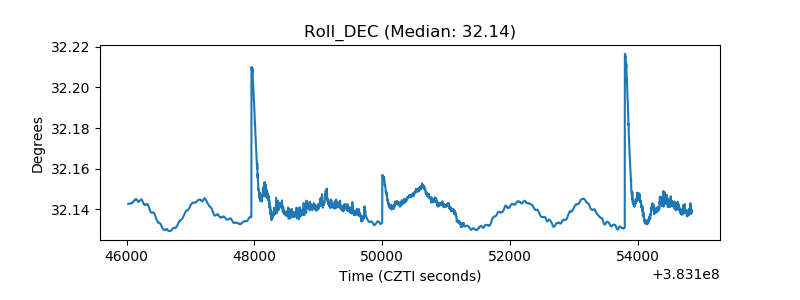 |
| _Roll_RA | 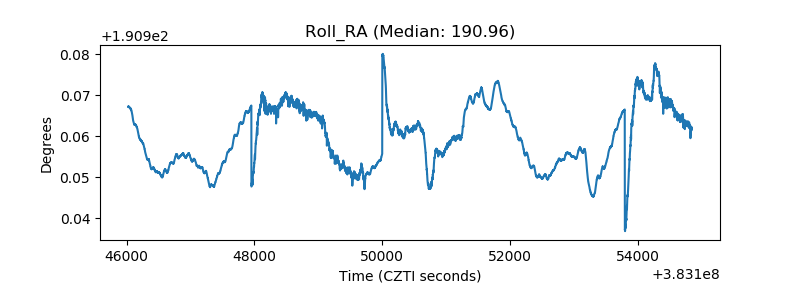 |
| Veto Counter | 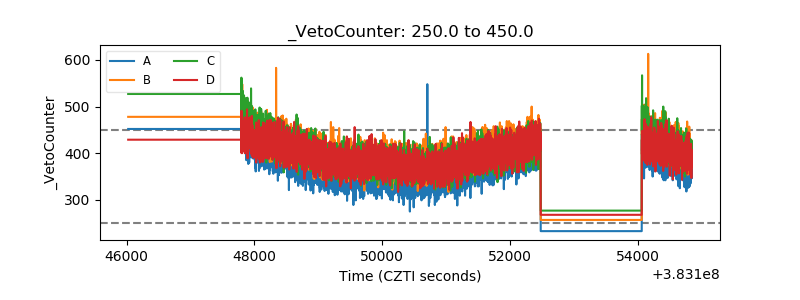 |