| Param | Original file | Final file |
|---|---|---|
| Filename | modeM0/AS1A11_046T09_9000004952_34613cztM0_level2.evt | modeM0/AS1A11_046T09_9000004952_34613cztM0_level2_quad_clean.evt |
| Size (bytes) | 524,701,440 | 59,993,280 |
| Size | 500.4 MB | 57.2 MB |
| Events in quadrant A | 2,475,196 | 386,173 |
| Events in quadrant B | 3,511,579 | 363,935 |
| Events in quadrant C | 2,885,756 | 381,772 |
| Events in quadrant D | 6,665,770 | 319,786 |
| Mode SS | |||
|---|---|---|---|
| Quadrant | BADHDUFLAG | Total packets | Discarded packets |
| A | 0 | 106 | 0 |
| B | 0 | 106 | 0 |
| C | 0 | 106 | 0 |
| D | 0 | 106 | 0 |
| Mode M9 | |||
|---|---|---|---|
| Quadrant | BADHDUFLAG | Total packets | Discarded packets |
| A | 0 | 27 | 0 |
| B | 0 | 27 | 0 |
| C | 0 | 27 | 0 |
| D | 0 | 28 | 0 |
| Mode M0 | |||
|---|---|---|---|
| Quadrant | BADHDUFLAG | Total packets | Discarded packets |
| A | 0 | 10636 | 3 |
| B | 0 | 13592 | 2 |
| C | 0 | 11374 | 2 |
| D | 0 | 23344 | 2 |
| Quadrant | Total seconds | Saturated seconds | Saturation percentage |
|---|---|---|---|
| A | 5198 | 7 | 0.134667% |
| B | 5198 | 352 | 6.771835% |
| C | 5198 | 76 | 1.462101% |
| D | 5198 | 1213 | 23.335898% |
Noise dominated data is calculated using 1-second bins in cleaned event files. If a bin has >2000 counts, and if more than 50% of those come from <1% of pixels, then it is considered to be noise-dominated and hence unusable.
| Quadrant | # 1 sec bins | Bins with >0 counts | Bins with >2000 counts | High rate bins dominated by noise | Noise dominated (total time) | Noise dominated (detector-on time) | Marked lightcurve |
|---|---|---|---|---|---|---|---|
| A | 7141 | 5199 | 1 | 1 | 0.01% | 0.02% | 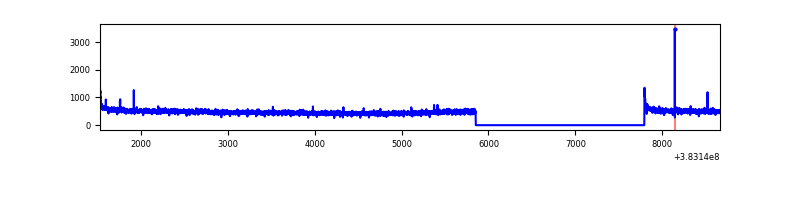 |
| B | 7141 | 5199 | 246 | 246 | 3.44% | 4.73% | 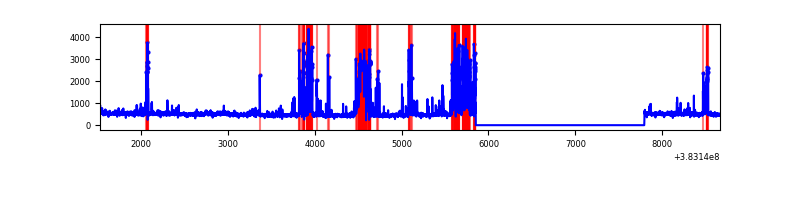 |
| C | 7141 | 5199 | 43 | 43 | 0.60% | 0.83% | 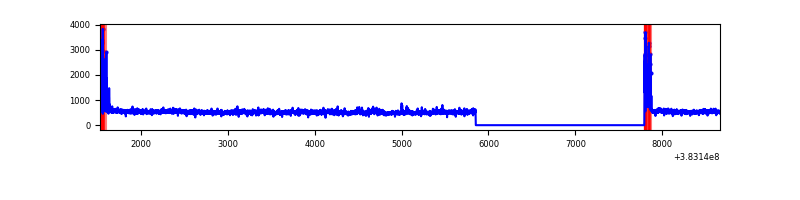 |
| D | 7141 | 5199 | 1091 | 1091 | 15.28% | 20.98% | 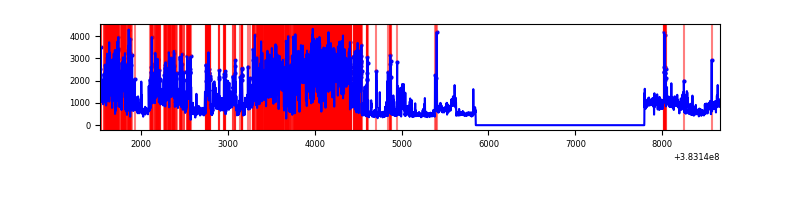 |
Top three noisy pixels from each quadrant. If the there are fewer than three noisy pixels in the level2.evt file, extra rows are filled as -1
| Pixel properties | Quadrant properties | ||||||
|---|---|---|---|---|---|---|---|
| Quadrant | DetID | PixID | Counts | Sigma | Mean | Median | Sigma |
| A | 10 | 83 | 45176 | 357.86 | 625 | 613 | 124.5 |
| A | 13 | 254 | 9370 | 70.32 | 625 | 613 | 124.5 |
| A | 3 | 137 | 6081 | 43.91 | 625 | 613 | 124.5 |
| B | 5 | 172 | 699124 | 6107.96 | 604 | 590 | 114.4 |
| B | 5 | 200 | 303354 | 2647.36 | 604 | 590 | 114.4 |
| B | 10 | 245 | 38474 | 331.26 | 604 | 590 | 114.4 |
| C | 15 | 214 | 216203 | 1536.72 | 603 | 608 | 140.3 |
| C | 0 | 10 | 198041 | 1407.26 | 603 | 608 | 140.3 |
| C | 14 | 67 | 106972 | 758.14 | 603 | 608 | 140.3 |
| D | 7 | 223 | 1890738 | 13624.69 | 563 | 547 | 138.7 |
| D | 2 | 249 | 1253445 | 9031.02 | 563 | 547 | 138.7 |
| D | 8 | 195 | 943271 | 6795.25 | 563 | 547 | 138.7 |
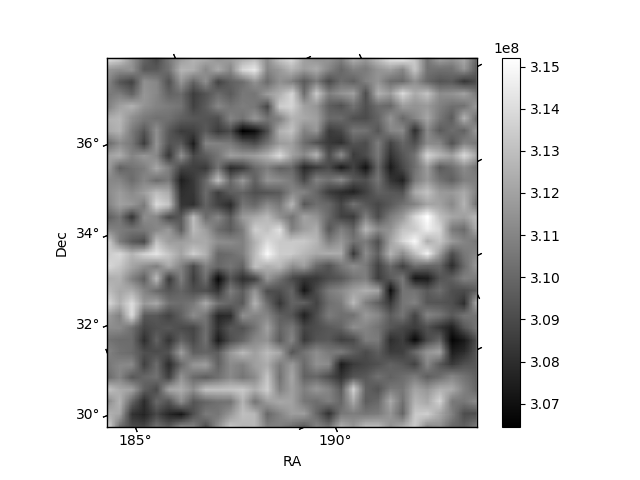
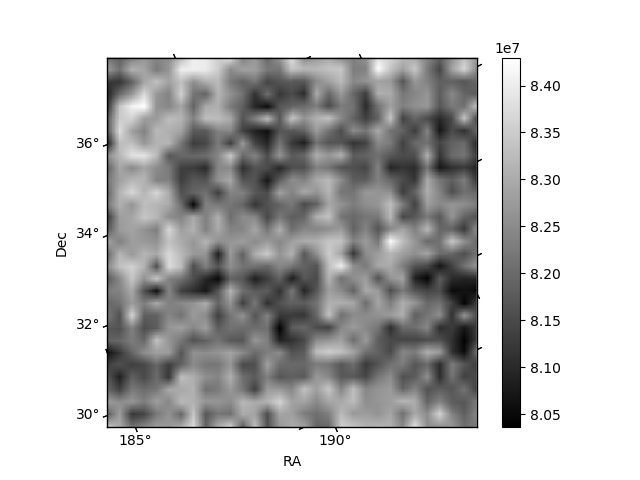
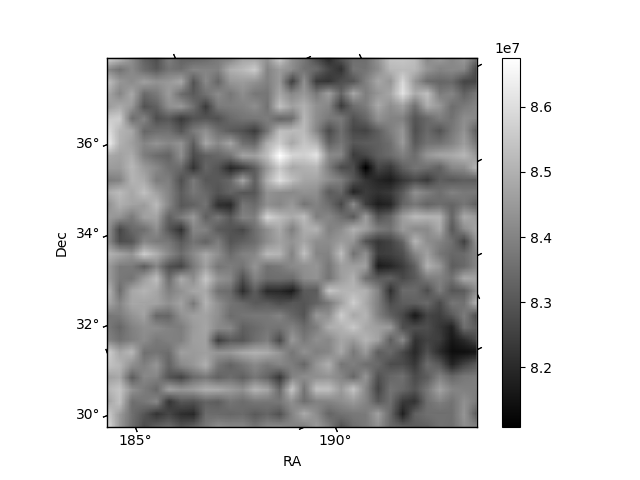
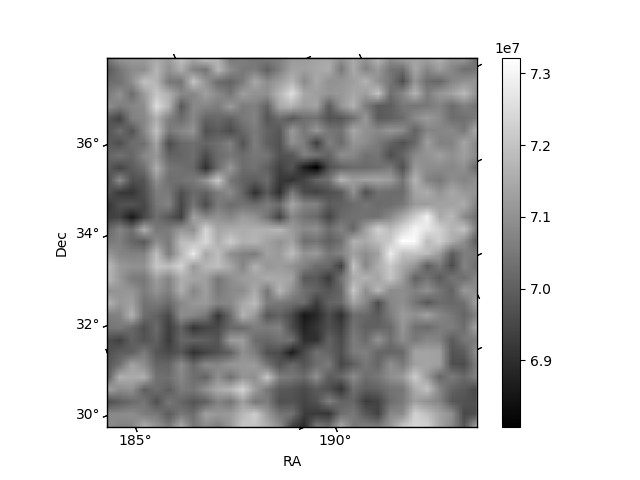
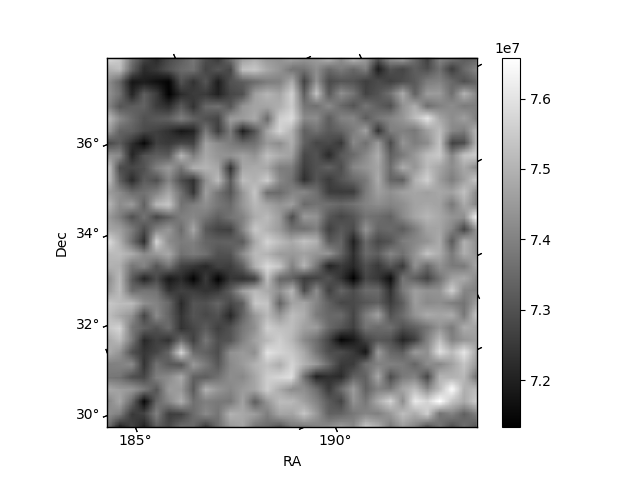
Histogram calculated using DETX and DETY for each event in the final _common_clean file
| Quadrant A | 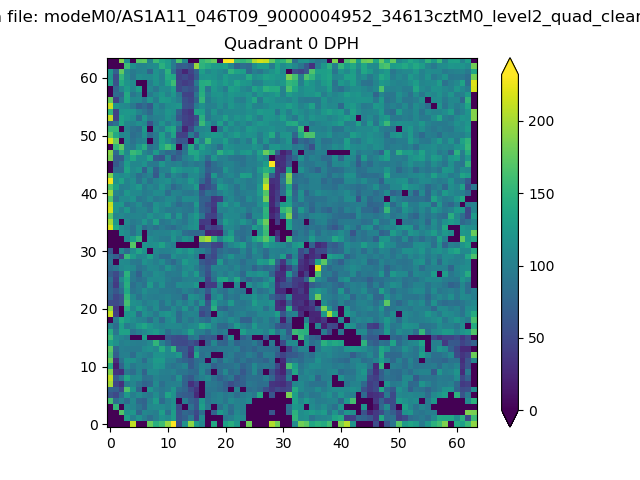 |
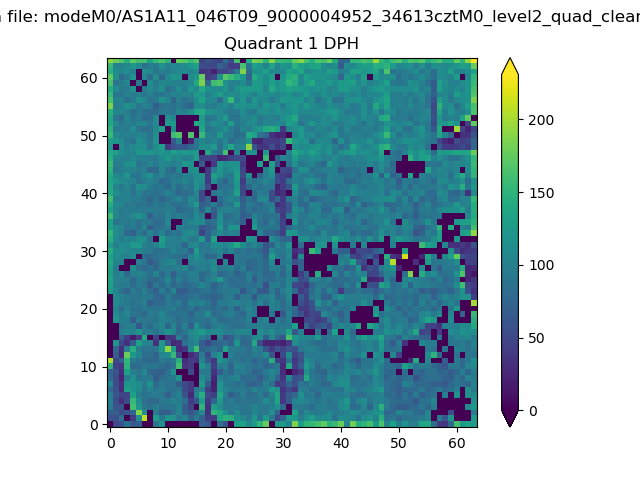 |
Quadrant B |
|---|---|---|---|
| Quadrant D | 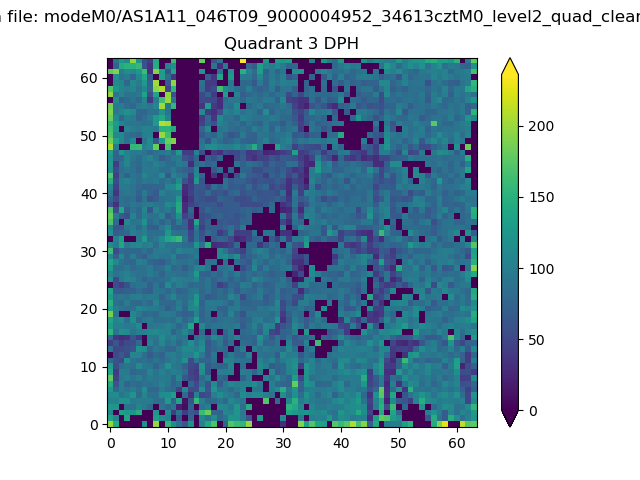 |
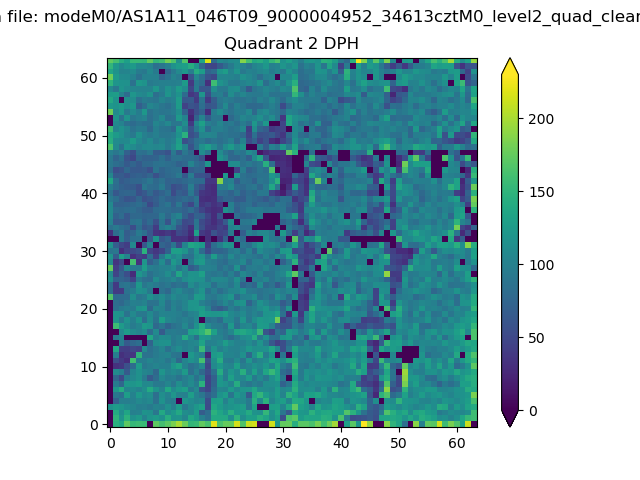 |
Quadrant C |
| Plot type | Count rate plots | Images |
|---|---|---|
| Comparison with Poisson distribution Blue bars denote a histogram of data divided into 1 sec bins. Red curve is a Poisson curve with rate = median count rate of data. |
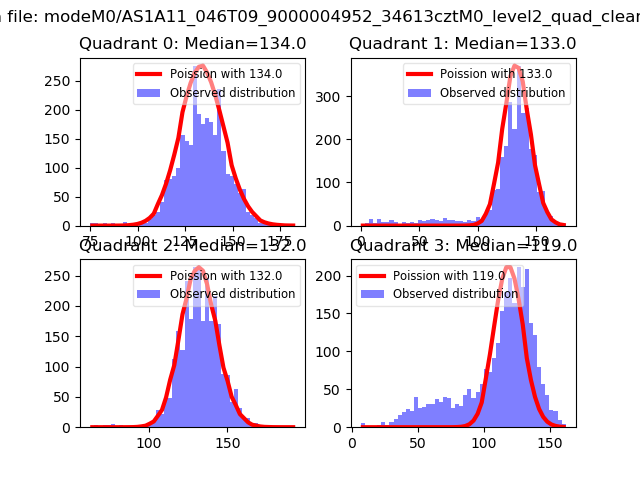 |
 |
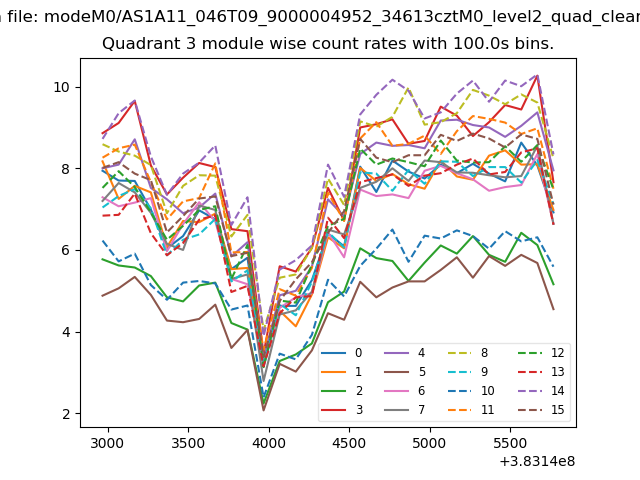
| Quadrant-wise count rates Data is divided into 100 sec bins |
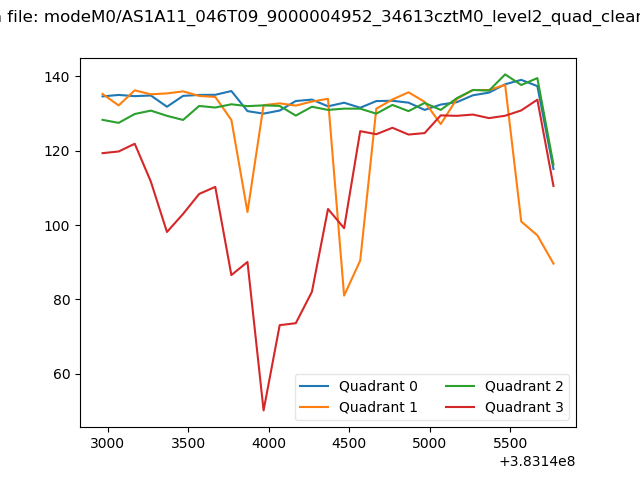 |
|
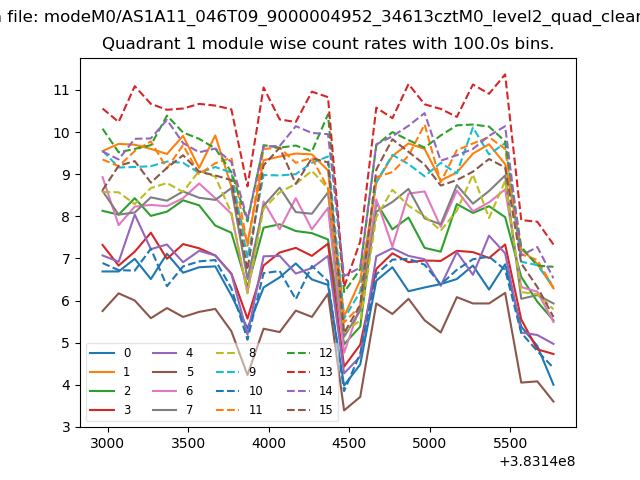
| Module-wise count rates for Quadrant A Data is divided into 100 sec bins |
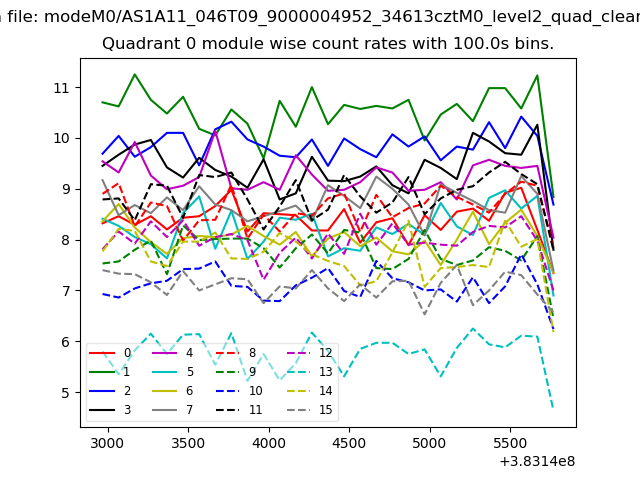 |
 |
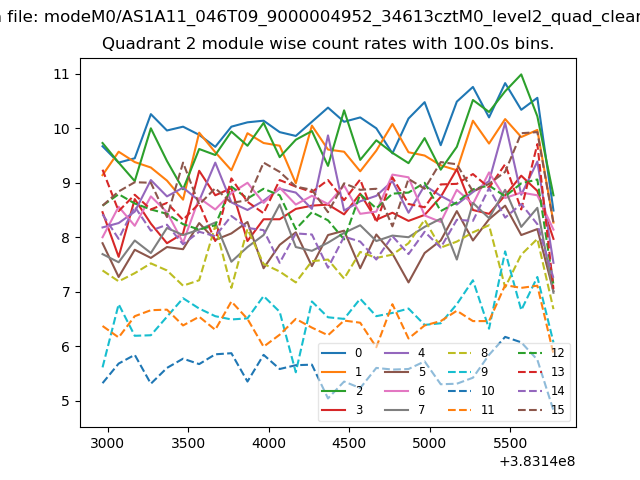
| Module-wise count rates for Quadrant B Data is divided into 100 sec bins |
 |
 |
| Module-wise count rates for Quadrant C Data is divided into 100 sec bins |
 |
 |
| Module-wise count rates for Quadrant D Data is divided into 100 sec bins |
 |
 |
| Parameter | Plot |
|---|---|
| CZT HV Monitor | 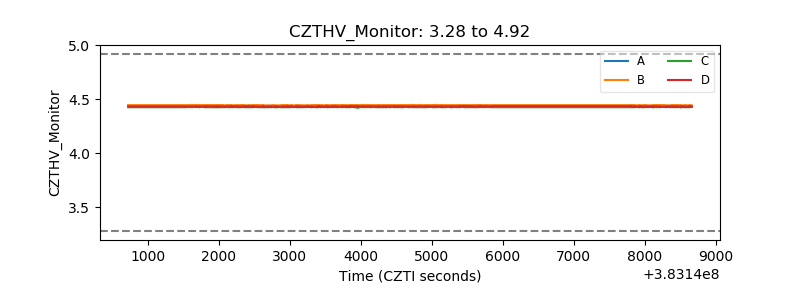 |
| D_VDD | 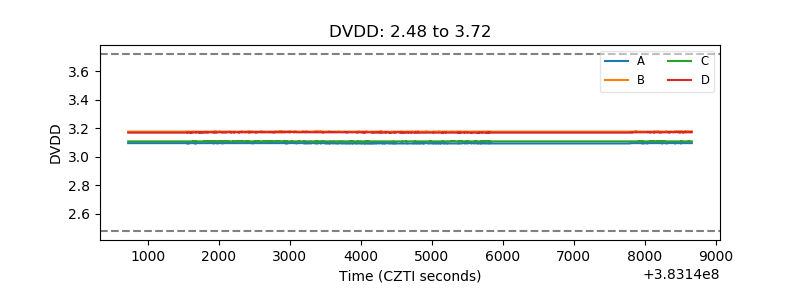 |
| Temperature 1 | 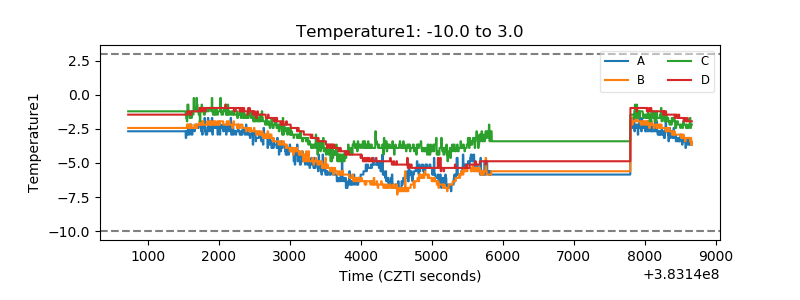 |
| Veto HV Monitor | 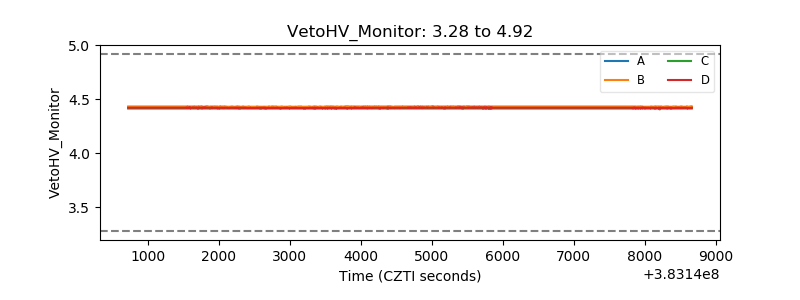 |
| Veto LLD | 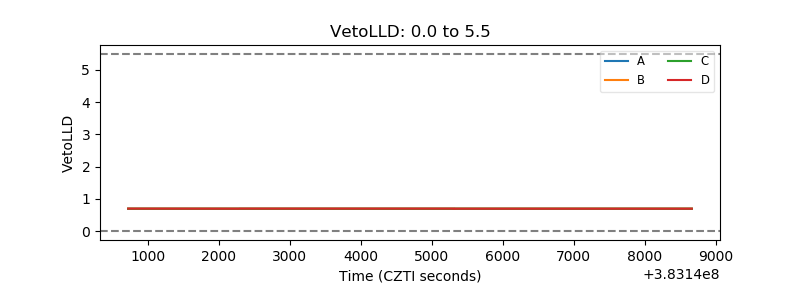 |
| Alpha Counter | 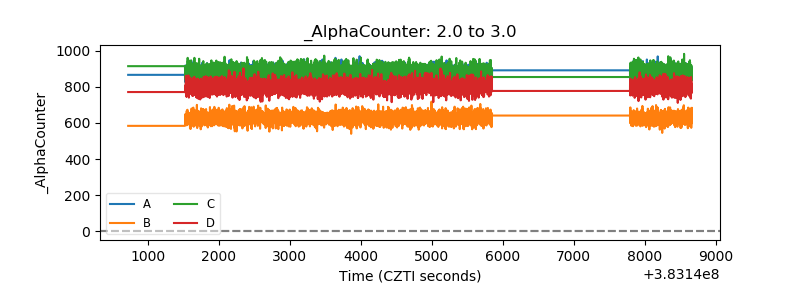 |
| _CPM_Rate | 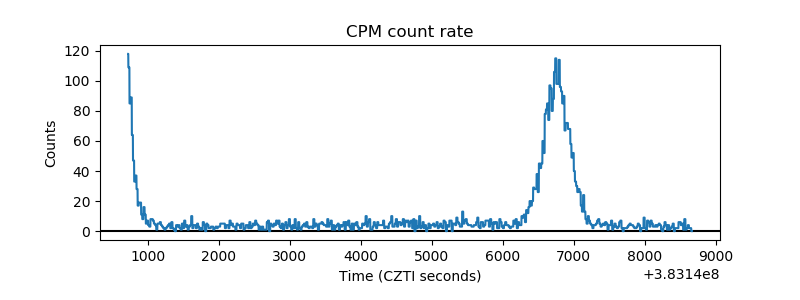 |
| CZT Counter | 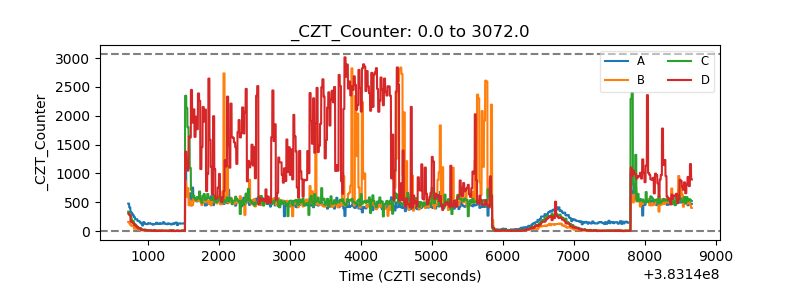 |
| +2.5 Volts monitor | 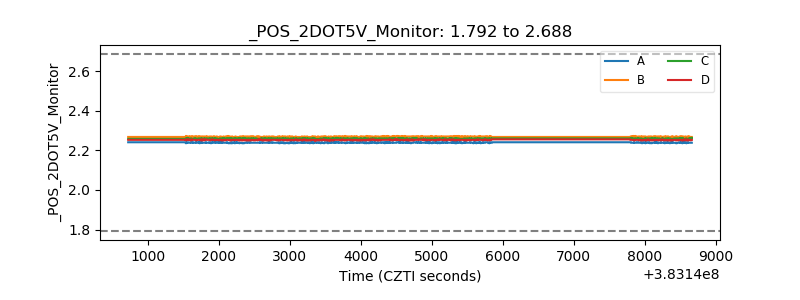 |
| +5 Volts monitor | 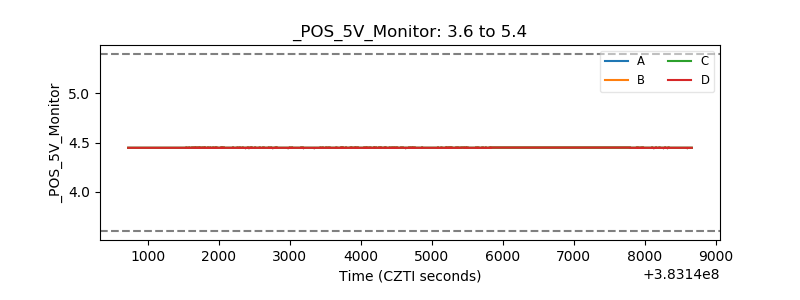 |
| _ROLL_ROT | 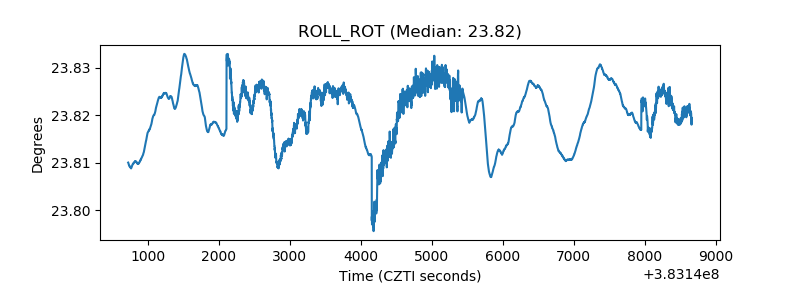 |
| _Roll_DEC | 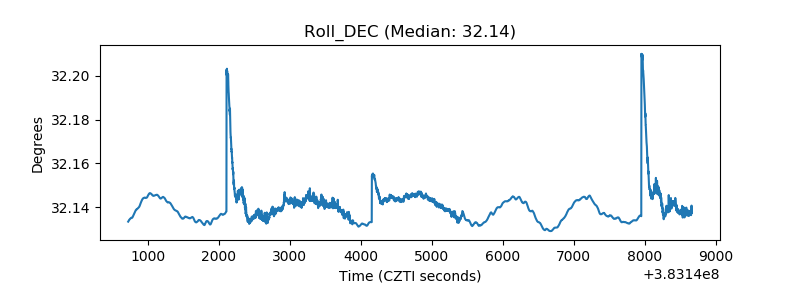 |
| _Roll_RA | 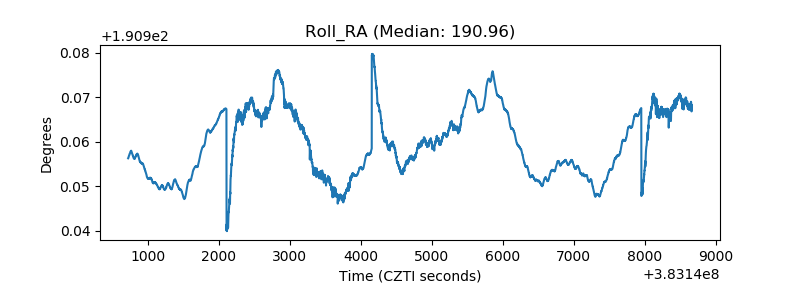 |
| Veto Counter | 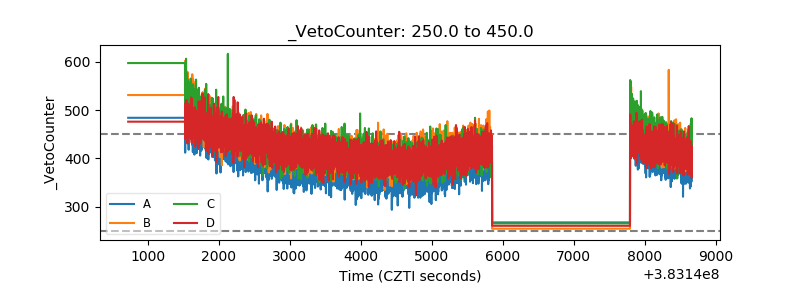 |