| Param | Original file | Final file |
|---|---|---|
| Filename | modeM0/AS1A11_046T09_9000004952cztM0_level2_bc.evt | modeM0/AS1A11_046T09_9000004952cztM0_level2_quad_clean.evt |
| Size (bytes) | 1,265,633,280 | 339,433,920 |
| Size | 1.2 GB | 323.7 MB |
| Events in quadrant A | 5,573,969 | 2,214,641 |
| Events in quadrant B | 8,022,795 | 2,172,120 |
| Events in quadrant C | 6,890,022 | 2,188,602 |
| Events in quadrant D | 16,176,176 | 2,022,620 |
| Mode SS | |||
|---|---|---|---|
| Quadrant | BADHDUFLAG | Total packets | Discarded packets |
| A | 0 | 500 | 0 |
| B | 0 | 500 | 0 |
| C | 0 | 500 | 0 |
| D | 0 | 500 | 0 |
| Mode M9 | |||
|---|---|---|---|
| Quadrant | BADHDUFLAG | Total packets | Discarded packets |
| A | 0 | 112 | 0 |
| B | 0 | 112 | 0 |
| C | 0 | 112 | 0 |
| D | 0 | 112 | 0 |
| Mode M0 | |||
|---|---|---|---|
| Quadrant | BADHDUFLAG | Total packets | Discarded packets |
| A | 0 | 50815 | 0 |
| B | 0 | 61156 | 0 |
| C | 0 | 52854 | 0 |
| D | 0 | 85803 | 0 |
| Quadrant | Total seconds | Saturated seconds | Saturation percentage |
|---|---|---|---|
| A | 24462 | 105 | 0.429237% |
| B | 24462 | 1129 | 4.615322% |
| C | 24462 | 209 | 0.854386% |
| D | 24462 | 1842 | 7.530047% |
Noise dominated data is calculated using 1-second bins in cleaned event files. If a bin has >2000 counts, and if more than 50% of those come from <1% of pixels, then it is considered to be noise-dominated and hence unusable.
| Quadrant | # 1 sec bins | Bins with >0 counts | Bins with >2000 counts | High rate bins dominated by noise | Noise dominated (total time) | Noise dominated (detector-on time) | Marked lightcurve |
|---|---|---|---|---|---|---|---|
| A | 35609 | 24466 | 12 | 12 | 0.03% | 0.05% | 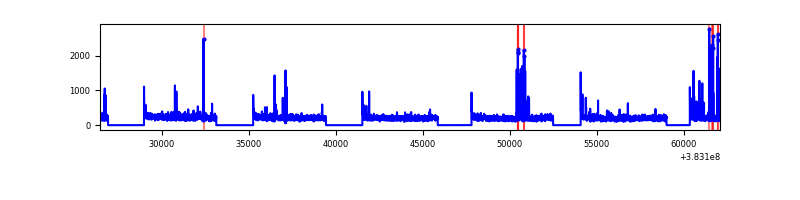 |
| B | 35609 | 24461 | 157 | 157 | 0.44% | 0.64% | 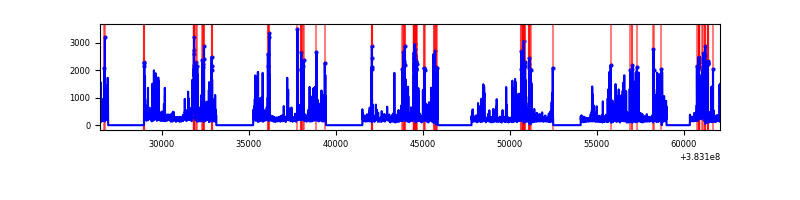 |
| C | 35609 | 24464 | 18 | 18 | 0.05% | 0.07% | 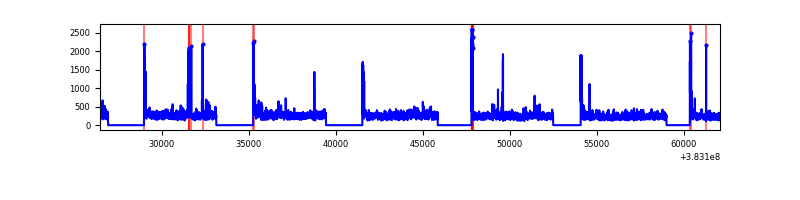 |
| D | 35609 | 24462 | 651 | 651 | 1.83% | 2.66% | 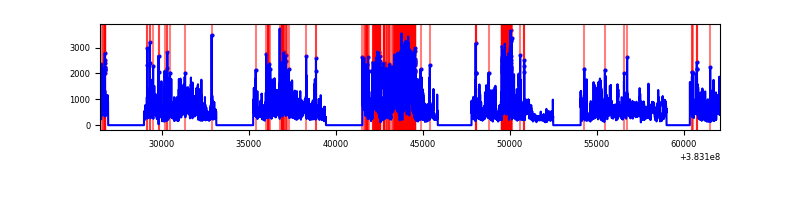 |
Top three noisy pixels from each quadrant. If the there are fewer than three noisy pixels in the level2.evt file, extra rows are filled as -1
| Pixel properties | Quadrant properties | ||||||
|---|---|---|---|---|---|---|---|
| Quadrant | DetID | PixID | Counts | Sigma | Mean | Median | Sigma |
| A | 15 | 169 | 178023 | 602.88 | 1334 | 1316 | 293.1 |
| A | 10 | 83 | 144372 | 488.07 | 1334 | 1316 | 293.1 |
| A | 13 | 254 | 43486 | 143.87 | 1334 | 1316 | 293.1 |
| B | 5 | 172 | 2209404 | 8605.65 | 1314 | 1289 | 256.6 |
| B | 5 | 200 | 271366 | 1052.57 | 1314 | 1289 | 256.6 |
| B | 4 | 232 | 118441 | 456.57 | 1314 | 1289 | 256.6 |
| C | 15 | 214 | 963043 | 3255.29 | 1287 | 1279 | 295.4 |
| C | 0 | 10 | 336422 | 1134.36 | 1287 | 1279 | 295.4 |
| C | 14 | 67 | 312126 | 1052.13 | 1287 | 1279 | 295.4 |
| D | 8 | 195 | 5955455 | 19546.98 | 1267 | 1234 | 304.6 |
| D | 7 | 223 | 1962539 | 6438.72 | 1267 | 1234 | 304.6 |
| D | 2 | 249 | 1100407 | 3608.45 | 1267 | 1234 | 304.6 |
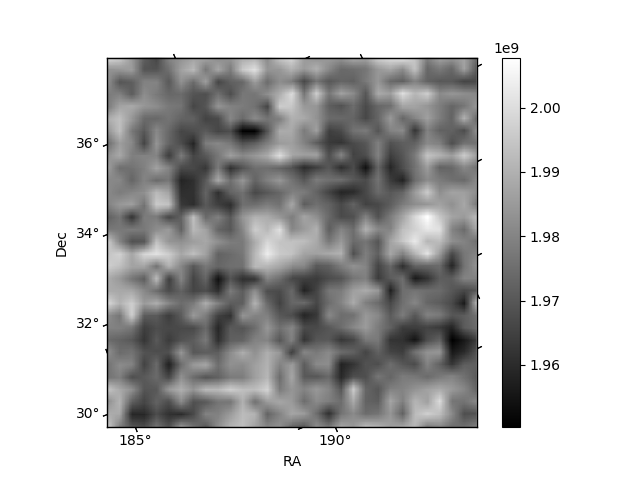
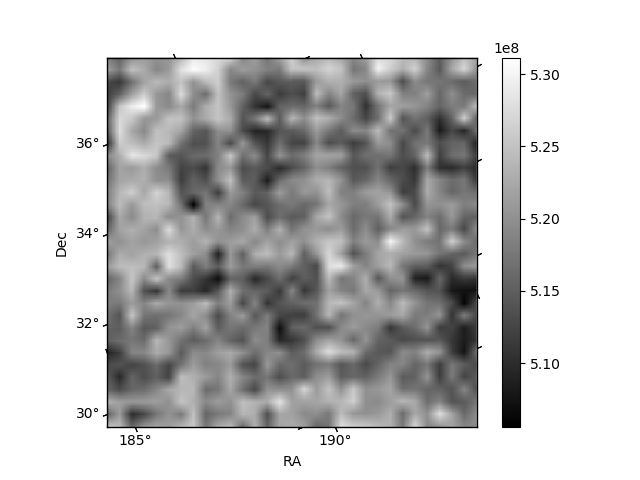
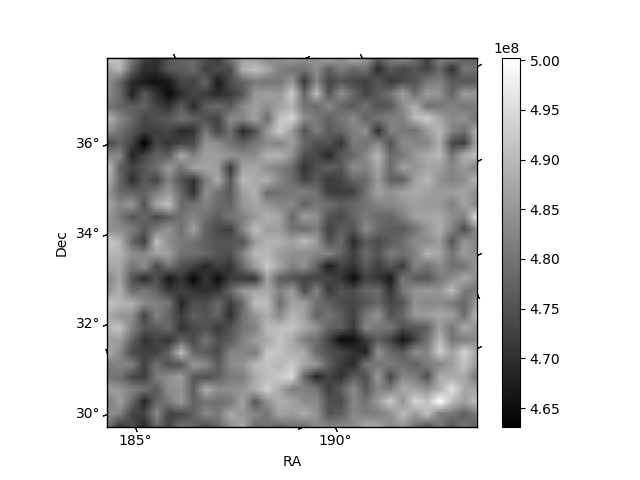
Histogram calculated using DETX and DETY for each event in the final _common_clean file
| Quadrant A | 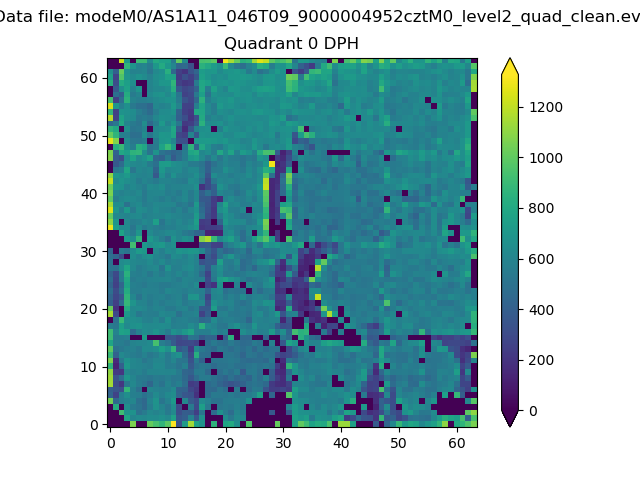 |
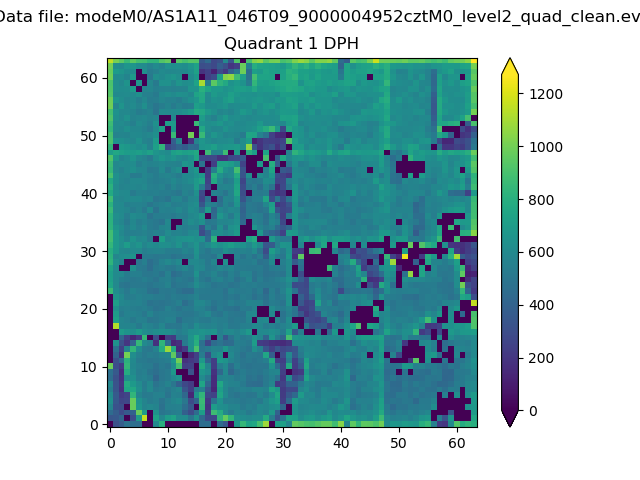 |
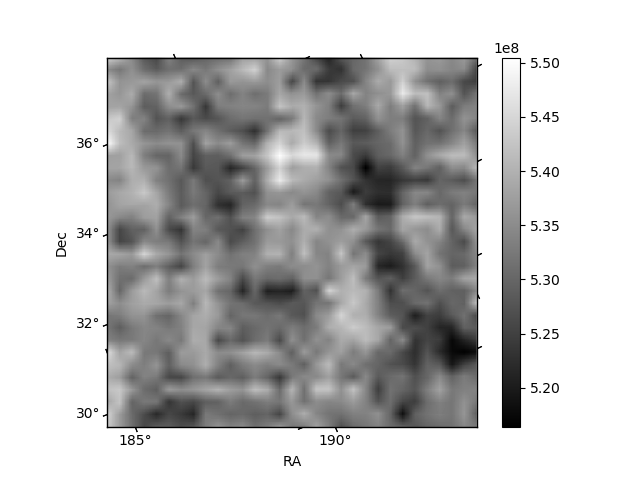
Quadrant B |
|---|---|---|---|
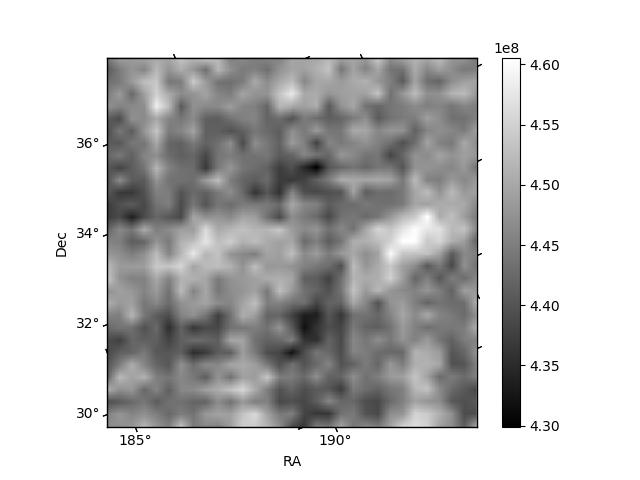
| Quadrant D | 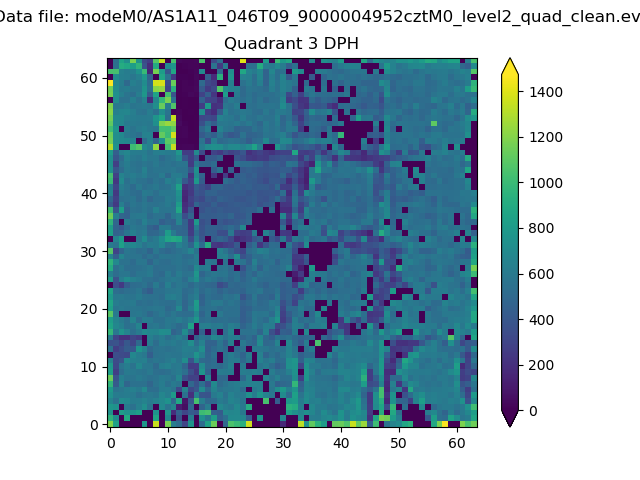 |
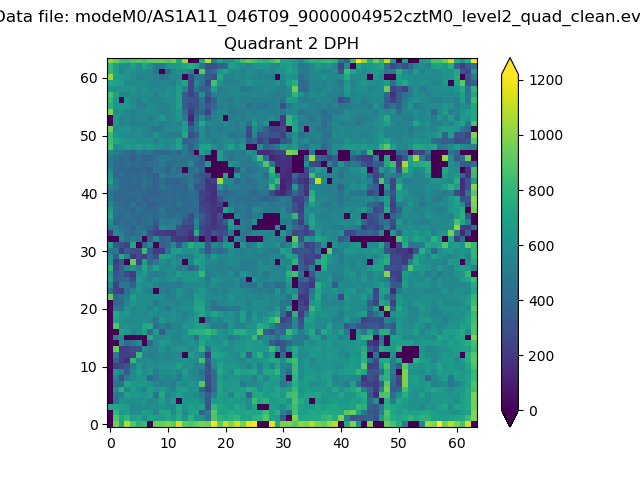 |
Quadrant C |
| Plot type | Count rate plots | Images |
|---|---|---|
| Comparison with Poisson distribution Blue bars denote a histogram of data divided into 1 sec bins. Red curve is a Poisson curve with rate = median count rate of data. |
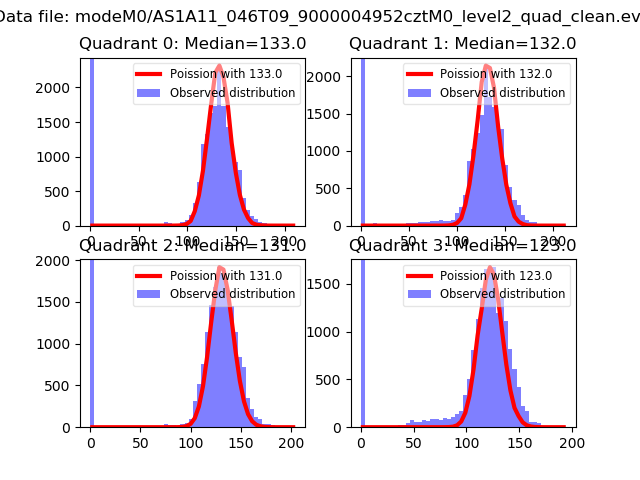 |
 |
| Quadrant-wise count rates Data is divided into 100 sec bins |
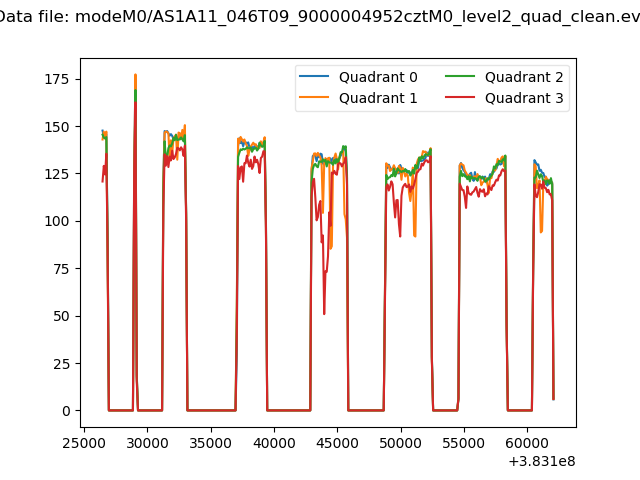 |
|
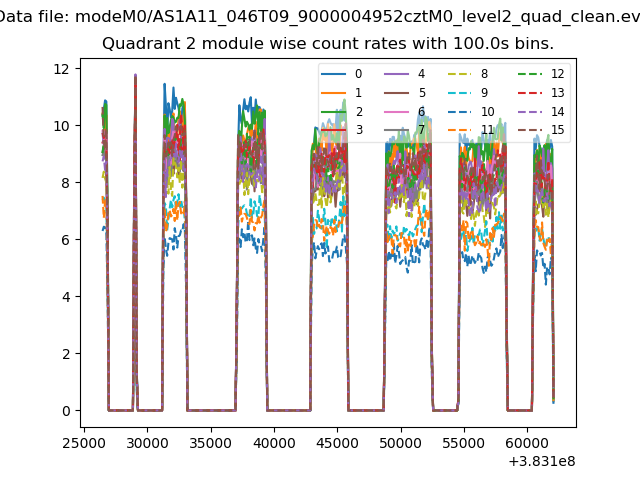
| Module-wise count rates for Quadrant A Data is divided into 100 sec bins |
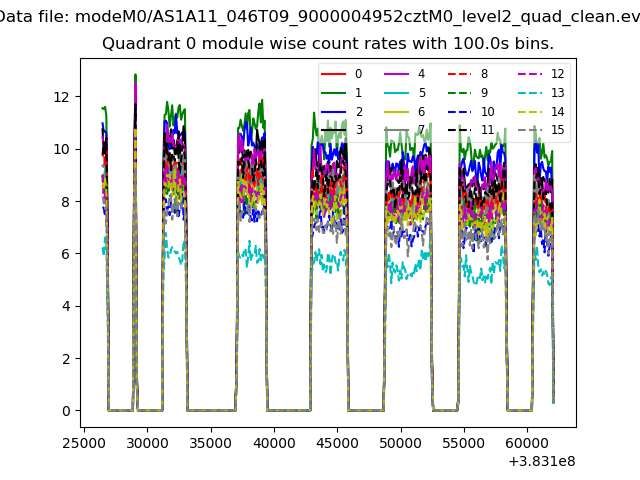 |
 |
| Module-wise count rates for Quadrant B Data is divided into 100 sec bins |
 |
 |
| Module-wise count rates for Quadrant C Data is divided into 100 sec bins |
 |
 |
| Module-wise count rates for Quadrant D Data is divided into 100 sec bins |
 |
 |
| Parameter | Plot |
|---|---|
| CZT HV Monitor | 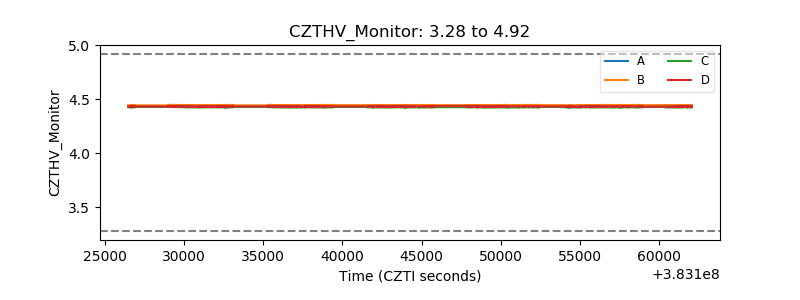 |
| D_VDD | 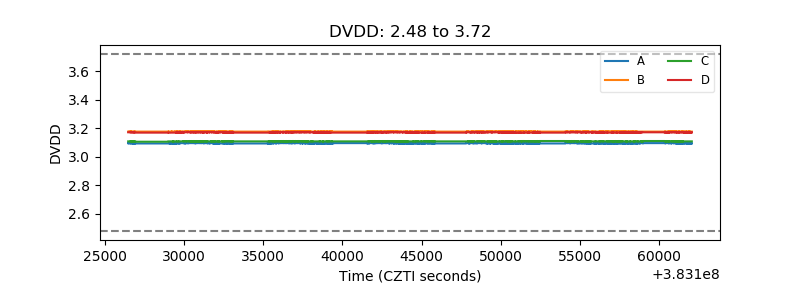 |
| Temperature 1 | 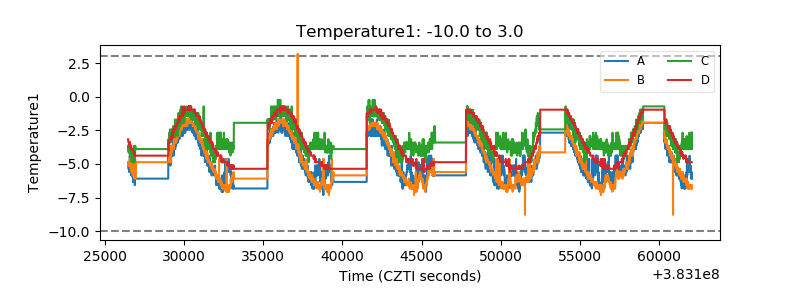 |
| Veto HV Monitor | 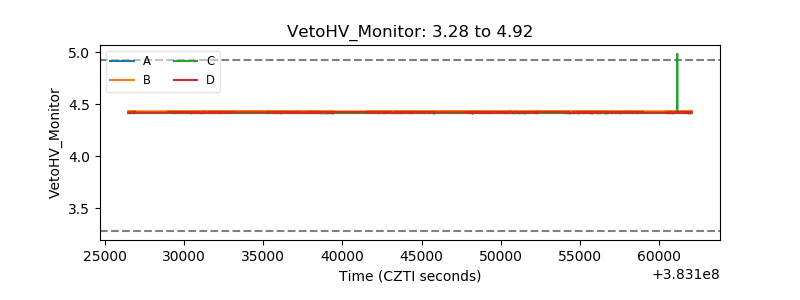 |
| Veto LLD | 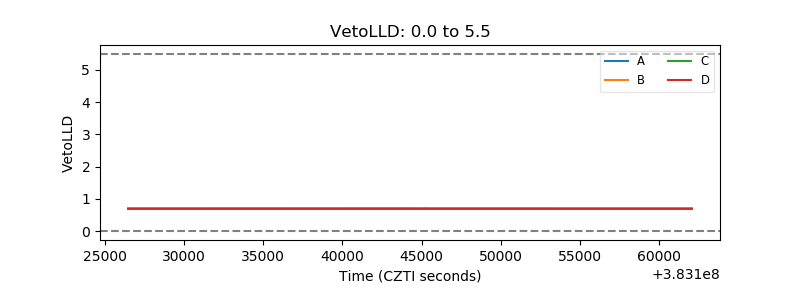 |
| Alpha Counter | 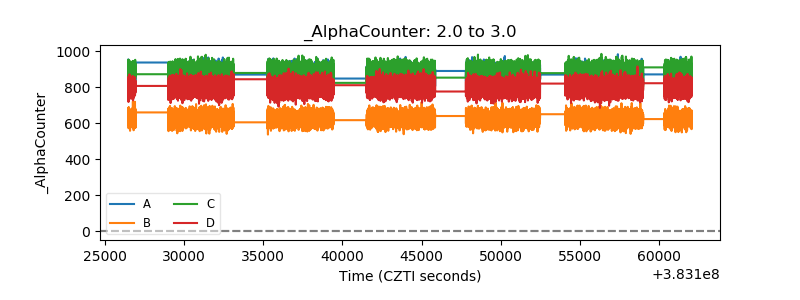 |
| _CPM_Rate | 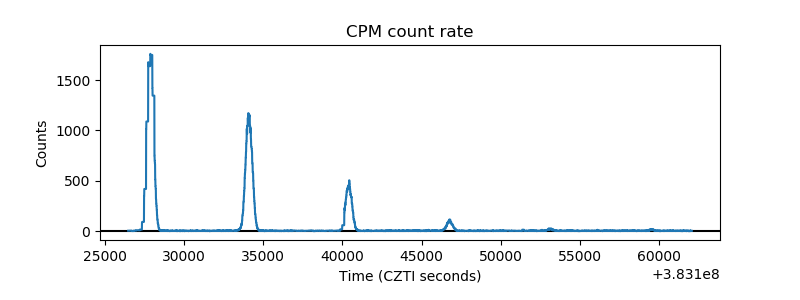 |
| CZT Counter | 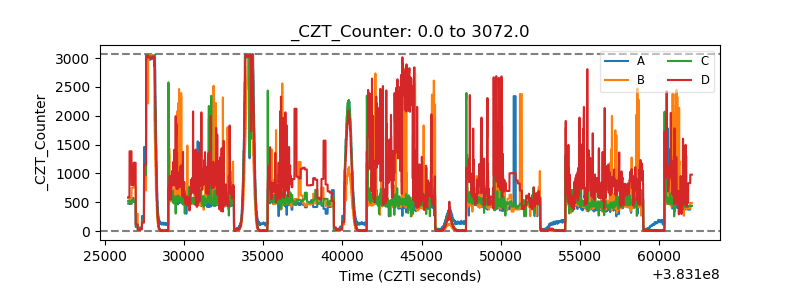 |
| +2.5 Volts monitor | 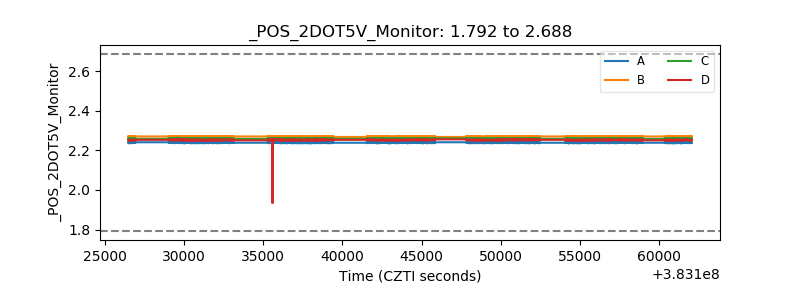 |
| +5 Volts monitor | 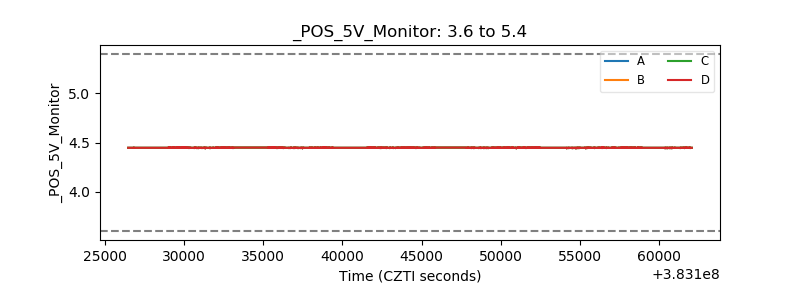 |
| _ROLL_ROT | 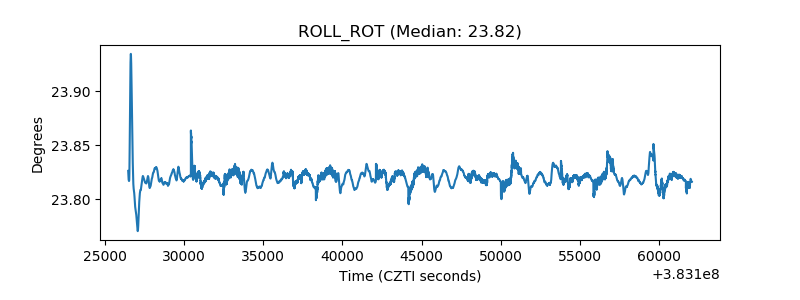 |
| _Roll_DEC | 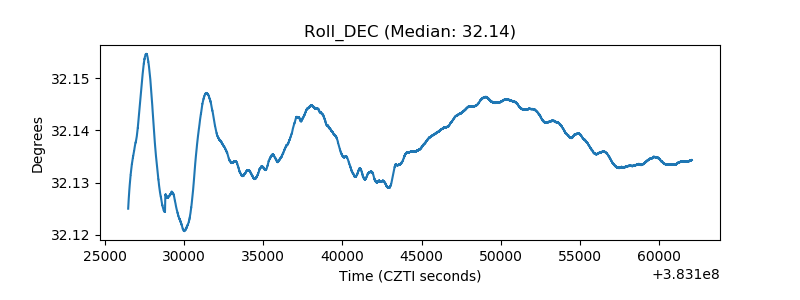 |
| _Roll_RA | 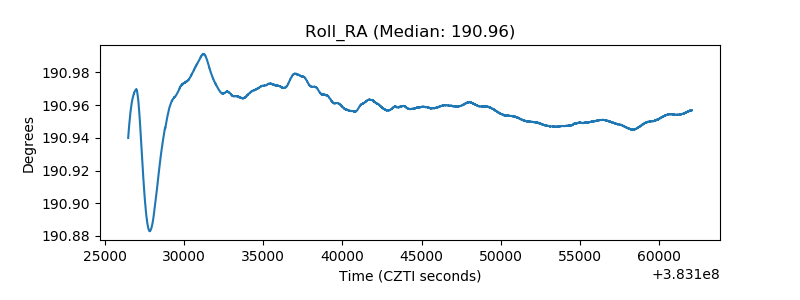 |
| Veto Counter | 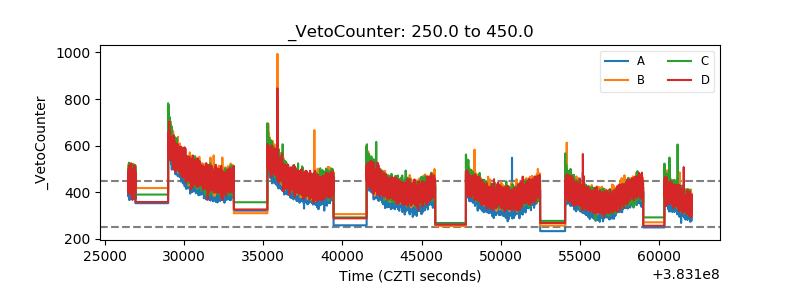 |