| Param | Original file | Final file |
|---|---|---|
| Filename | modeM0/AS1C07_014T01_9000004950_34610cztM0_level2.evt | modeM0/AS1C07_014T01_9000004950_34610cztM0_level2_quad_clean.evt |
| Size (bytes) | 248,598,720 | 38,070,720 |
| Size | 237.1 MB | 36.3 MB |
| Events in quadrant A | 1,406,595 | 252,881 |
| Events in quadrant B | 2,020,753 | 244,131 |
| Events in quadrant C | 1,508,147 | 247,166 |
| Events in quadrant D | 2,419,903 | 226,334 |
| Mode SS | |||
|---|---|---|---|
| Quadrant | BADHDUFLAG | Total packets | Discarded packets |
| A | 0 | 52 | 0 |
| B | 0 | 52 | 0 |
| C | 0 | 52 | 0 |
| D | 0 | 52 | 0 |
| Mode M9 | |||
|---|---|---|---|
| Quadrant | BADHDUFLAG | Total packets | Discarded packets |
| A | 0 | 14 | 0 |
| B | 0 | 14 | 0 |
| C | 0 | 14 | 0 |
| D | 0 | 15 | 0 |
| Mode M0 | |||
|---|---|---|---|
| Quadrant | BADHDUFLAG | Total packets | Discarded packets |
| A | 0 | 5546 | 1 |
| B | 0 | 7554 | 1 |
| C | 0 | 5937 | 1 |
| D | 0 | 8968 | 1 |
| Quadrant | Total seconds | Saturated seconds | Saturation percentage |
|---|---|---|---|
| A | 2529 | 9 | 0.355872% |
| B | 2529 | 215 | 8.501384% |
| C | 2529 | 33 | 1.304864% |
| D | 2529 | 38 | 1.502570% |
Noise dominated data is calculated using 1-second bins in cleaned event files. If a bin has >2000 counts, and if more than 50% of those come from <1% of pixels, then it is considered to be noise-dominated and hence unusable.
| Quadrant | # 1 sec bins | Bins with >0 counts | Bins with >2000 counts | High rate bins dominated by noise | Noise dominated (total time) | Noise dominated (detector-on time) | Marked lightcurve |
|---|---|---|---|---|---|---|---|
| A | 2529 | 2529 | 2 | 2 | 0.08% | 0.08% | 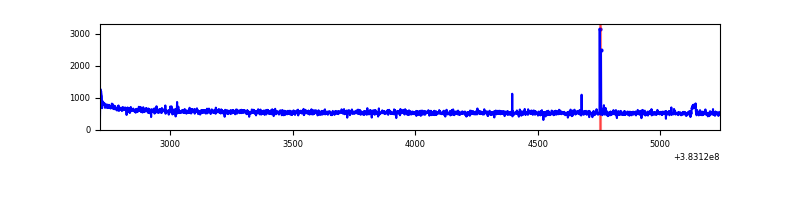 |
| B | 2529 | 2529 | 154 | 154 | 6.09% | 6.09% | 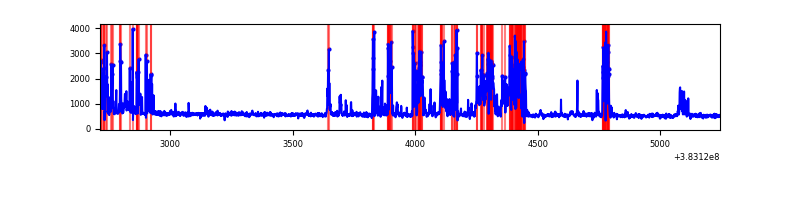 |
| C | 2529 | 2529 | 19 | 19 | 0.75% | 0.75% | 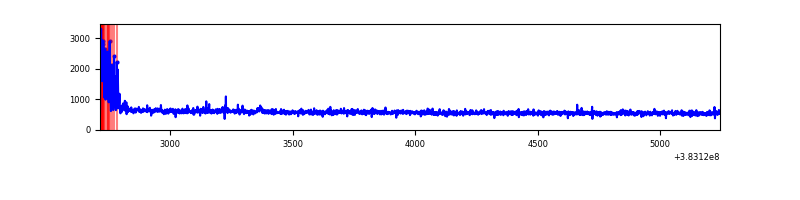 |
| D | 2529 | 2529 | 38 | 38 | 1.50% | 1.50% | 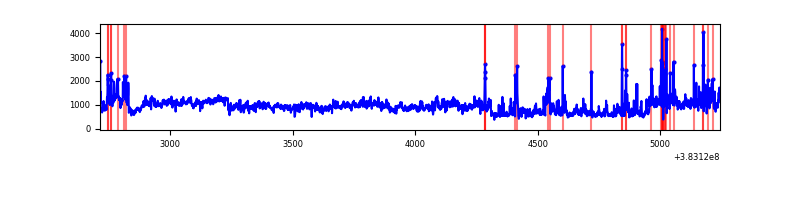 |
Top three noisy pixels from each quadrant. If the there are fewer than three noisy pixels in the level2.evt file, extra rows are filled as -1
| Pixel properties | Quadrant properties | ||||||
|---|---|---|---|---|---|---|---|
| Quadrant | DetID | PixID | Counts | Sigma | Mean | Median | Sigma |
| A | 10 | 83 | 21748 | 298.01 | 355 | 351 | 71.8 |
| A | 15 | 174 | 8578 | 114.58 | 355 | 351 | 71.8 |
| A | 13 | 254 | 4230 | 54.03 | 355 | 351 | 71.8 |
| B | 5 | 172 | 595995 | 9159.89 | 340 | 334 | 65.0 |
| B | 5 | 255 | 55395 | 846.71 | 340 | 334 | 65.0 |
| B | 10 | 245 | 14138 | 212.27 | 340 | 334 | 65.0 |
| C | 15 | 214 | 106976 | 1374.79 | 332 | 336 | 77.6 |
| C | 0 | 10 | 83829 | 1076.38 | 332 | 336 | 77.6 |
| C | 14 | 67 | 14626 | 184.23 | 332 | 336 | 77.6 |
| D | 8 | 195 | 843620 | 10292.3 | 332 | 325 | 81.9 |
| D | 7 | 223 | 94551 | 1150.02 | 332 | 325 | 81.9 |
| D | 12 | 235 | 60784 | 737.89 | 332 | 325 | 81.9 |
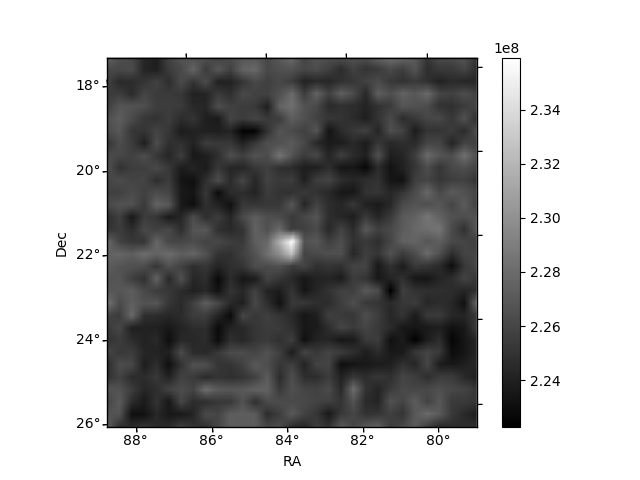
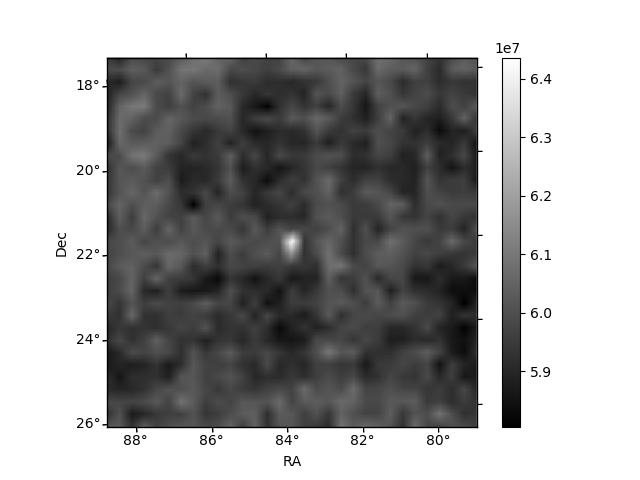
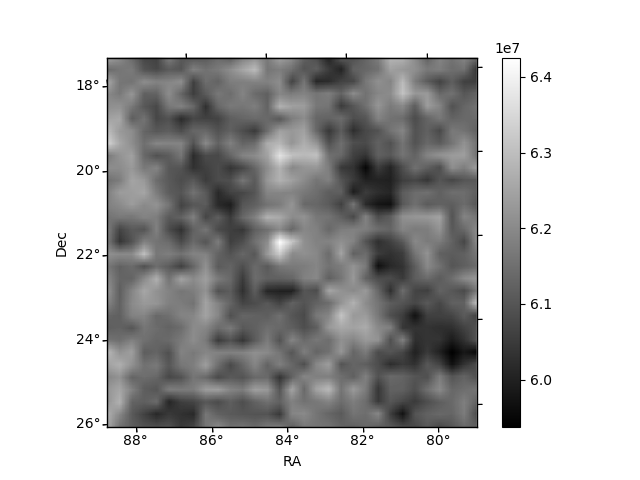
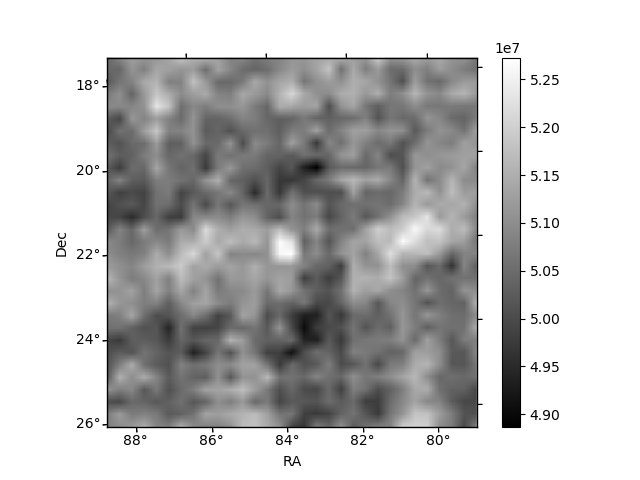
Histogram calculated using DETX and DETY for each event in the final _common_clean file
| Quadrant A | 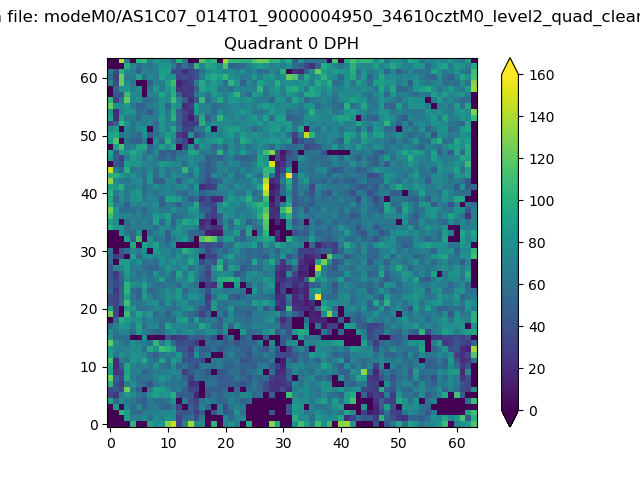 |
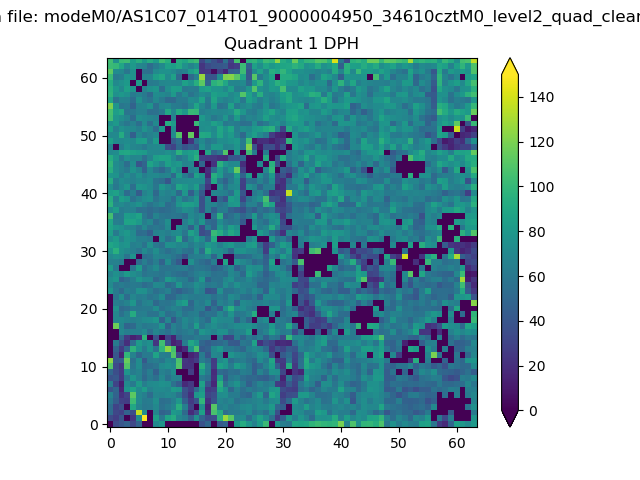 |
Quadrant B |
|---|---|---|---|
| Quadrant D |  |
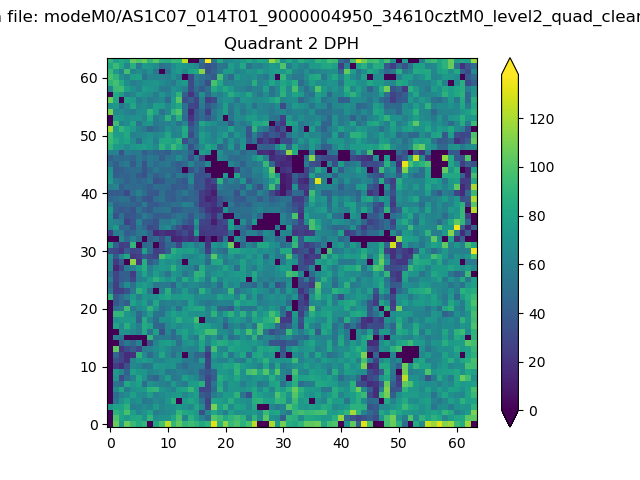 |
Quadrant C |
| Plot type | Count rate plots | Images |
|---|---|---|
| Comparison with Poisson distribution Blue bars denote a histogram of data divided into 1 sec bins. Red curve is a Poisson curve with rate = median count rate of data. |
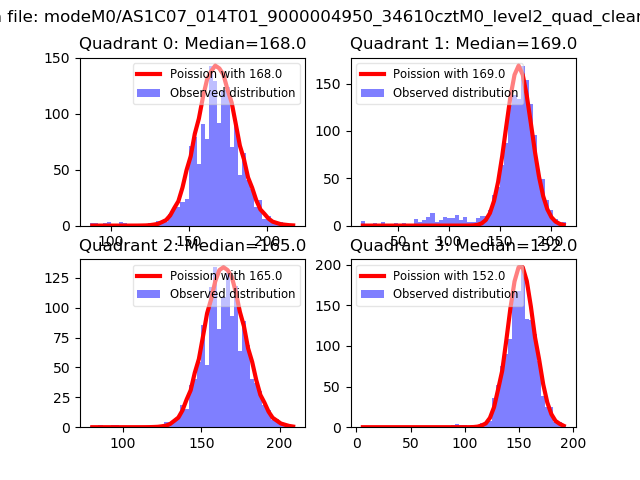 |
 |
| Quadrant-wise count rates Data is divided into 100 sec bins |
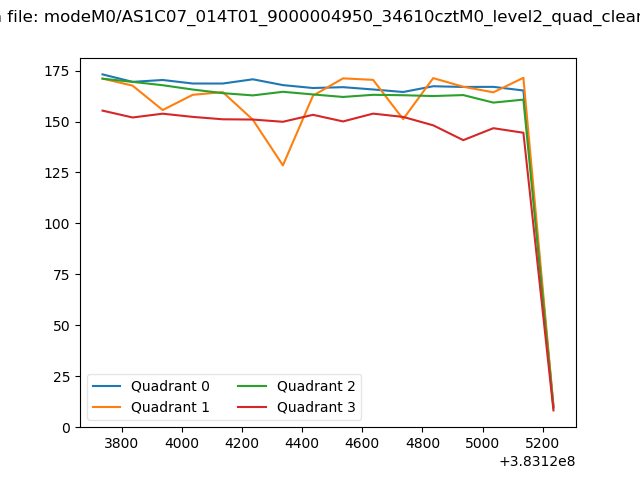 |
|
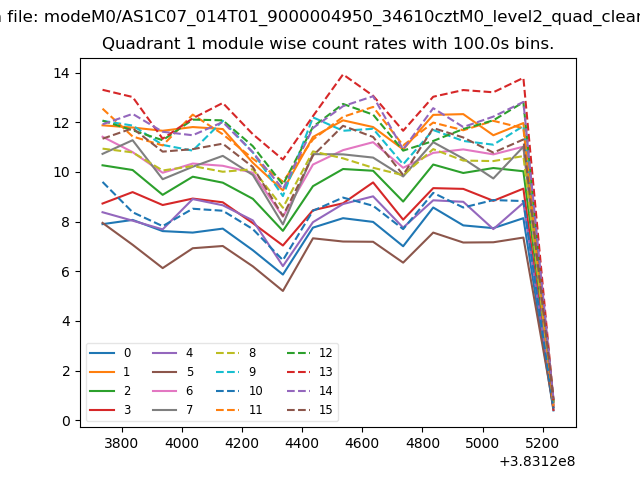
| Module-wise count rates for Quadrant A Data is divided into 100 sec bins |
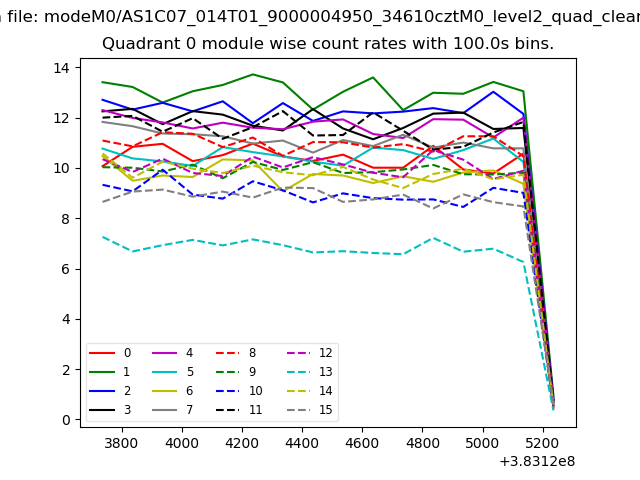 |
 |
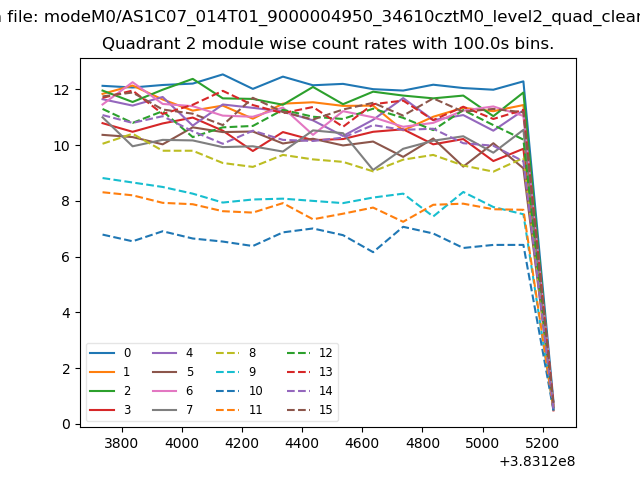
| Module-wise count rates for Quadrant B Data is divided into 100 sec bins |
 |
 |
| Module-wise count rates for Quadrant C Data is divided into 100 sec bins |
 |
 |
| Module-wise count rates for Quadrant D Data is divided into 100 sec bins |
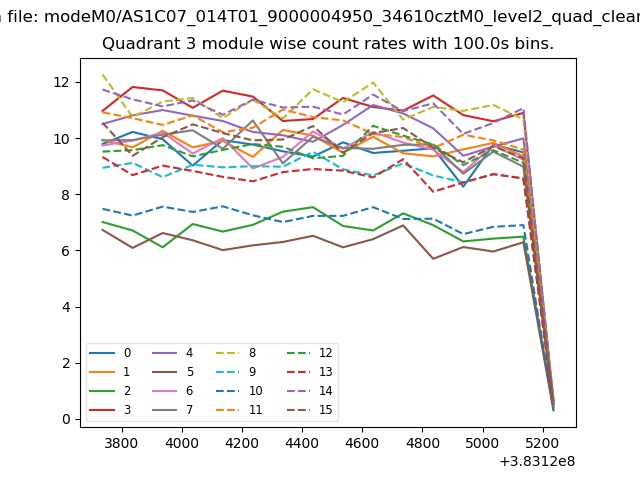 |
 |
| Parameter | Plot |
|---|---|
| CZT HV Monitor | 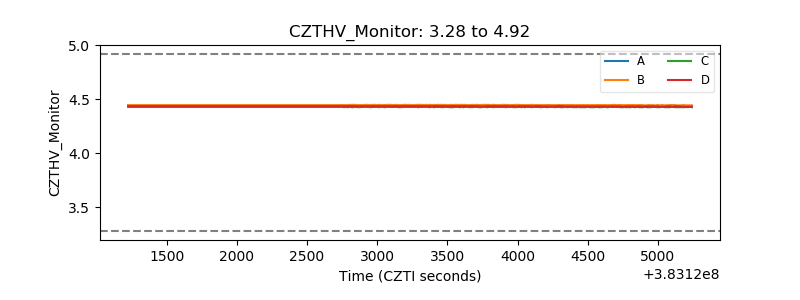 |
| D_VDD | 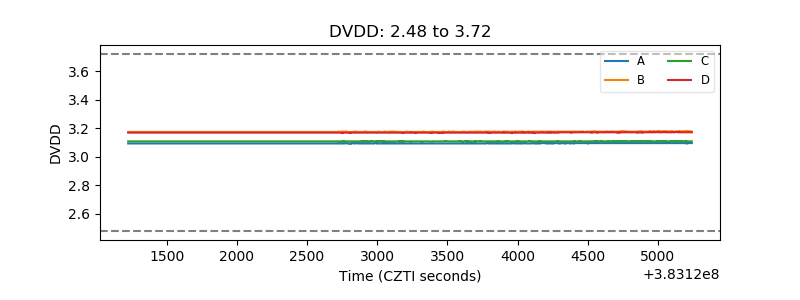 |
| Temperature 1 | 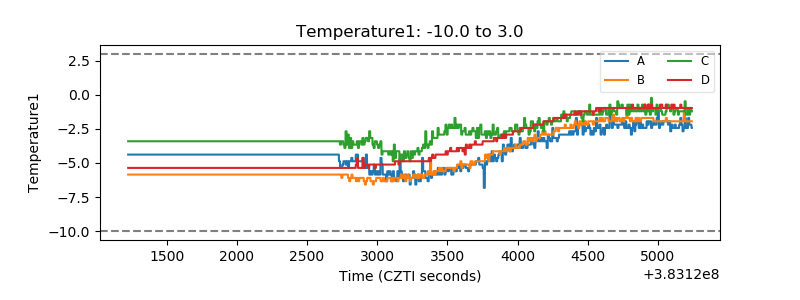 |
| Veto HV Monitor | 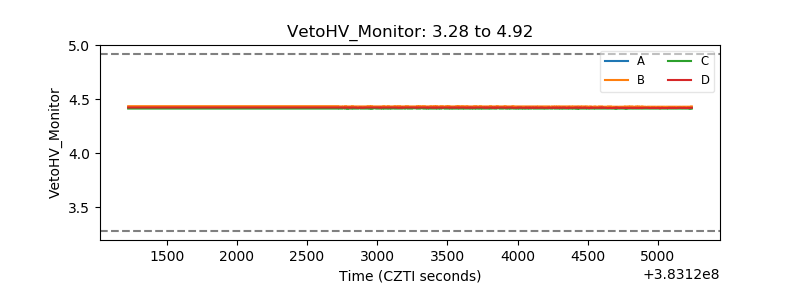 |
| Veto LLD | 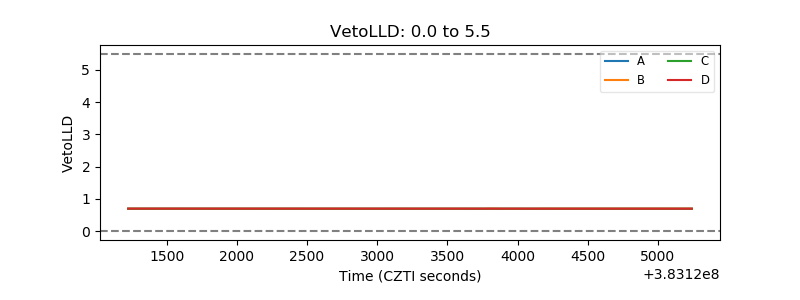 |
| Alpha Counter | 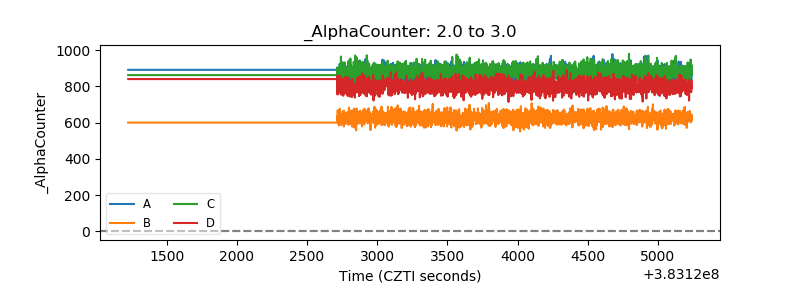 |
| _CPM_Rate | 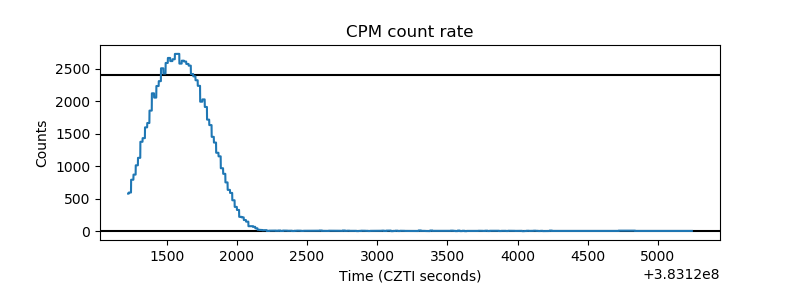 |
| CZT Counter | 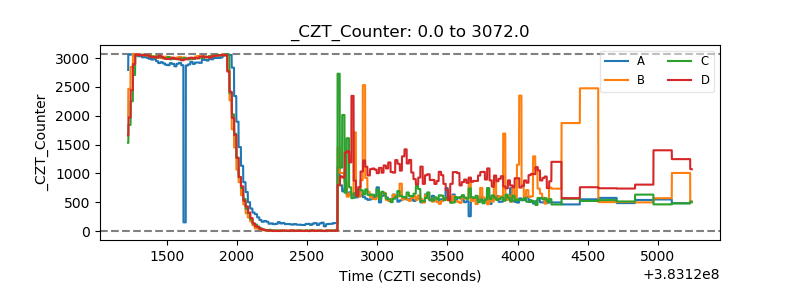 |
| +2.5 Volts monitor | 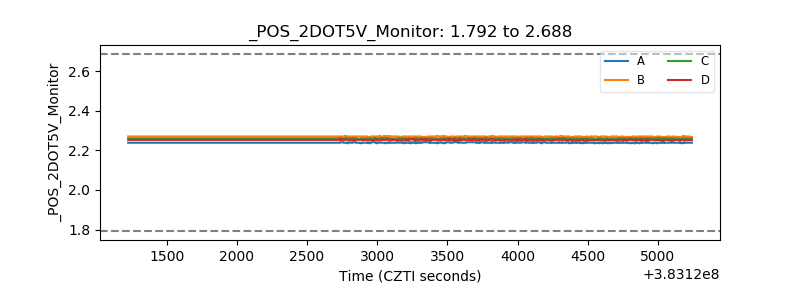 |
| +5 Volts monitor | 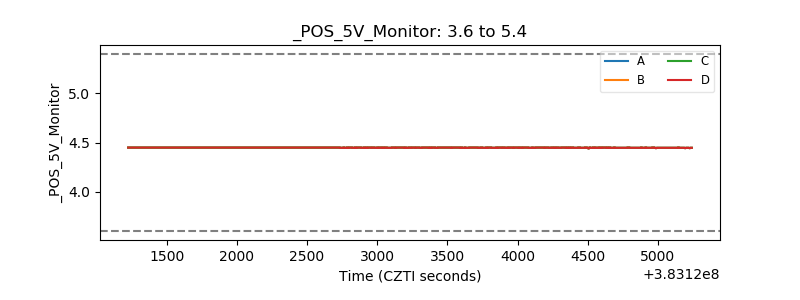 |
| _ROLL_ROT | 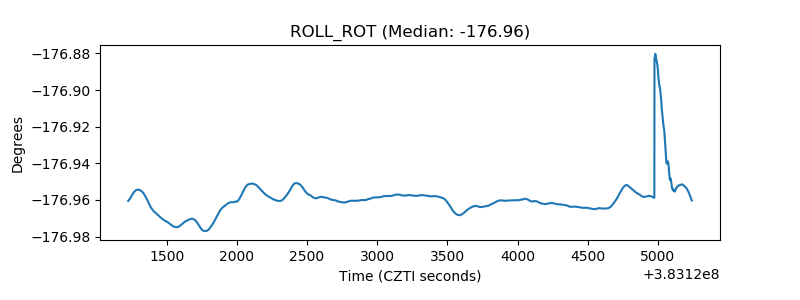 |
| _Roll_DEC | 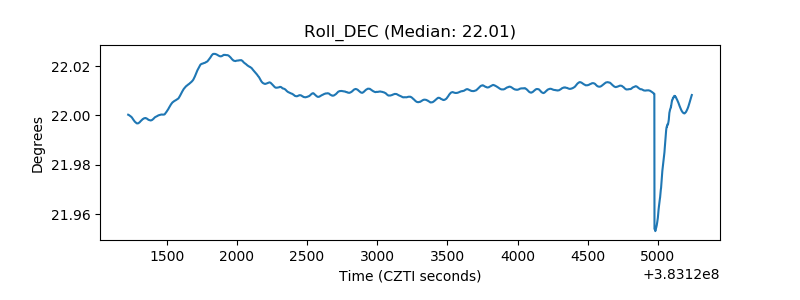 |
| _Roll_RA | 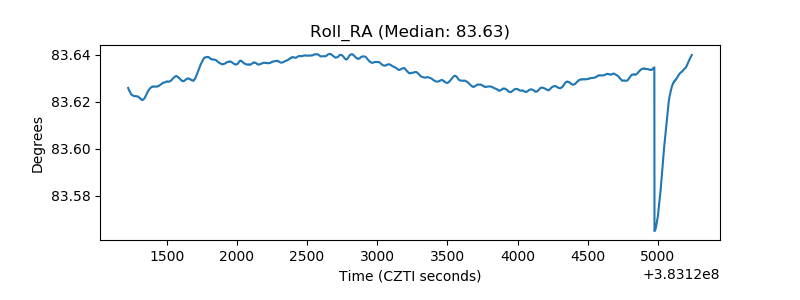 |
| Veto Counter | 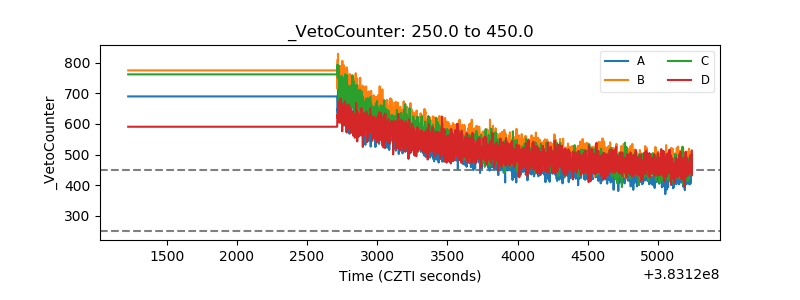 |