| Param | Original file | Final file |
|---|---|---|
| Filename | modeM0/AS1C07_014T01_9000004950_34609cztM0_level2.evt | modeM0/AS1C07_014T01_9000004950_34609cztM0_level2_quad_clean.evt |
| Size (bytes) | 540,138,240 | 68,463,360 |
| Size | 515.1 MB | 65.3 MB |
| Events in quadrant A | 2,706,332 | 455,051 |
| Events in quadrant B | 3,681,222 | 450,266 |
| Events in quadrant C | 3,018,258 | 445,187 |
| Events in quadrant D | 6,611,533 | 368,968 |
| Mode SS | |||
|---|---|---|---|
| Quadrant | BADHDUFLAG | Total packets | Discarded packets |
| A | 0 | 104 | 0 |
| B | 0 | 104 | 0 |
| C | 0 | 104 | 0 |
| D | 0 | 104 | 0 |
| Mode M9 | |||
|---|---|---|---|
| Quadrant | BADHDUFLAG | Total packets | Discarded packets |
| A | 0 | 31 | 0 |
| B | 0 | 31 | 0 |
| C | 0 | 31 | 0 |
| D | 0 | 32 | 0 |
| Mode M0 | |||
|---|---|---|---|
| Quadrant | BADHDUFLAG | Total packets | Discarded packets |
| A | 0 | 10766 | 3 |
| B | 0 | 14058 | 2 |
| C | 0 | 11845 | 2 |
| D | 0 | 23265 | 2 |
| Quadrant | Total seconds | Saturated seconds | Saturation percentage |
|---|---|---|---|
| A | 5034 | 11 | 0.218514% |
| B | 5034 | 289 | 5.740961% |
| C | 5034 | 77 | 1.529599% |
| D | 5034 | 807 | 16.030989% |
Noise dominated data is calculated using 1-second bins in cleaned event files. If a bin has >2000 counts, and if more than 50% of those come from <1% of pixels, then it is considered to be noise-dominated and hence unusable.
| Quadrant | # 1 sec bins | Bins with >0 counts | Bins with >2000 counts | High rate bins dominated by noise | Noise dominated (total time) | Noise dominated (detector-on time) | Marked lightcurve |
|---|---|---|---|---|---|---|---|
| A | 7007 | 5035 | 1 | 1 | 0.01% | 0.02% | 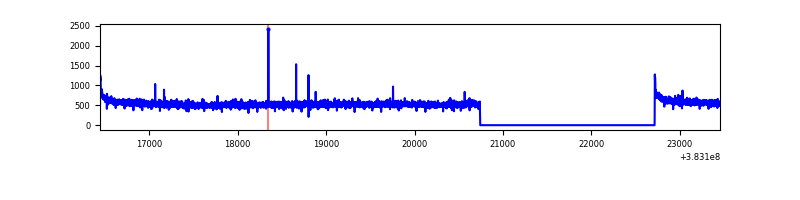 |
| B | 7007 | 5035 | 173 | 173 | 2.47% | 3.44% | 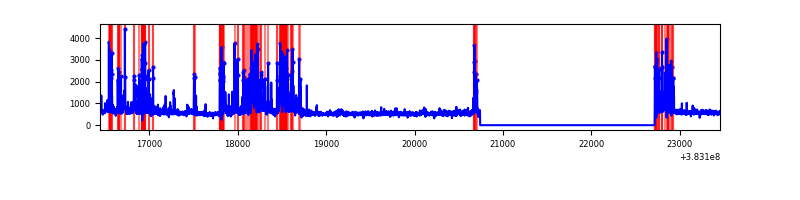 |
| C | 7007 | 5035 | 48 | 48 | 0.69% | 0.95% | 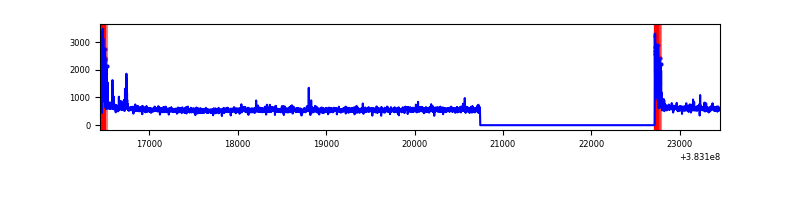 |
| D | 7007 | 5035 | 756 | 756 | 10.79% | 15.01% | 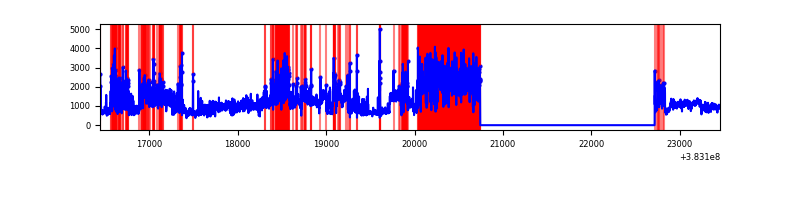 |
Top three noisy pixels from each quadrant. If the there are fewer than three noisy pixels in the level2.evt file, extra rows are filled as -1
| Pixel properties | Quadrant properties | ||||||
|---|---|---|---|---|---|---|---|
| Quadrant | DetID | PixID | Counts | Sigma | Mean | Median | Sigma |
| A | 10 | 83 | 43933 | 318.66 | 685 | 676 | 135.7 |
| A | 13 | 6 | 9313 | 63.63 | 685 | 676 | 135.7 |
| A | 13 | 254 | 9290 | 63.46 | 685 | 676 | 135.7 |
| B | 5 | 172 | 815605 | 6420.97 | 668 | 655 | 126.9 |
| B | 4 | 170 | 120714 | 945.94 | 668 | 655 | 126.9 |
| B | 5 | 255 | 35753 | 276.54 | 668 | 655 | 126.9 |
| C | 15 | 214 | 215967 | 1440.87 | 647 | 656 | 149.4 |
| C | 0 | 10 | 167700 | 1117.87 | 647 | 656 | 149.4 |
| C | 14 | 67 | 51065 | 337.34 | 647 | 656 | 149.4 |
| D | 8 | 195 | 2029545 | 12379.88 | 610 | 600 | 163.9 |
| D | 7 | 223 | 1229584 | 7498.81 | 610 | 600 | 163.9 |
| D | 7 | 38 | 624536 | 3807.03 | 610 | 600 | 163.9 |
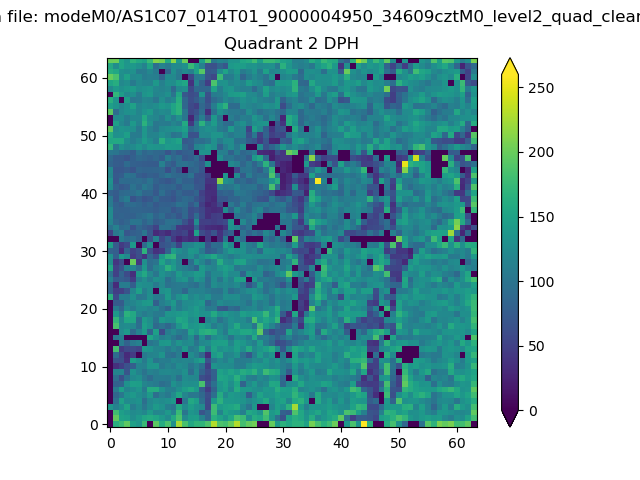
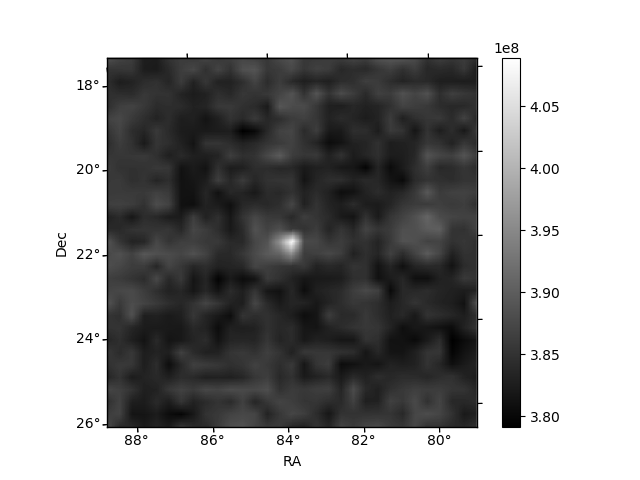
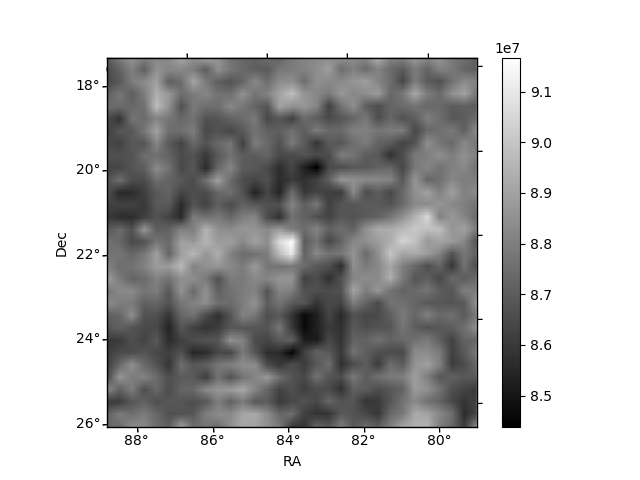
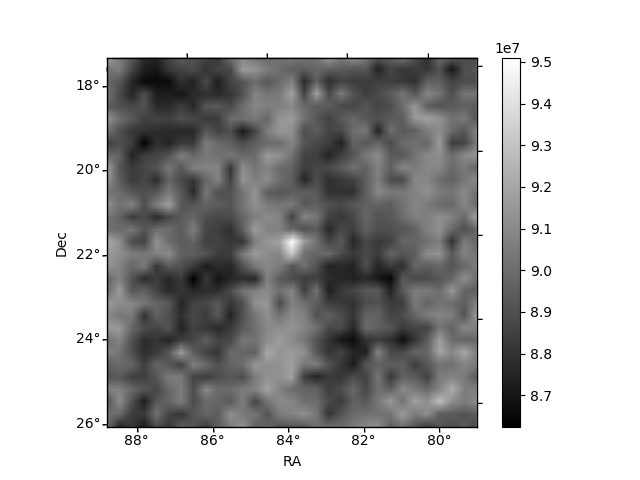
Histogram calculated using DETX and DETY for each event in the final _common_clean file
| Quadrant A | 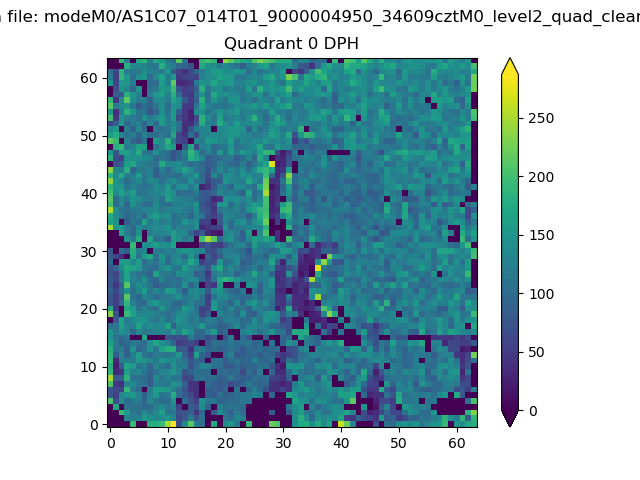 |
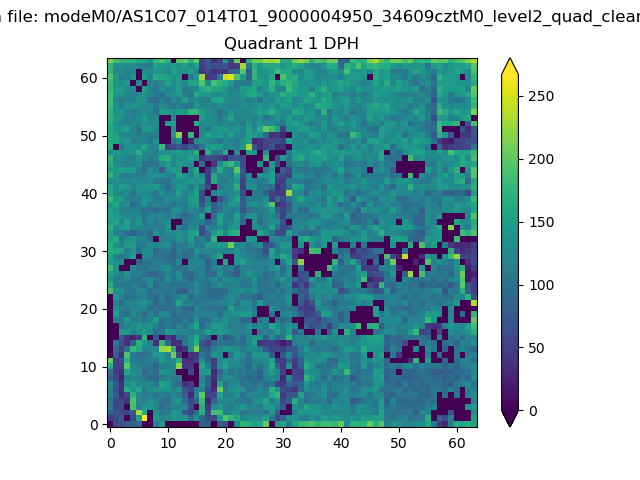 |
Quadrant B |
|---|---|---|---|
| Quadrant D | 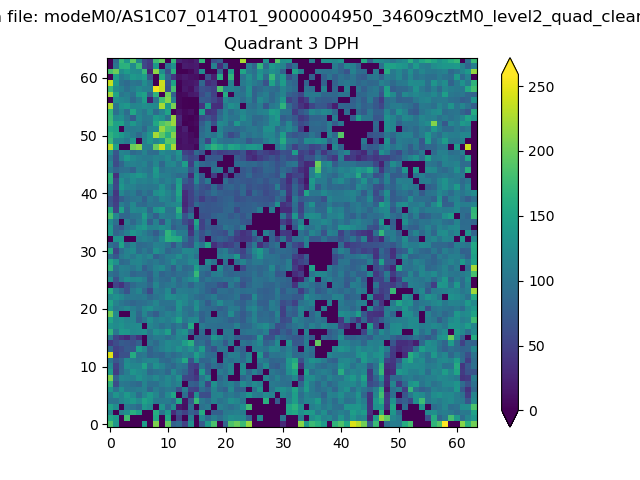 |
 |
Quadrant C |
| Plot type | Count rate plots | Images |
|---|---|---|
| Comparison with Poisson distribution Blue bars denote a histogram of data divided into 1 sec bins. Red curve is a Poisson curve with rate = median count rate of data. |
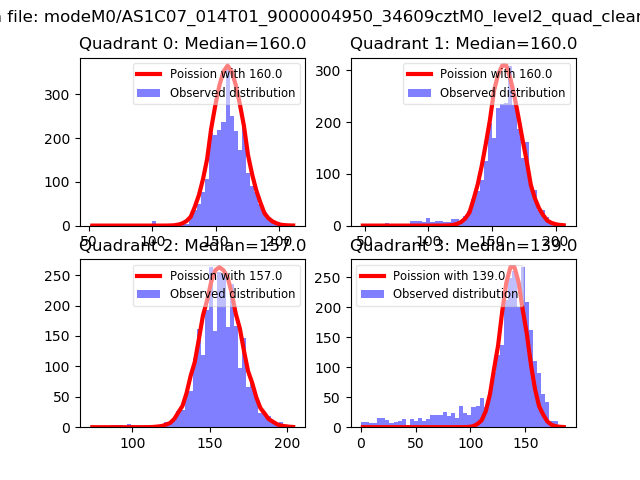 |
 |
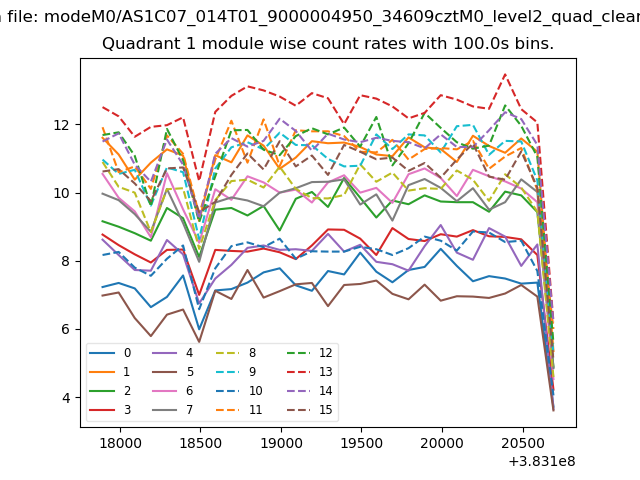
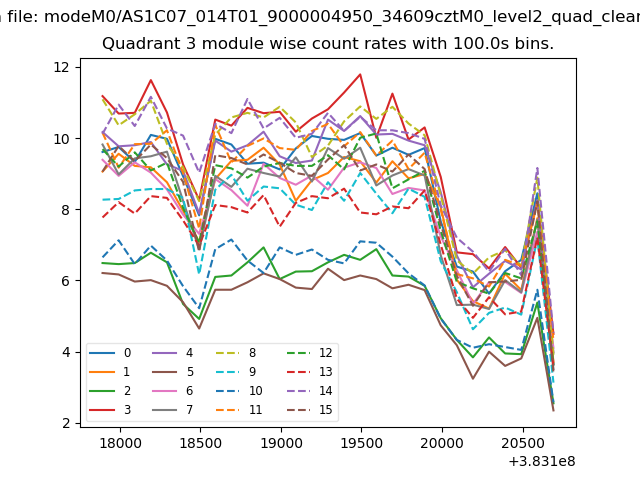
| Quadrant-wise count rates Data is divided into 100 sec bins |
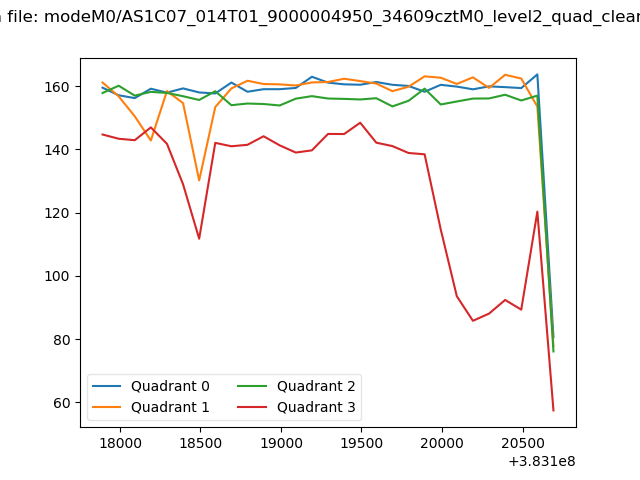 |
|
| Module-wise count rates for Quadrant A Data is divided into 100 sec bins |
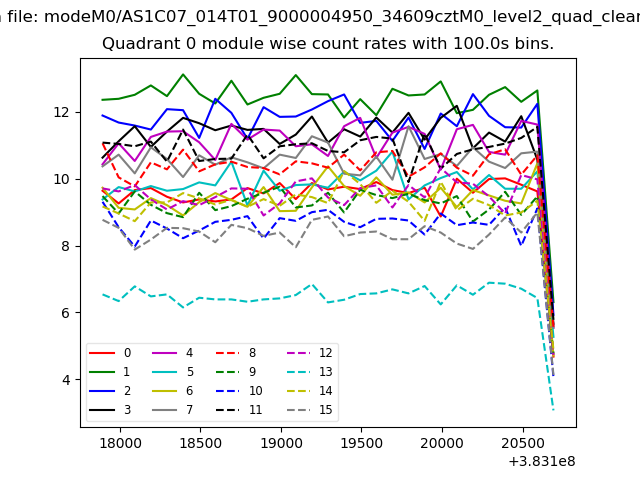 |
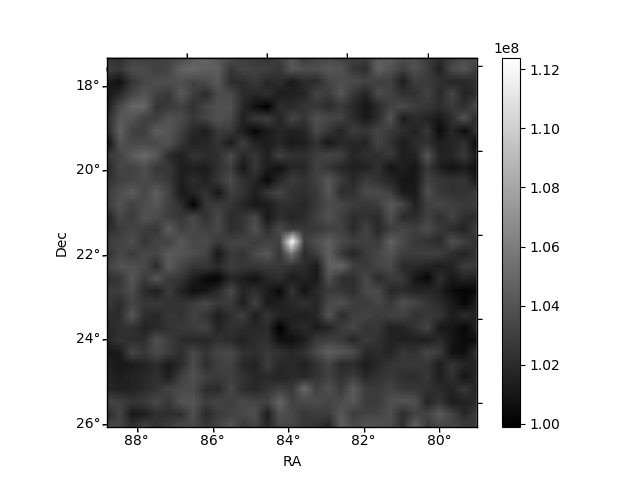 |
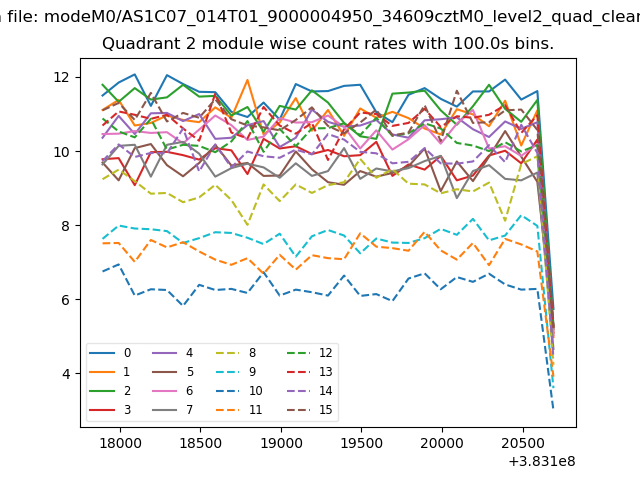
| Module-wise count rates for Quadrant B Data is divided into 100 sec bins |
 |
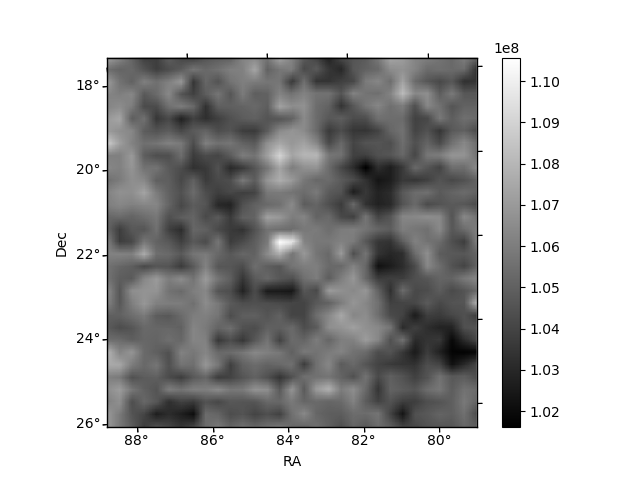 |
| Module-wise count rates for Quadrant C Data is divided into 100 sec bins |
 |
 |
| Module-wise count rates for Quadrant D Data is divided into 100 sec bins |
 |
 |
| Parameter | Plot |
|---|---|
| CZT HV Monitor |  |
| D_VDD | 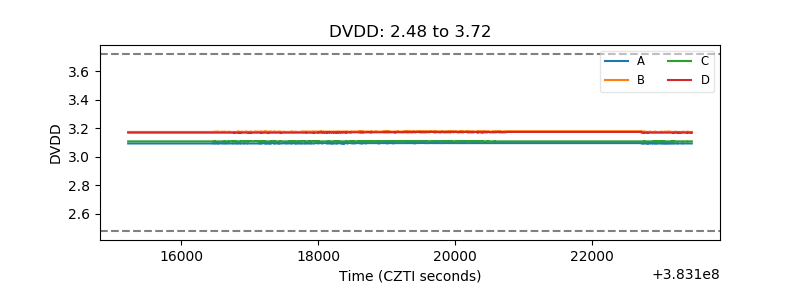 |
| Temperature 1 | 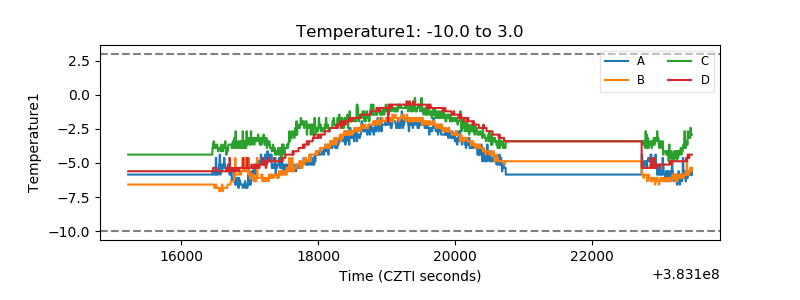 |
| Veto HV Monitor | 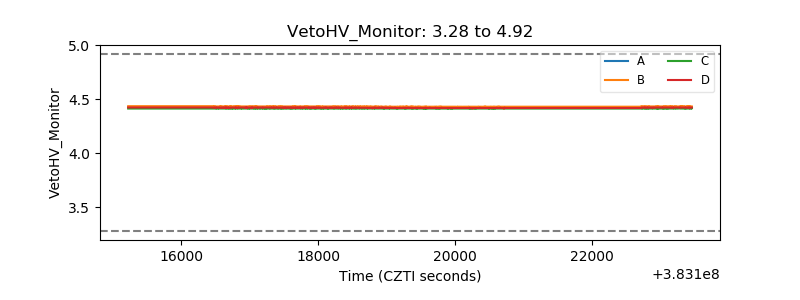 |
| Veto LLD | 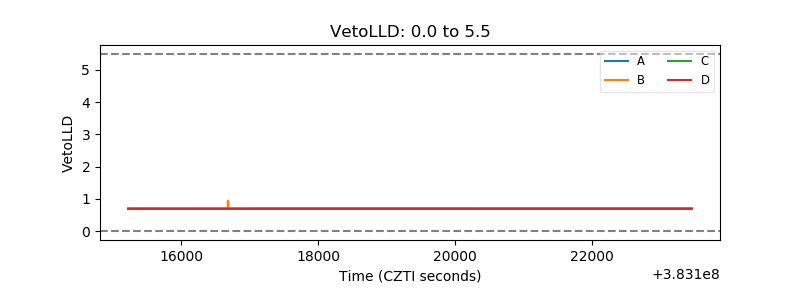 |
| Alpha Counter | 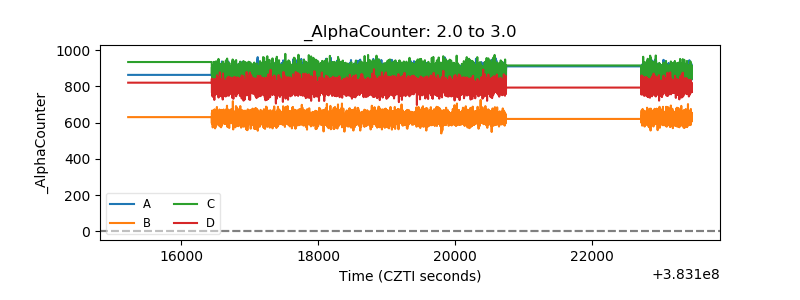 |
| _CPM_Rate | 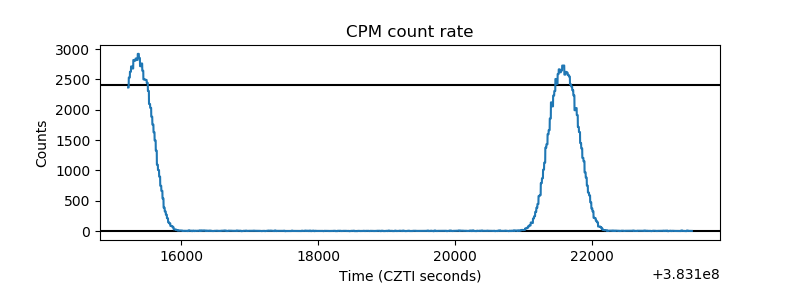 |
| CZT Counter | 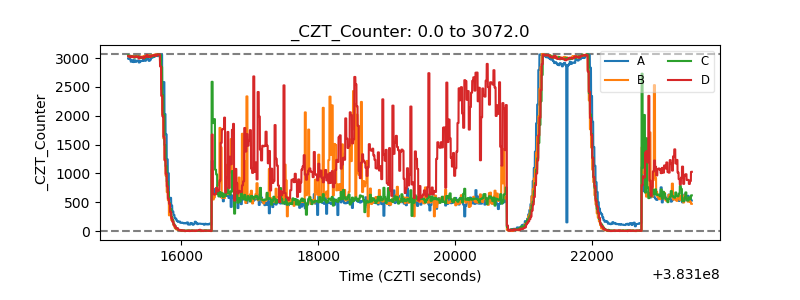 |
| +2.5 Volts monitor | 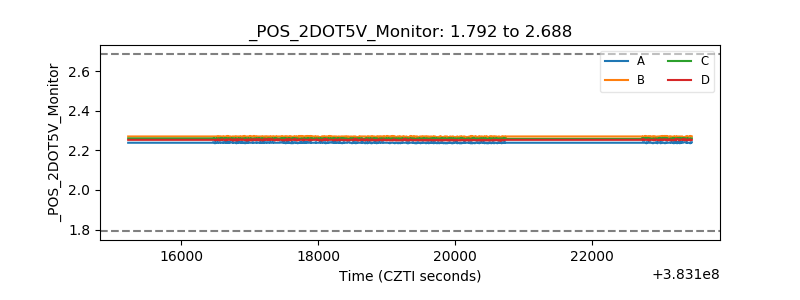 |
| +5 Volts monitor | 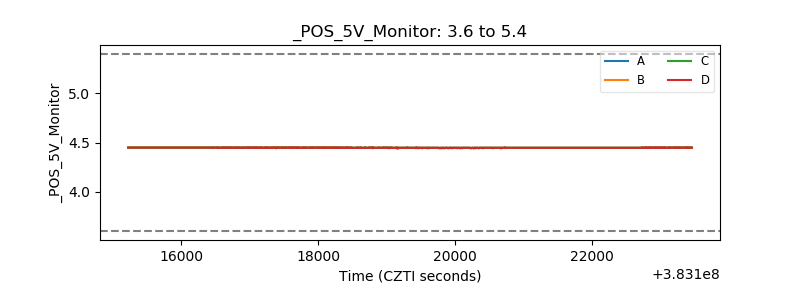 |
| _ROLL_ROT | 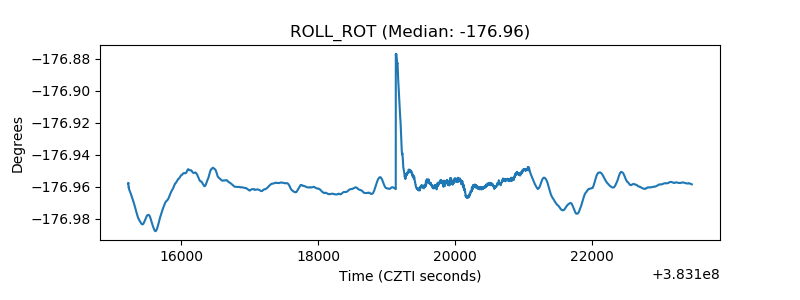 |
| _Roll_DEC | 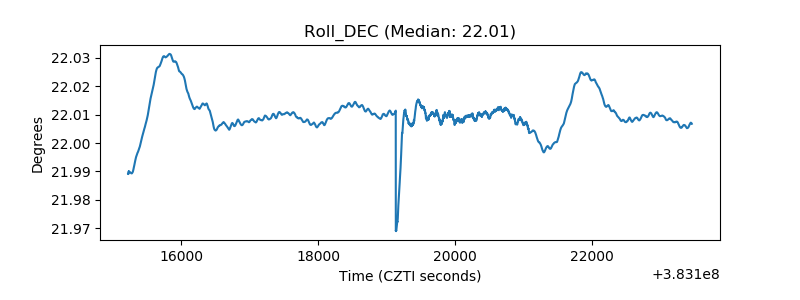 |
| _Roll_RA | 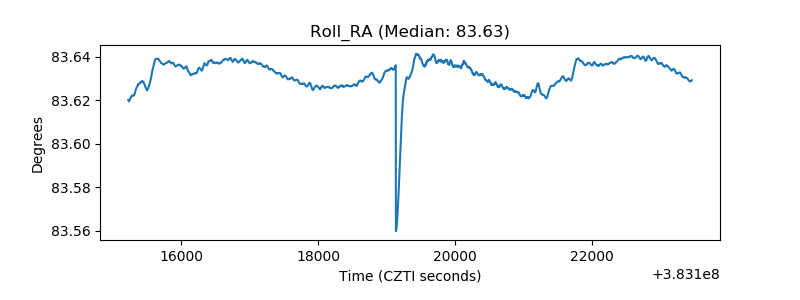 |
| Veto Counter | 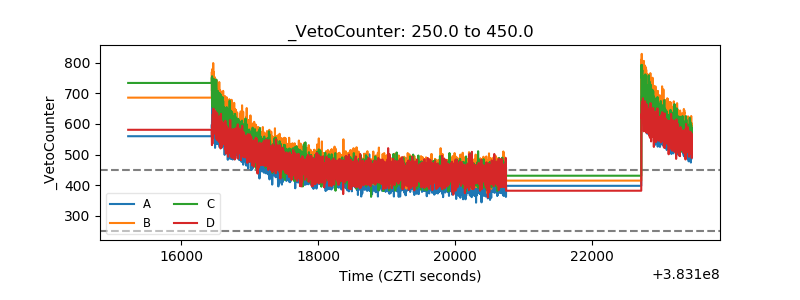 |