| Param | Original file | Final file |
|---|---|---|
| Filename | modeM0/AS1C07_014T01_9000004950_34608cztM0_level2.evt | modeM0/AS1C07_014T01_9000004950_34608cztM0_level2_quad_clean.evt |
| Size (bytes) | 564,655,680 | 60,811,200 |
| Size | 538.5 MB | 58.0 MB |
| Events in quadrant A | 2,749,237 | 387,251 |
| Events in quadrant B | 3,883,681 | 381,701 |
| Events in quadrant C | 3,123,157 | 381,796 |
| Events in quadrant D | 6,980,391 | 313,144 |
| Mode SS | |||
|---|---|---|---|
| Quadrant | BADHDUFLAG | Total packets | Discarded packets |
| A | 0 | 110 | 0 |
| B | 0 | 110 | 0 |
| C | 0 | 110 | 0 |
| D | 0 | 110 | 0 |
| Mode M9 | |||
|---|---|---|---|
| Quadrant | BADHDUFLAG | Total packets | Discarded packets |
| A | 0 | 28 | 0 |
| B | 0 | 28 | 0 |
| C | 0 | 28 | 0 |
| D | 0 | 29 | 0 |
| Mode M0 | |||
|---|---|---|---|
| Quadrant | BADHDUFLAG | Total packets | Discarded packets |
| A | 0 | 11177 | 3 |
| B | 0 | 14837 | 2 |
| C | 0 | 12290 | 2 |
| D | 0 | 24550 | 2 |
| Quadrant | Total seconds | Saturated seconds | Saturation percentage |
|---|---|---|---|
| A | 5381 | 7 | 0.130087% |
| B | 5381 | 345 | 6.411448% |
| C | 5381 | 69 | 1.282290% |
| D | 5381 | 1003 | 18.639658% |
Noise dominated data is calculated using 1-second bins in cleaned event files. If a bin has >2000 counts, and if more than 50% of those come from <1% of pixels, then it is considered to be noise-dominated and hence unusable.
| Quadrant | # 1 sec bins | Bins with >0 counts | Bins with >2000 counts | High rate bins dominated by noise | Noise dominated (total time) | Noise dominated (detector-on time) | Marked lightcurve |
|---|---|---|---|---|---|---|---|
| A | 7234 | 5382 | 0 | 0 | 0.00% | 0.00% | 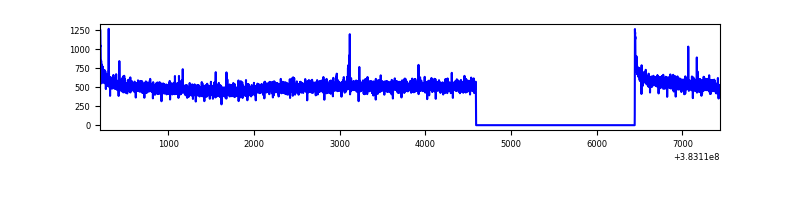 |
| B | 7234 | 5382 | 223 | 223 | 3.08% | 4.14% | 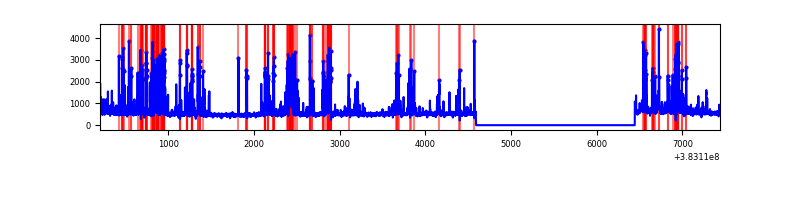 |
| C | 7234 | 5382 | 45 | 45 | 0.62% | 0.84% | 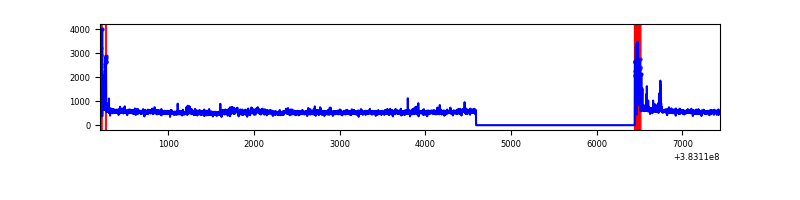 |
| D | 7234 | 5382 | 883 | 883 | 12.21% | 16.41% | 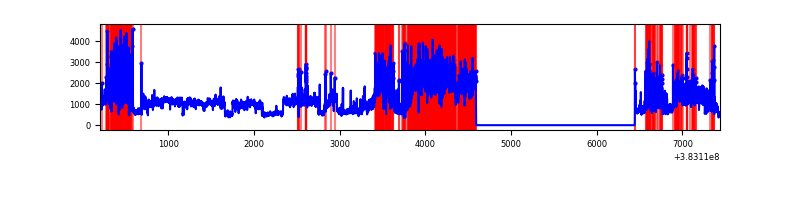 |
Top three noisy pixels from each quadrant. If the there are fewer than three noisy pixels in the level2.evt file, extra rows are filled as -1
| Pixel properties | Quadrant properties | ||||||
|---|---|---|---|---|---|---|---|
| Quadrant | DetID | PixID | Counts | Sigma | Mean | Median | Sigma |
| A | 10 | 83 | 44237 | 311.97 | 697 | 684 | 139.6 |
| A | 13 | 254 | 9805 | 65.33 | 697 | 684 | 139.6 |
| A | 15 | 174 | 6964 | 44.98 | 697 | 684 | 139.6 |
| B | 5 | 172 | 1070332 | 8283.02 | 677 | 661 | 129.1 |
| B | 5 | 255 | 58330 | 446.56 | 677 | 661 | 129.1 |
| B | 4 | 170 | 56231 | 430.31 | 677 | 661 | 129.1 |
| C | 15 | 214 | 228294 | 1488.15 | 665 | 673 | 153.0 |
| C | 0 | 10 | 158023 | 1028.73 | 665 | 673 | 153.0 |
| C | 14 | 67 | 84088 | 545.35 | 665 | 673 | 153.0 |
| D | 8 | 195 | 1801637 | 10688.78 | 613 | 602 | 168.5 |
| D | 7 | 38 | 846880 | 5022.49 | 613 | 602 | 168.5 |
| D | 7 | 223 | 577135 | 3421.61 | 613 | 602 | 168.5 |
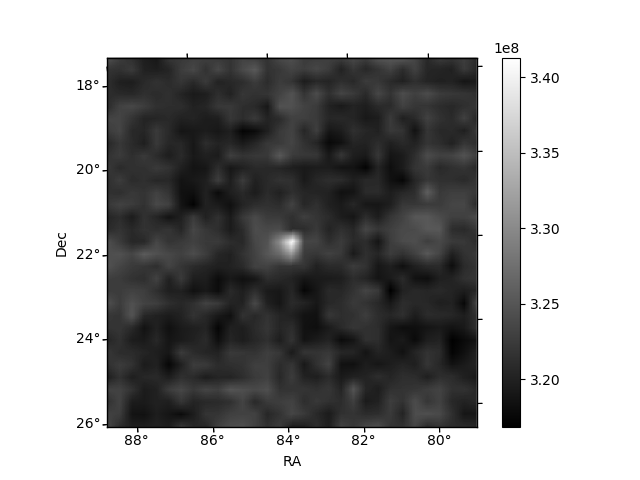
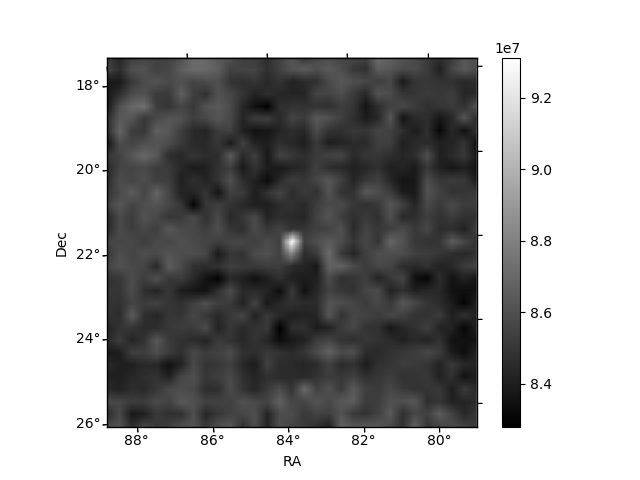
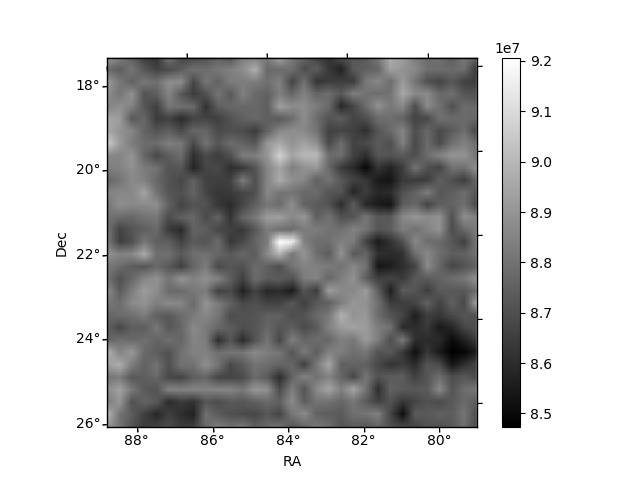
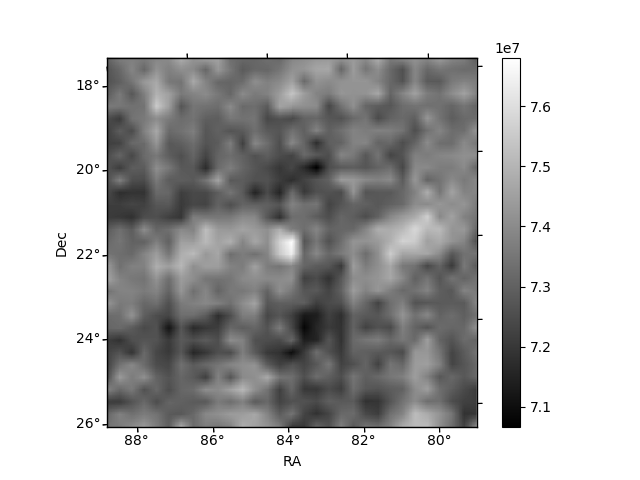
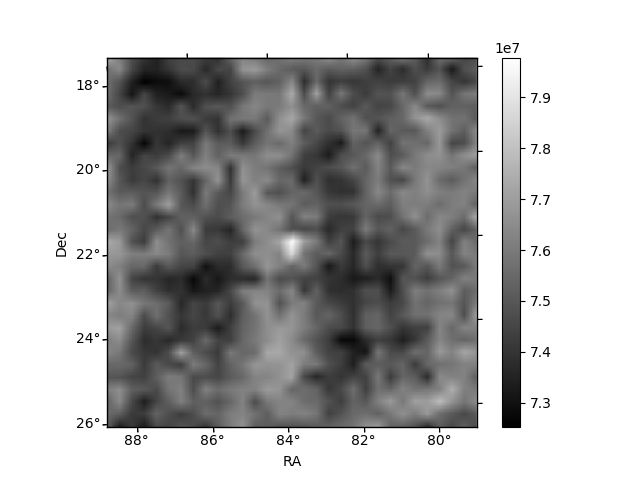
Histogram calculated using DETX and DETY for each event in the final _common_clean file
| Quadrant A | 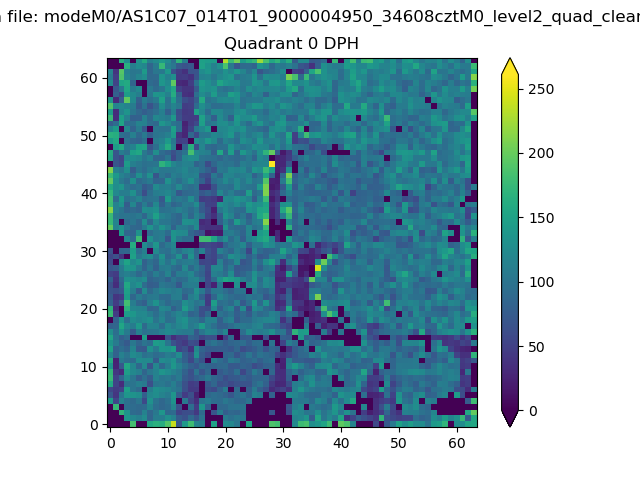 |
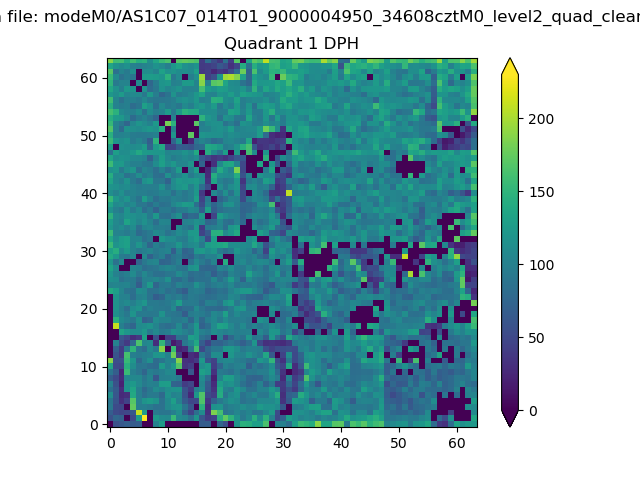 |
Quadrant B |
|---|---|---|---|
| Quadrant D |  |
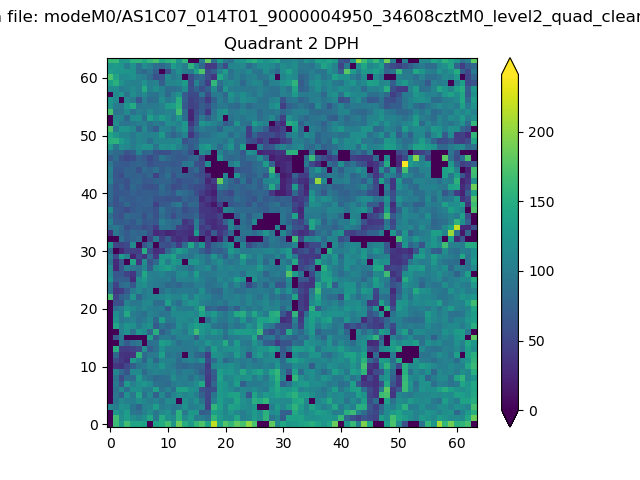 |
Quadrant C |
| Plot type | Count rate plots | Images |
|---|---|---|
| Comparison with Poisson distribution Blue bars denote a histogram of data divided into 1 sec bins. Red curve is a Poisson curve with rate = median count rate of data. |
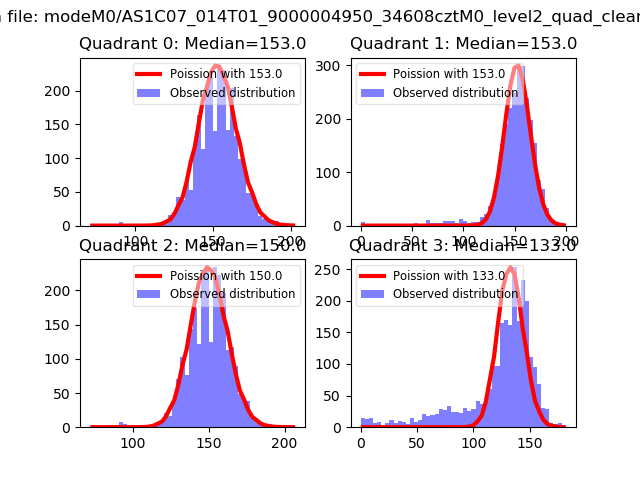 |
 |
| Quadrant-wise count rates Data is divided into 100 sec bins |
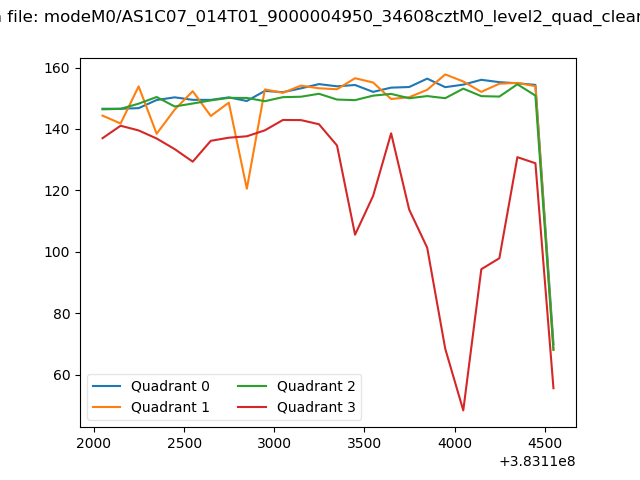 |
|
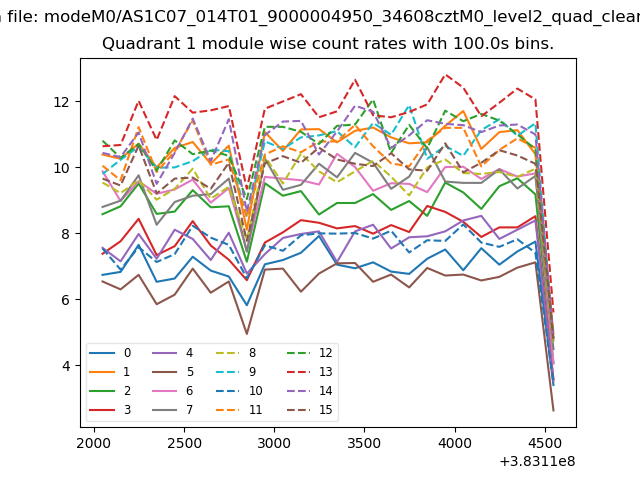
| Module-wise count rates for Quadrant A Data is divided into 100 sec bins |
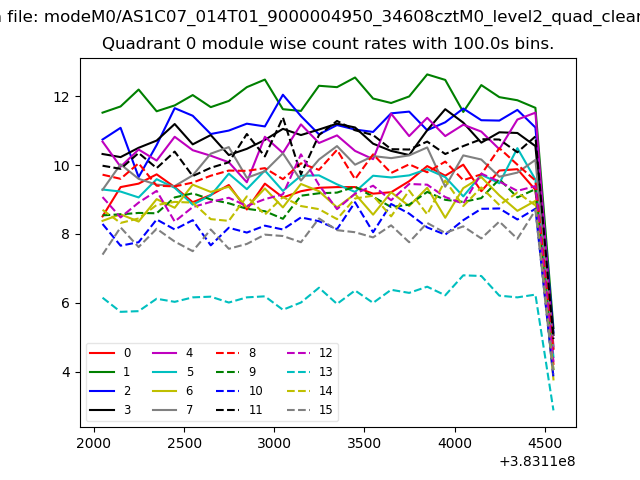 |
 |
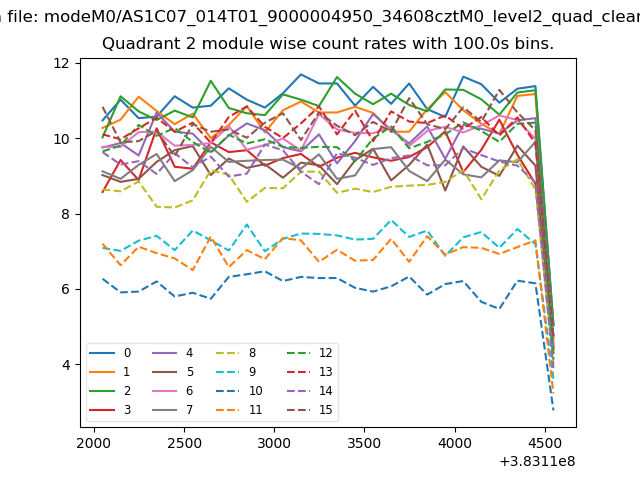
| Module-wise count rates for Quadrant B Data is divided into 100 sec bins |
 |
 |
| Module-wise count rates for Quadrant C Data is divided into 100 sec bins |
 |
 |
| Module-wise count rates for Quadrant D Data is divided into 100 sec bins |
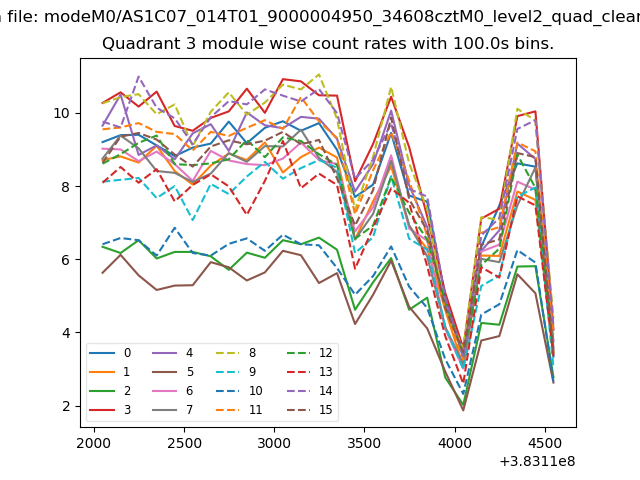 |
 |
| Parameter | Plot |
|---|---|
| CZT HV Monitor | 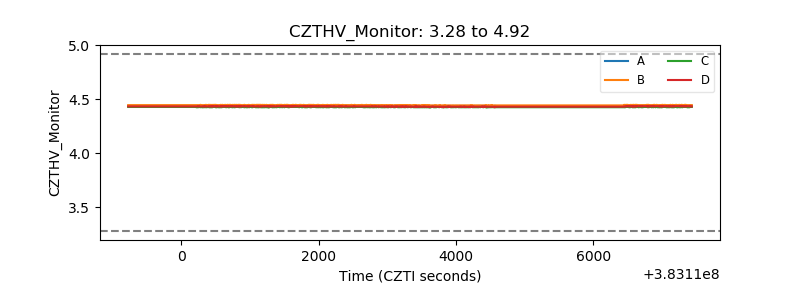 |
| D_VDD | 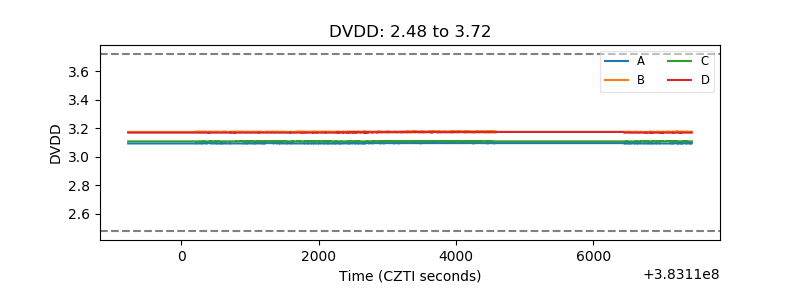 |
| Temperature 1 | 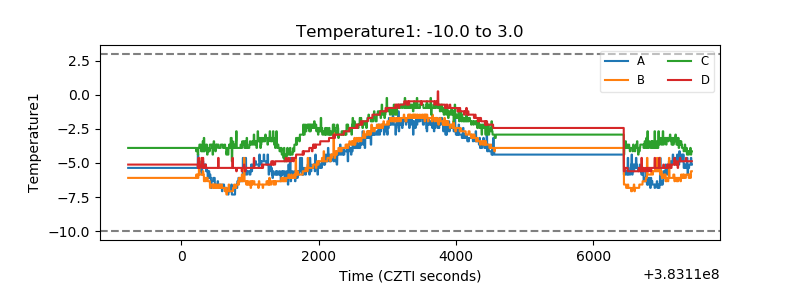 |
| Veto HV Monitor | 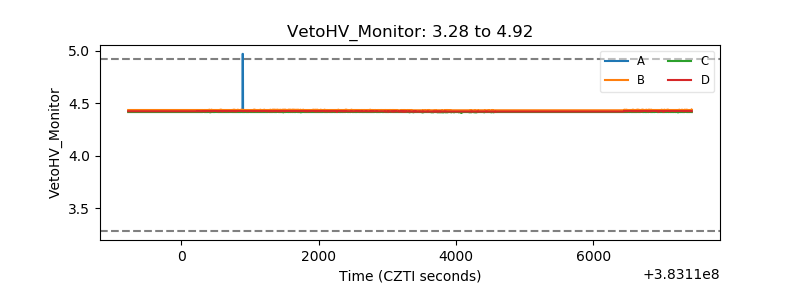 |
| Veto LLD | 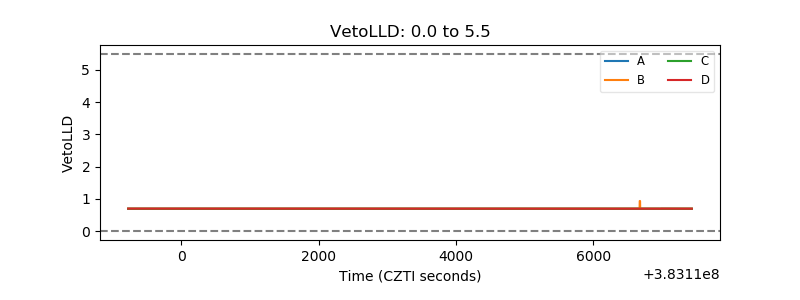 |
| Alpha Counter | 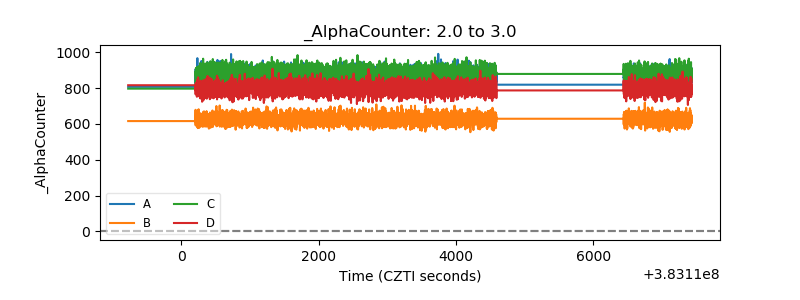 |
| _CPM_Rate | 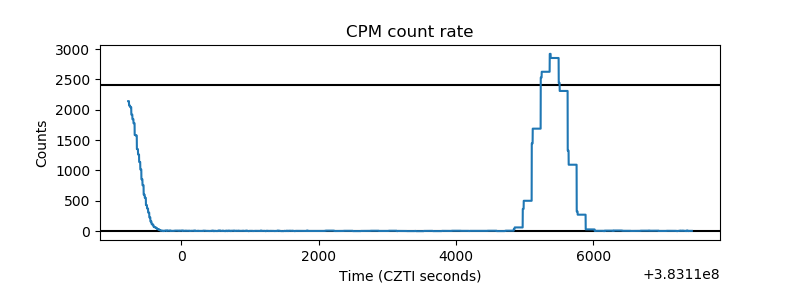 |
| CZT Counter | 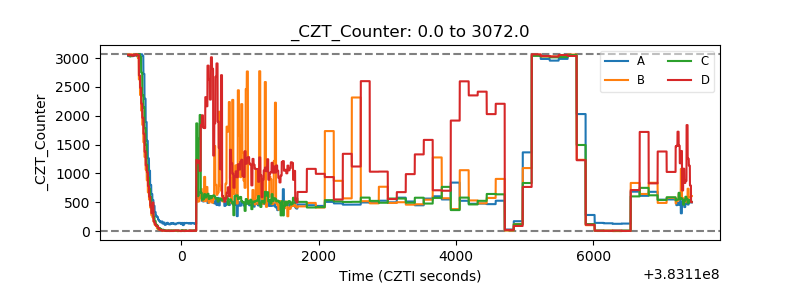 |
| +2.5 Volts monitor | 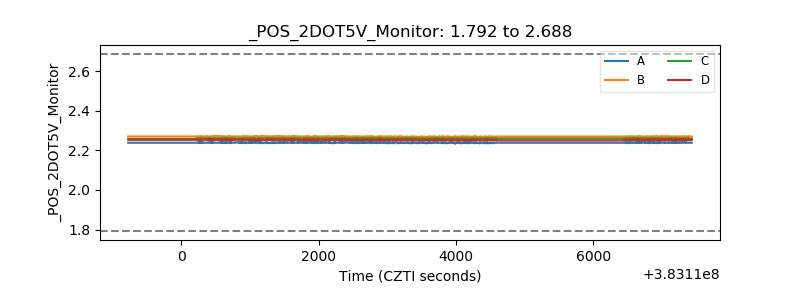 |
| +5 Volts monitor | 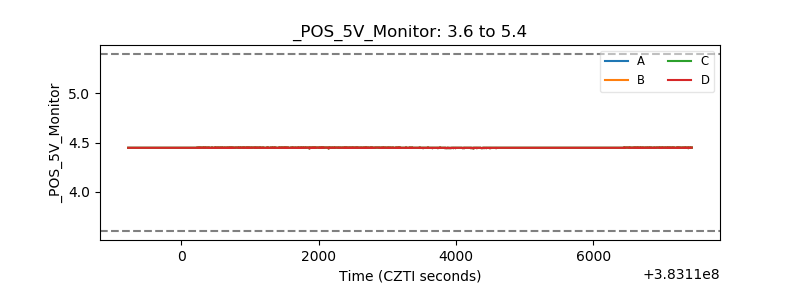 |
| _ROLL_ROT | 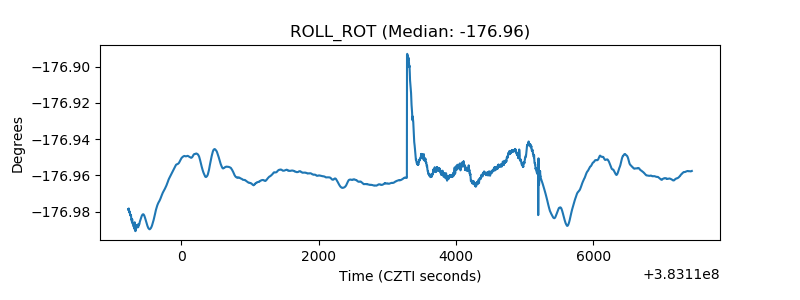 |
| _Roll_DEC | 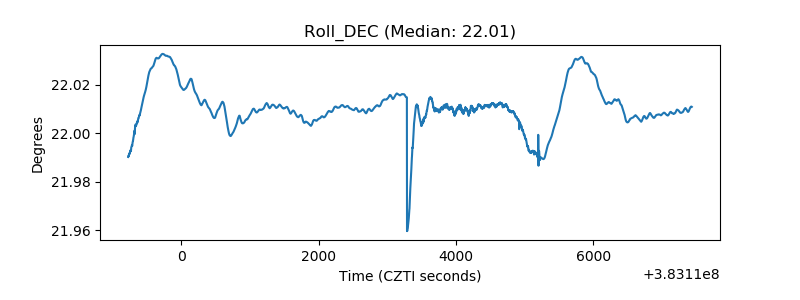 |
| _Roll_RA | 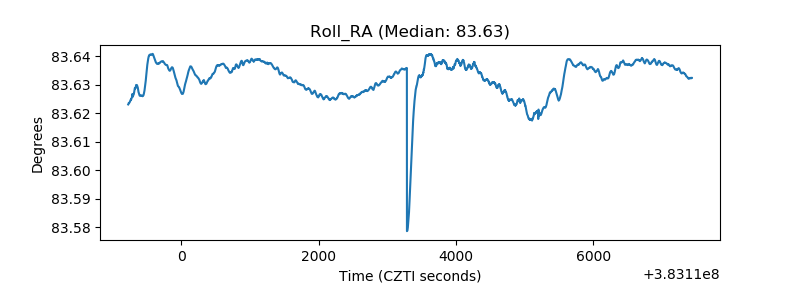 |
| Veto Counter | 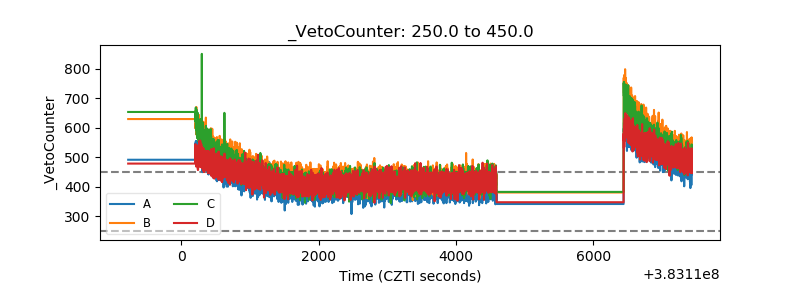 |