| Param | Original file | Final file |
|---|---|---|
| Filename | modeM0/AS1C07_014T01_9000004950_34606cztM0_level2.evt | modeM0/AS1C07_014T01_9000004950_34606cztM0_level2_quad_clean.evt |
| Size (bytes) | 552,853,440 | 55,800,000 |
| Size | 527.2 MB | 53.2 MB |
| Events in quadrant A | 2,630,915 | 338,944 |
| Events in quadrant B | 4,278,822 | 334,612 |
| Events in quadrant C | 3,010,304 | 335,194 |
| Events in quadrant D | 6,457,454 | 302,093 |
| Mode SS | |||
|---|---|---|---|
| Quadrant | BADHDUFLAG | Total packets | Discarded packets |
| A | 0 | 110 | 0 |
| B | 0 | 110 | 0 |
| C | 0 | 110 | 0 |
| D | 0 | 110 | 0 |
| Mode M9 | |||
|---|---|---|---|
| Quadrant | BADHDUFLAG | Total packets | Discarded packets |
| A | 0 | 24 | 0 |
| B | 0 | 24 | 0 |
| C | 0 | 24 | 0 |
| D | 0 | 25 | 0 |
| Mode M0 | |||
|---|---|---|---|
| Quadrant | BADHDUFLAG | Total packets | Discarded packets |
| A | 0 | 11077 | 3 |
| B | 0 | 16048 | 2 |
| C | 0 | 11940 | 2 |
| D | 0 | 23028 | 2 |
| Quadrant | Total seconds | Saturated seconds | Saturation percentage |
|---|---|---|---|
| A | 5404 | 9 | 0.166543% |
| B | 5404 | 551 | 10.196151% |
| C | 5404 | 86 | 1.591414% |
| D | 5404 | 560 | 10.362694% |
Noise dominated data is calculated using 1-second bins in cleaned event files. If a bin has >2000 counts, and if more than 50% of those come from <1% of pixels, then it is considered to be noise-dominated and hence unusable.
| Quadrant | # 1 sec bins | Bins with >0 counts | Bins with >2000 counts | High rate bins dominated by noise | Noise dominated (total time) | Noise dominated (detector-on time) | Marked lightcurve |
|---|---|---|---|---|---|---|---|
| A | 7138 | 5405 | 3 | 3 | 0.04% | 0.06% | 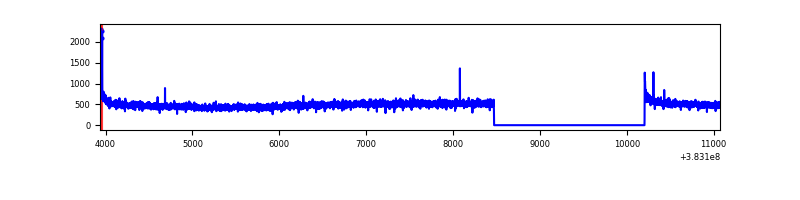 |
| B | 7138 | 5405 | 349 | 349 | 4.89% | 6.46% | 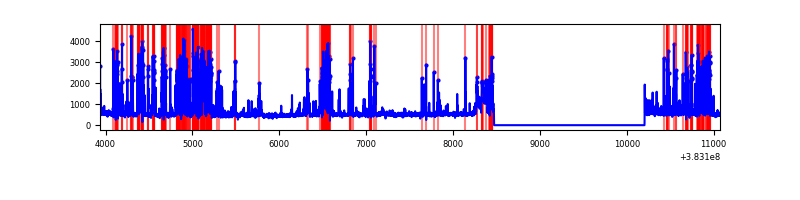 |
| C | 7138 | 5405 | 67 | 67 | 0.94% | 1.24% | 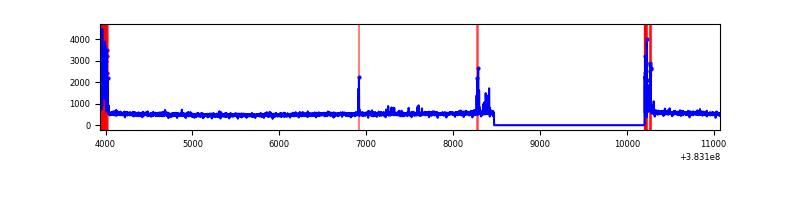 |
| D | 7138 | 5405 | 485 | 485 | 6.79% | 8.97% | 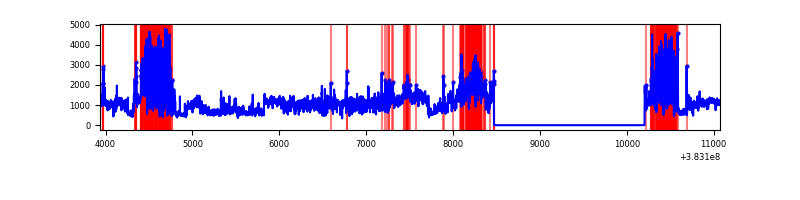 |
Top three noisy pixels from each quadrant. If the there are fewer than three noisy pixels in the level2.evt file, extra rows are filled as -1
| Pixel properties | Quadrant properties | ||||||
|---|---|---|---|---|---|---|---|
| Quadrant | DetID | PixID | Counts | Sigma | Mean | Median | Sigma |
| A | 10 | 83 | 43862 | 319.94 | 664 | 651 | 135.1 |
| A | 9 | 143 | 17836 | 127.24 | 664 | 651 | 135.1 |
| A | 13 | 254 | 9532 | 65.76 | 664 | 651 | 135.1 |
| B | 5 | 172 | 1555173 | 12665.3 | 641 | 626 | 122.7 |
| B | 4 | 170 | 167765 | 1361.73 | 641 | 626 | 122.7 |
| B | 12 | 111 | 14770 | 115.23 | 641 | 626 | 122.7 |
| C | 15 | 214 | 226775 | 1513.35 | 640 | 646 | 149.4 |
| C | 0 | 10 | 222649 | 1485.74 | 640 | 646 | 149.4 |
| C | 0 | 207 | 31851 | 208.84 | 640 | 646 | 149.4 |
| D | 8 | 195 | 2288797 | 14020.21 | 609 | 597 | 163.2 |
| D | 2 | 250 | 1171343 | 7173.37 | 609 | 597 | 163.2 |
| D | 7 | 38 | 330024 | 2018.46 | 609 | 597 | 163.2 |
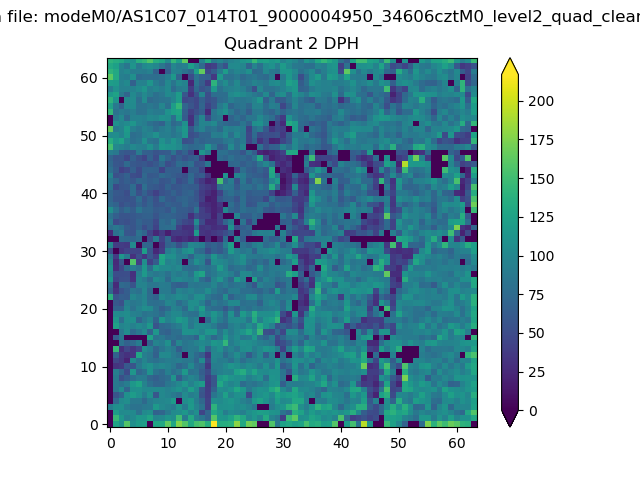
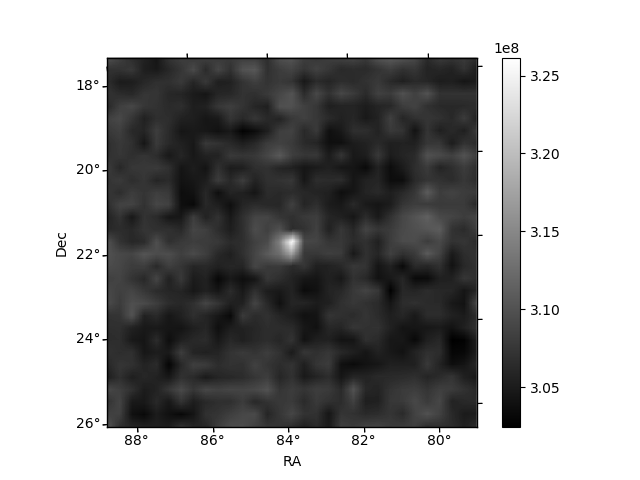
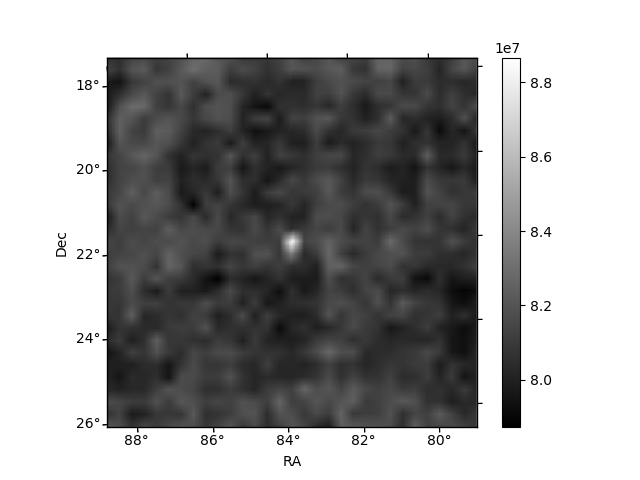
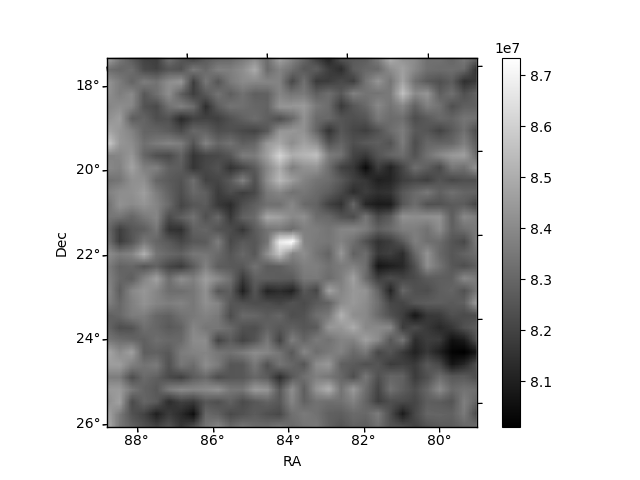
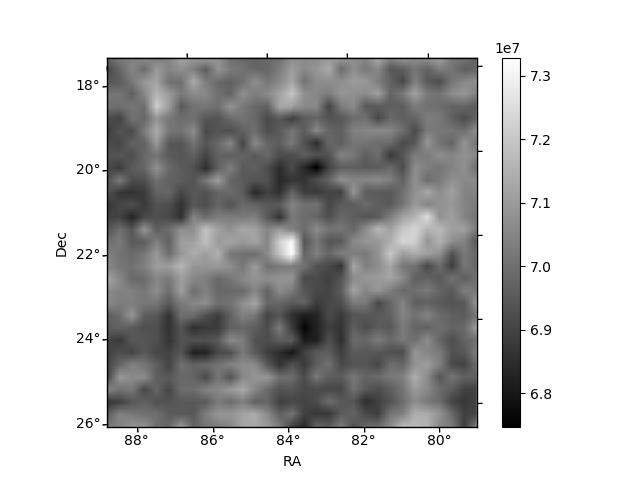
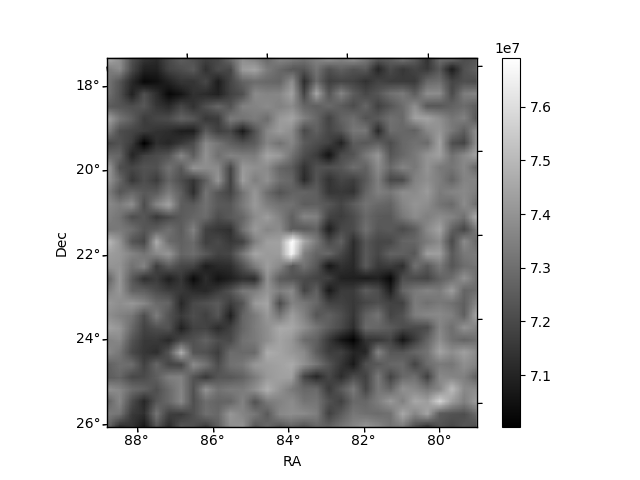
Histogram calculated using DETX and DETY for each event in the final _common_clean file
| Quadrant A | 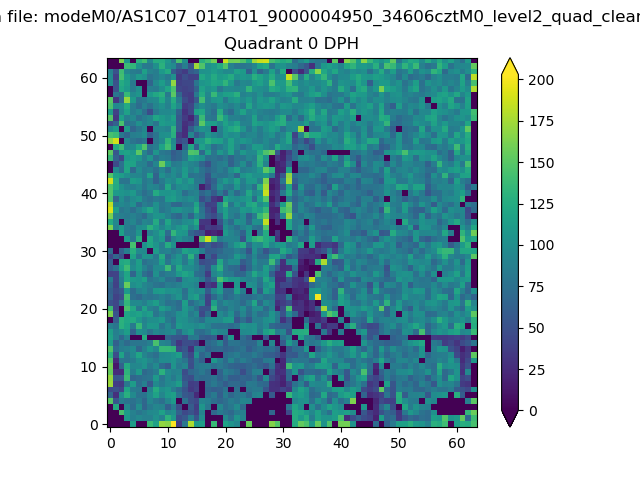 |
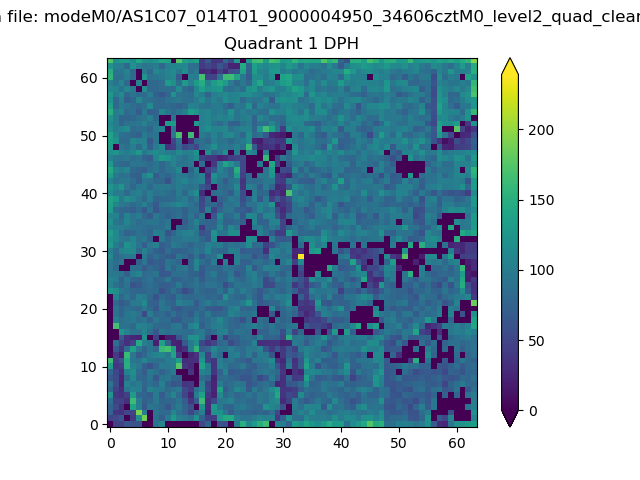 |
Quadrant B |
|---|---|---|---|
| Quadrant D | 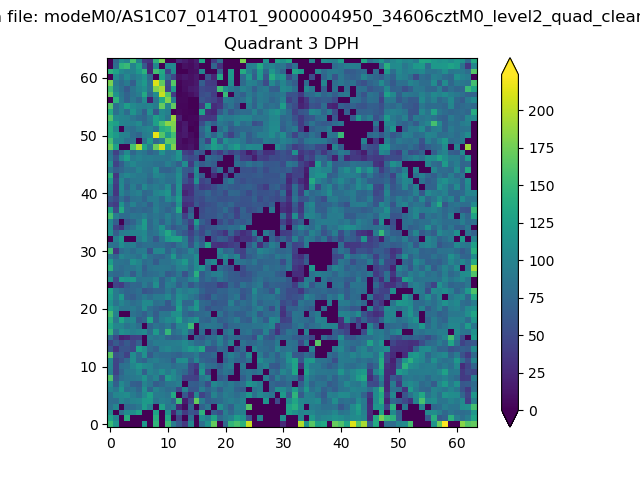 |
 |
Quadrant C |
| Plot type | Count rate plots | Images |
|---|---|---|
| Comparison with Poisson distribution Blue bars denote a histogram of data divided into 1 sec bins. Red curve is a Poisson curve with rate = median count rate of data. |
 |
 |
| Quadrant-wise count rates Data is divided into 100 sec bins |
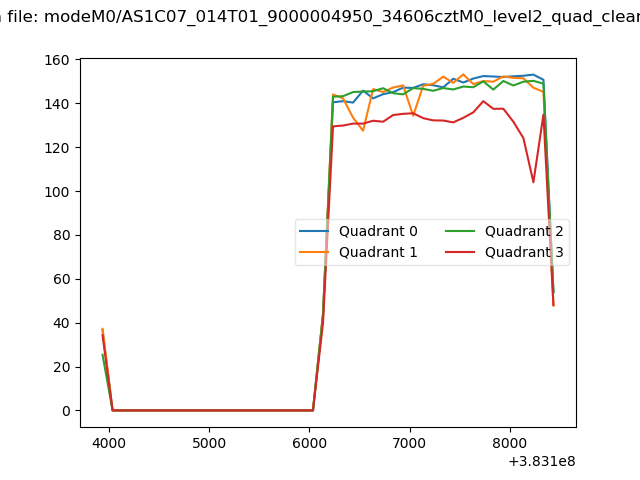 |
|
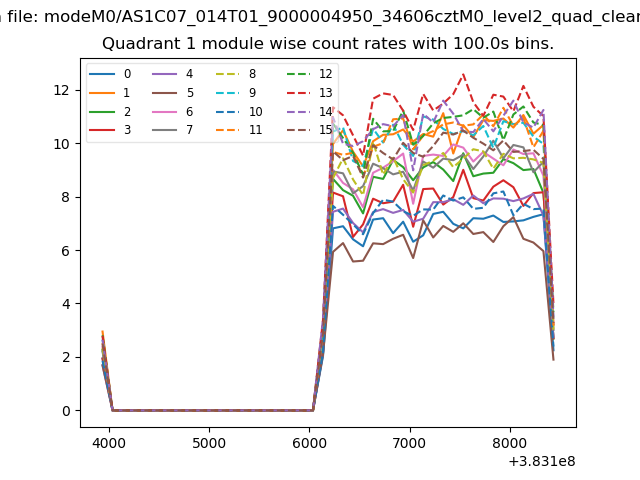
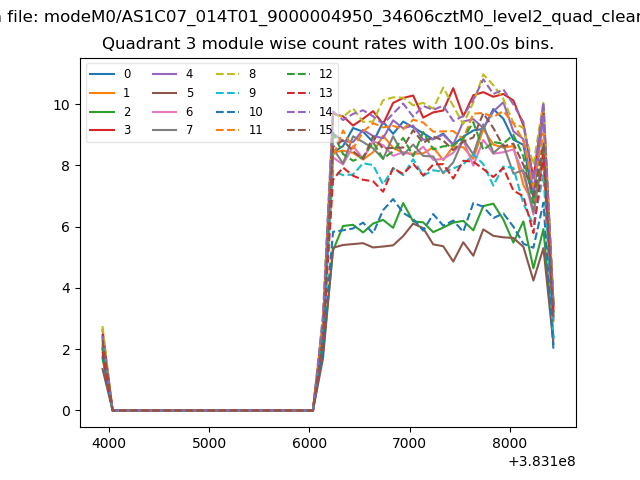
| Module-wise count rates for Quadrant A Data is divided into 100 sec bins |
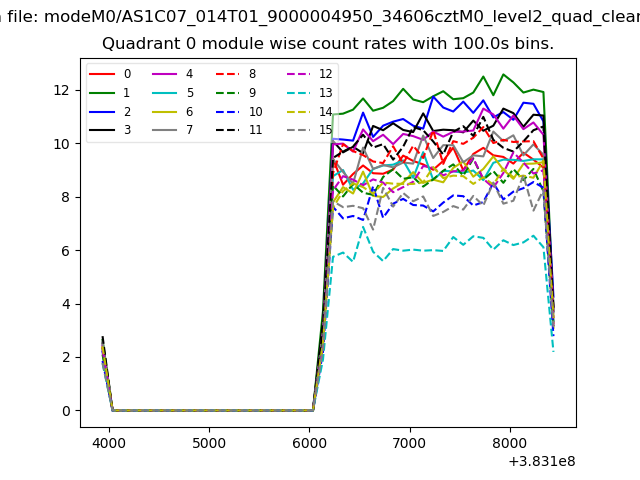 |
 |
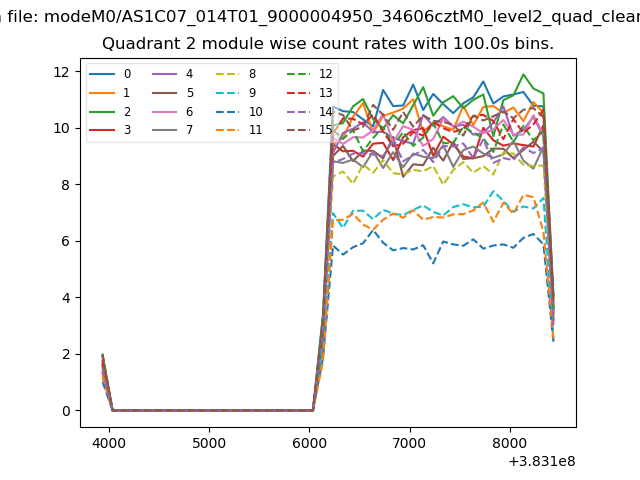
| Module-wise count rates for Quadrant B Data is divided into 100 sec bins |
 |
 |
| Module-wise count rates for Quadrant C Data is divided into 100 sec bins |
 |
 |
| Module-wise count rates for Quadrant D Data is divided into 100 sec bins |
 |
 |
| Parameter | Plot |
|---|---|
| CZT HV Monitor | 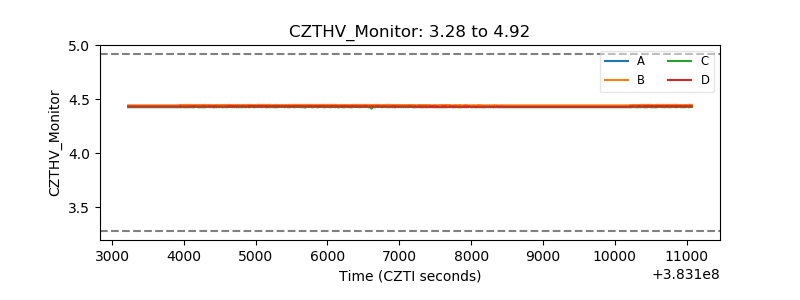 |
| D_VDD | 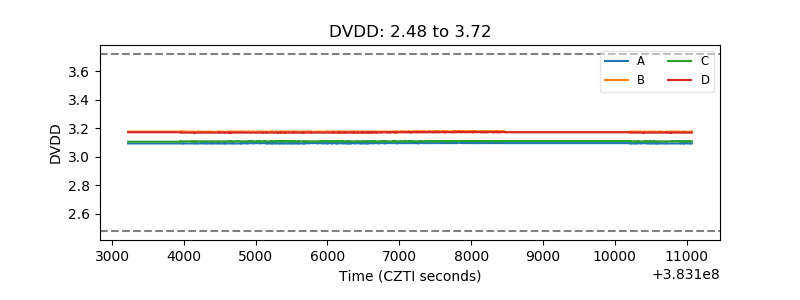 |
| Temperature 1 | 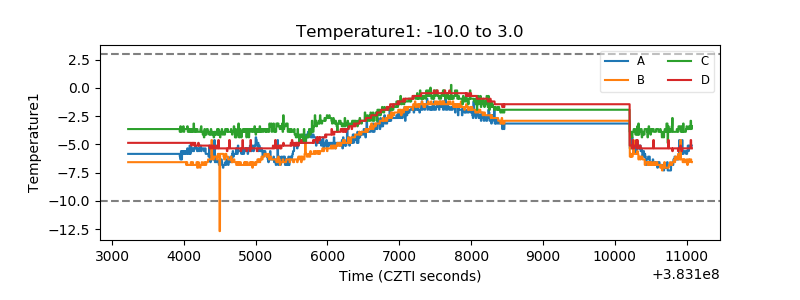 |
| Veto HV Monitor | 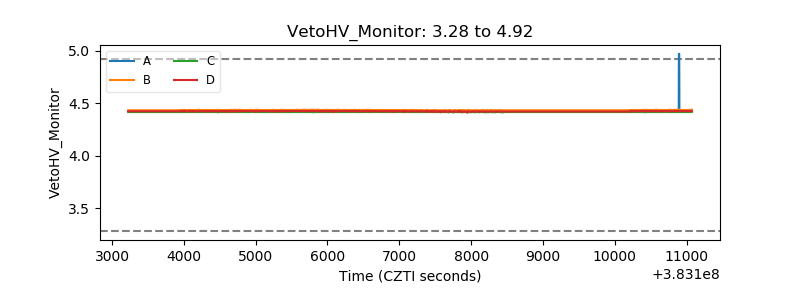 |
| Veto LLD | 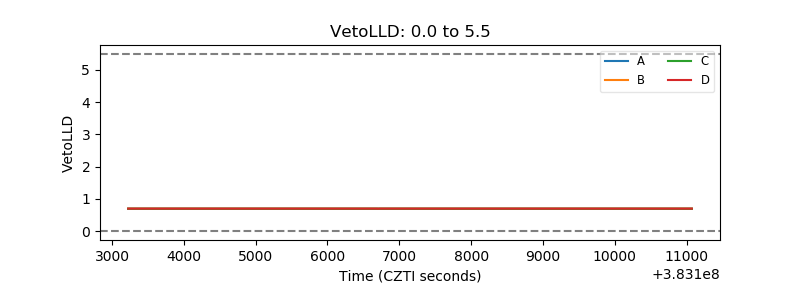 |
| Alpha Counter | 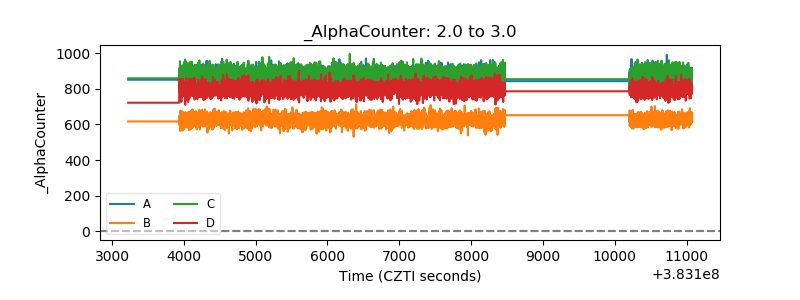 |
| _CPM_Rate | 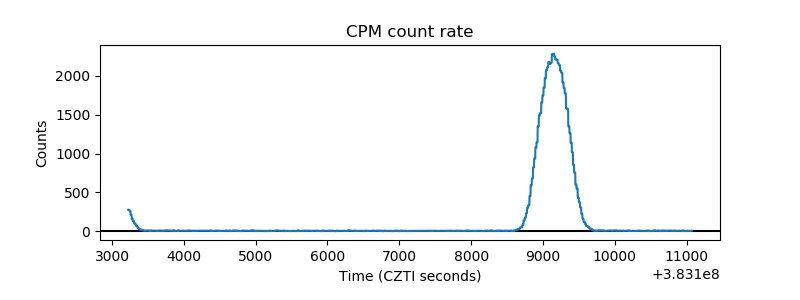 |
| CZT Counter | 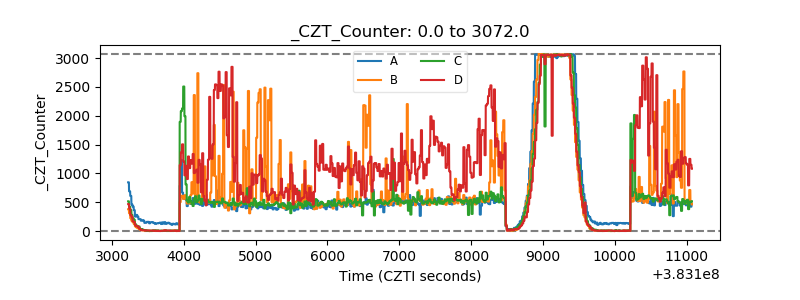 |
| +2.5 Volts monitor | 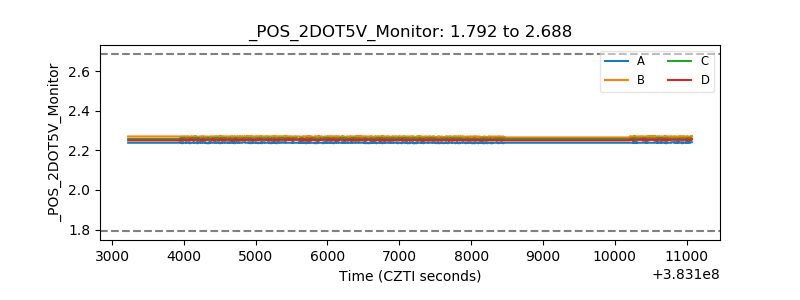 |
| +5 Volts monitor | 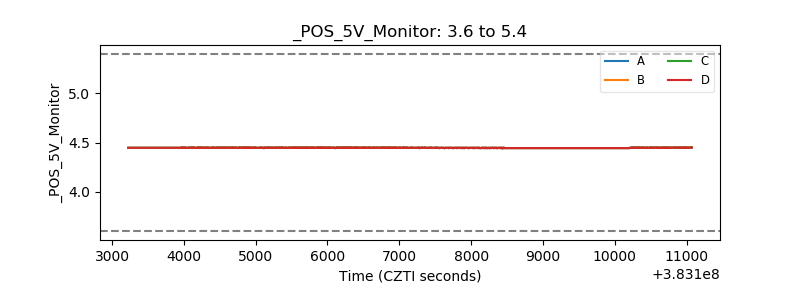 |
| _ROLL_ROT | 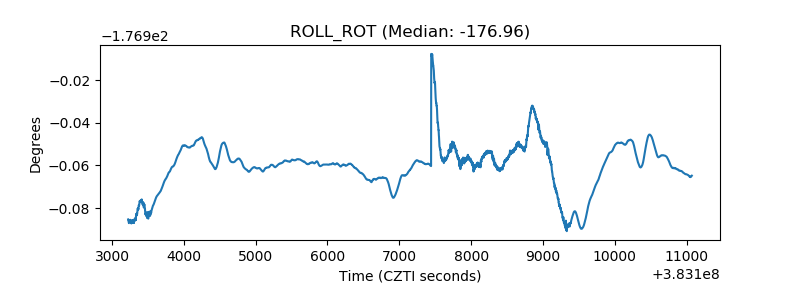 |
| _Roll_DEC | 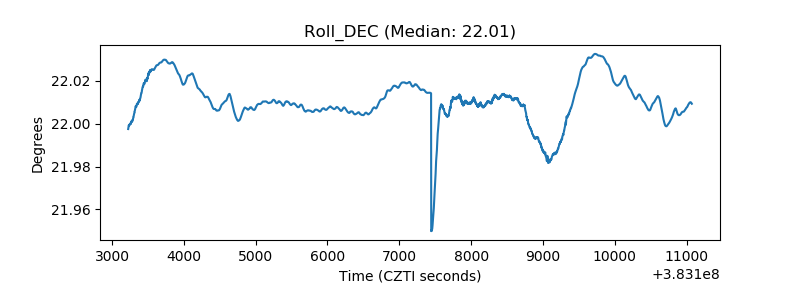 |
| _Roll_RA | 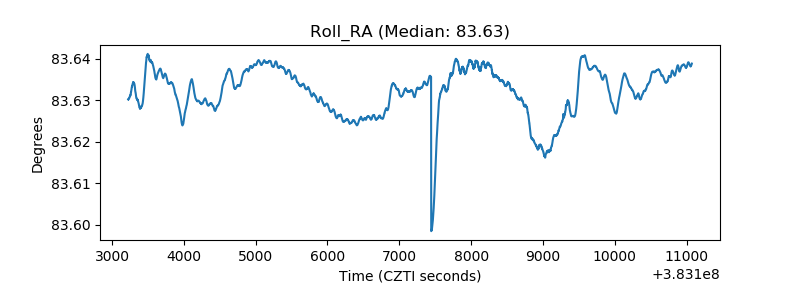 |
| Veto Counter | 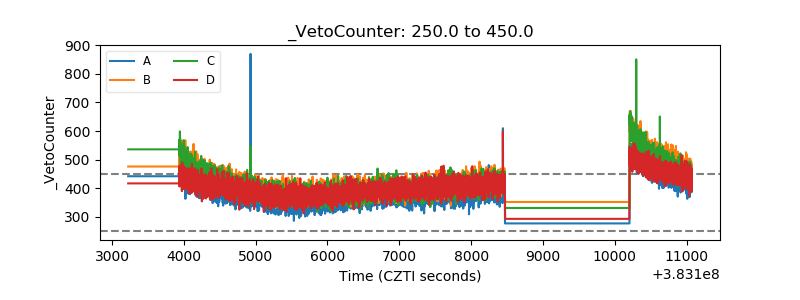 |