| Param | Original file | Final file |
|---|---|---|
| Filename | modeM0/AS1C07_014T01_9000004950_34605cztM0_level2.evt | modeM0/AS1C07_014T01_9000004950_34605cztM0_level2_quad_clean.evt |
| Size (bytes) | 562,734,720 | 57,591,360 |
| Size | 536.7 MB | 54.9 MB |
| Events in quadrant A | 2,720,341 | 358,843 |
| Events in quadrant B | 4,605,336 | 331,187 |
| Events in quadrant C | 3,060,990 | 352,809 |
| Events in quadrant D | 6,273,823 | 305,632 |
| Mode SS | |||
|---|---|---|---|
| Quadrant | BADHDUFLAG | Total packets | Discarded packets |
| A | 0 | 114 | 0 |
| B | 0 | 114 | 0 |
| C | 0 | 114 | 0 |
| D | 0 | 114 | 0 |
| Mode M9 | |||
|---|---|---|---|
| Quadrant | BADHDUFLAG | Total packets | Discarded packets |
| A | 0 | 26 | 0 |
| B | 0 | 26 | 0 |
| C | 0 | 26 | 0 |
| D | 0 | 27 | 0 |
| Mode M0 | |||
|---|---|---|---|
| Quadrant | BADHDUFLAG | Total packets | Discarded packets |
| A | 0 | 11638 | 3 |
| B | 0 | 17290 | 2 |
| C | 0 | 12214 | 2 |
| D | 0 | 22494 | 2 |
| Quadrant | Total seconds | Saturated seconds | Saturation percentage |
|---|---|---|---|
| A | 5648 | 15 | 0.265581% |
| B | 5648 | 668 | 11.827195% |
| C | 5648 | 86 | 1.522663% |
| D | 5648 | 628 | 11.118980% |
Noise dominated data is calculated using 1-second bins in cleaned event files. If a bin has >2000 counts, and if more than 50% of those come from <1% of pixels, then it is considered to be noise-dominated and hence unusable.
| Quadrant | # 1 sec bins | Bins with >0 counts | Bins with >2000 counts | High rate bins dominated by noise | Noise dominated (total time) | Noise dominated (detector-on time) | Marked lightcurve |
|---|---|---|---|---|---|---|---|
| A | 7261 | 5649 | 6 | 6 | 0.08% | 0.11% | 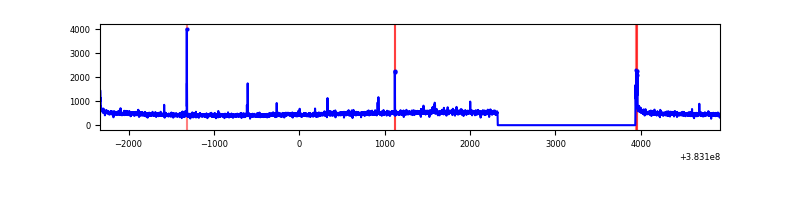 |
| B | 7261 | 5649 | 473 | 473 | 6.51% | 8.37% | 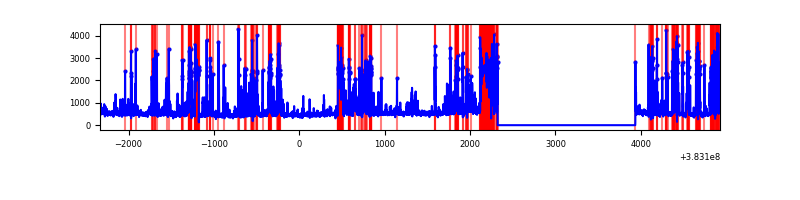 |
| C | 7261 | 5649 | 67 | 67 | 0.92% | 1.19% | 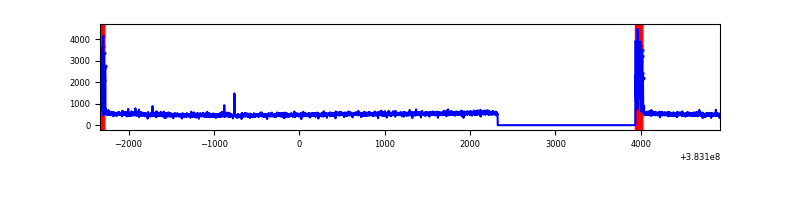 |
| D | 7261 | 5649 | 516 | 516 | 7.11% | 9.13% | 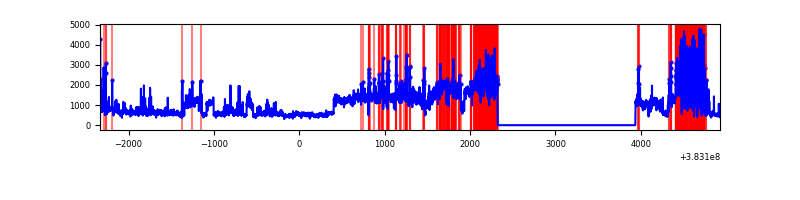 |
Top three noisy pixels from each quadrant. If the there are fewer than three noisy pixels in the level2.evt file, extra rows are filled as -1
| Pixel properties | Quadrant properties | ||||||
|---|---|---|---|---|---|---|---|
| Quadrant | DetID | PixID | Counts | Sigma | Mean | Median | Sigma |
| A | 10 | 83 | 43561 | 314.59 | 677 | 664 | 136.4 |
| A | 9 | 143 | 42267 | 305.1 | 677 | 664 | 136.4 |
| A | 13 | 254 | 9593 | 65.48 | 677 | 664 | 136.4 |
| B | 5 | 172 | 1832903 | 14901.01 | 638 | 622 | 123.0 |
| B | 0 | 189 | 50378 | 404.64 | 638 | 622 | 123.0 |
| B | 5 | 255 | 45256 | 362.99 | 638 | 622 | 123.0 |
| C | 15 | 214 | 236723 | 1537.45 | 656 | 665 | 153.5 |
| C | 0 | 10 | 220777 | 1433.6 | 656 | 665 | 153.5 |
| C | 14 | 67 | 29035 | 184.77 | 656 | 665 | 153.5 |
| D | 8 | 195 | 2497773 | 15526.89 | 629 | 614 | 160.8 |
| D | 2 | 250 | 608099 | 3777.23 | 629 | 614 | 160.8 |
| D | 7 | 223 | 225240 | 1396.68 | 629 | 614 | 160.8 |
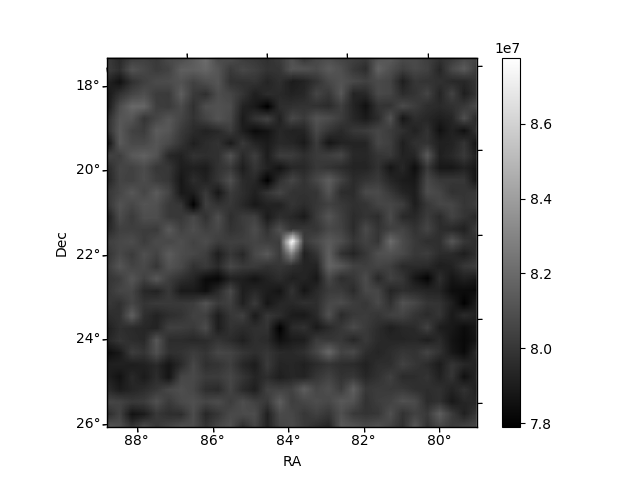
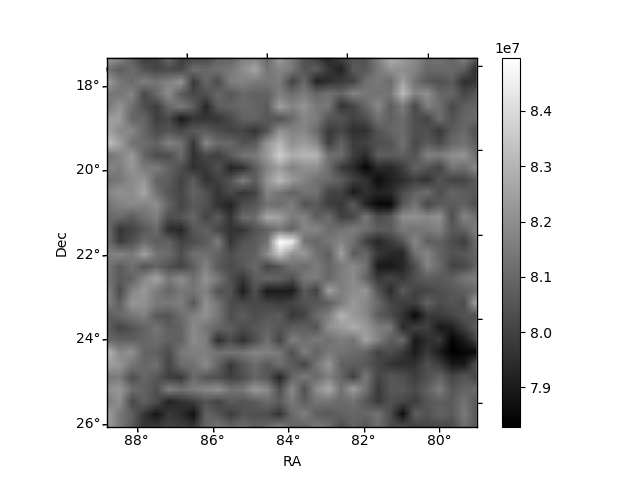
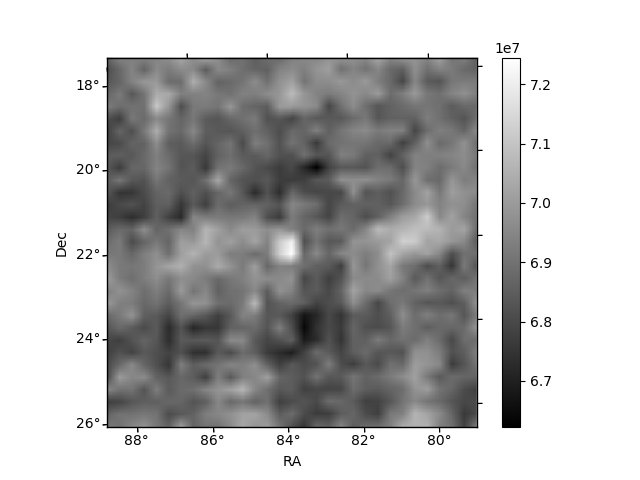
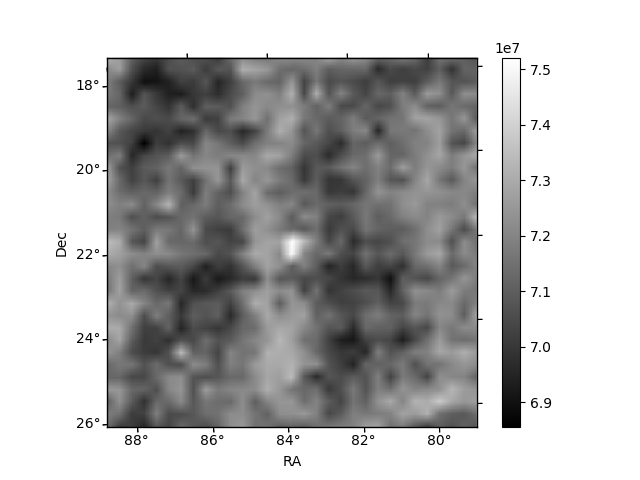
Histogram calculated using DETX and DETY for each event in the final _common_clean file
| Quadrant A | 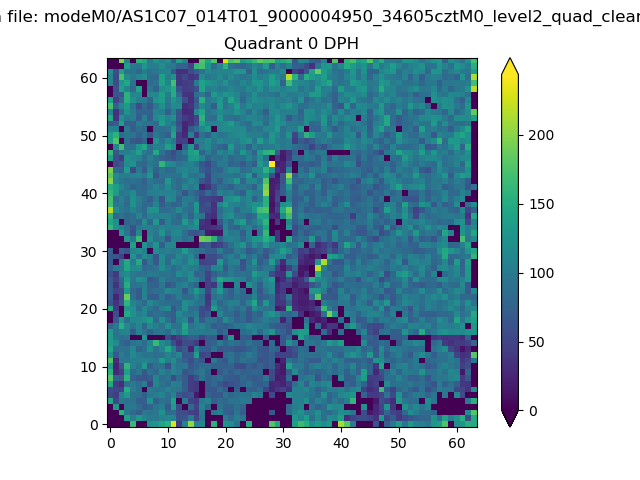 |
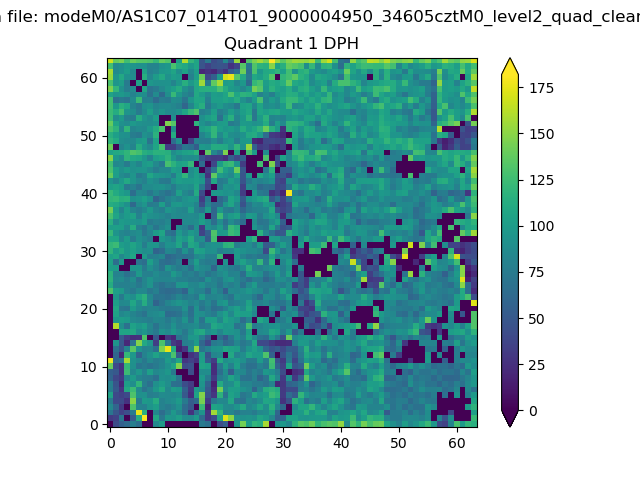 |
Quadrant B |
|---|---|---|---|
| Quadrant D | 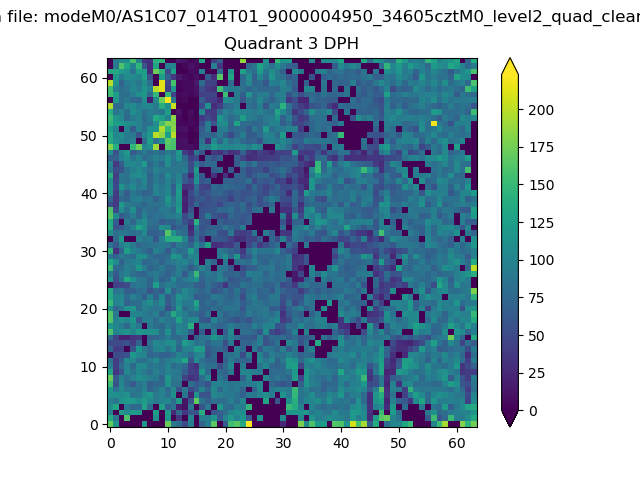 |
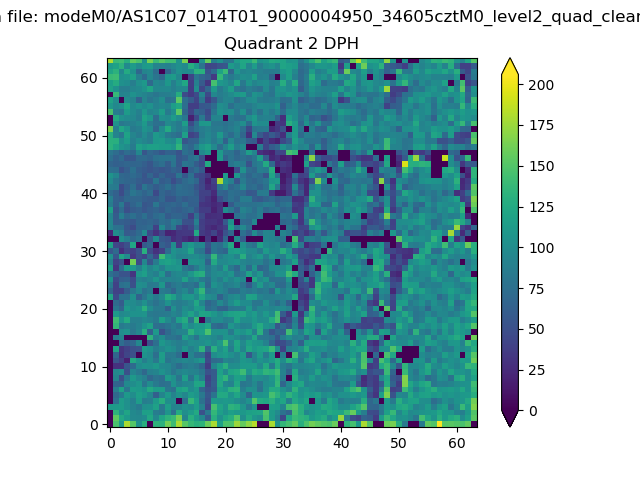 |
Quadrant C |
| Plot type | Count rate plots | Images |
|---|---|---|
| Comparison with Poisson distribution Blue bars denote a histogram of data divided into 1 sec bins. Red curve is a Poisson curve with rate = median count rate of data. |
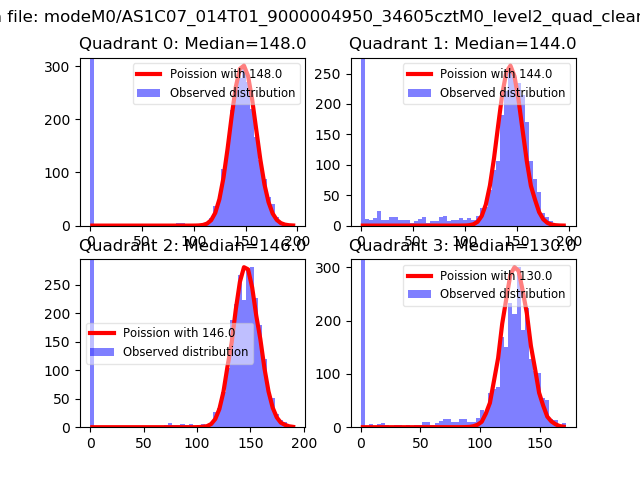 |
 |
| Quadrant-wise count rates Data is divided into 100 sec bins |
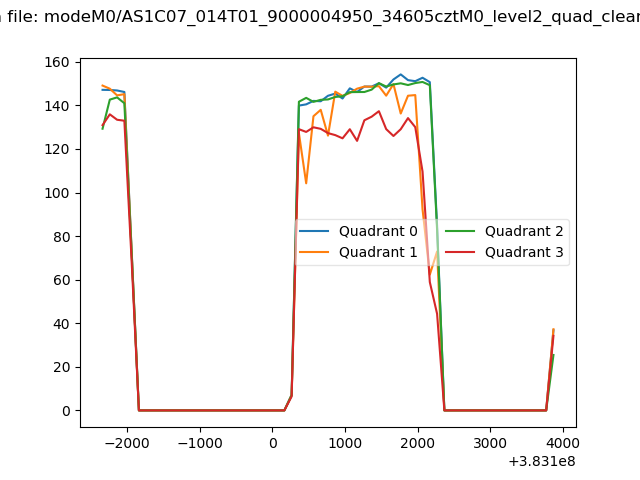 |
|
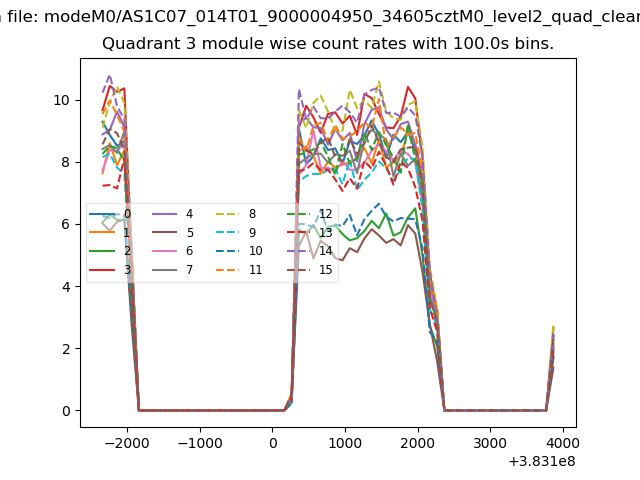
| Module-wise count rates for Quadrant A Data is divided into 100 sec bins |
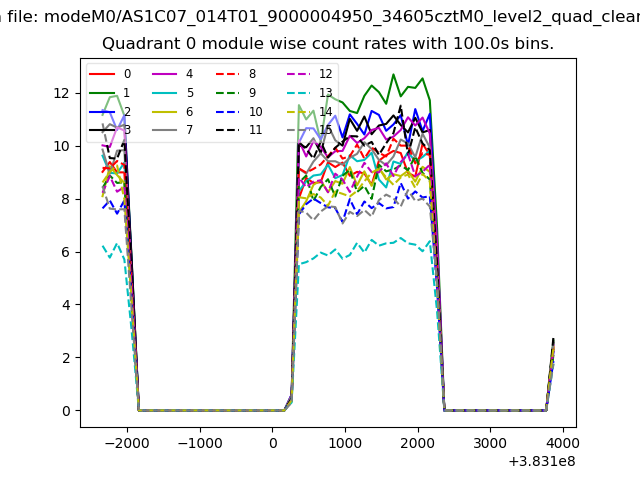 |
 |
| Module-wise count rates for Quadrant B Data is divided into 100 sec bins |
 |
 |
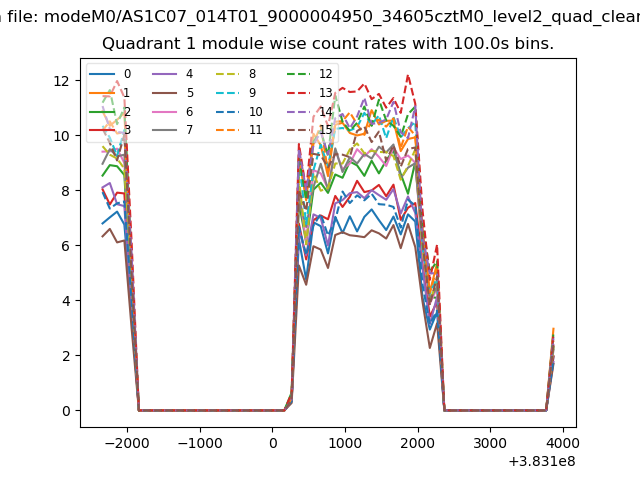
| Module-wise count rates for Quadrant C Data is divided into 100 sec bins |
 |
 |
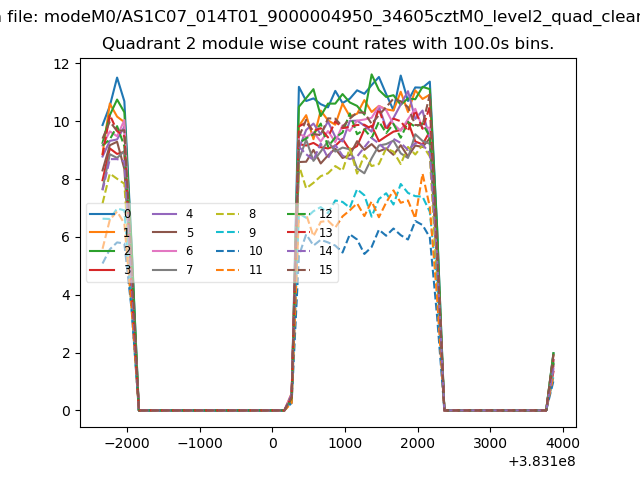
| Module-wise count rates for Quadrant D Data is divided into 100 sec bins |
 |
 |
| Parameter | Plot |
|---|---|
| CZT HV Monitor | 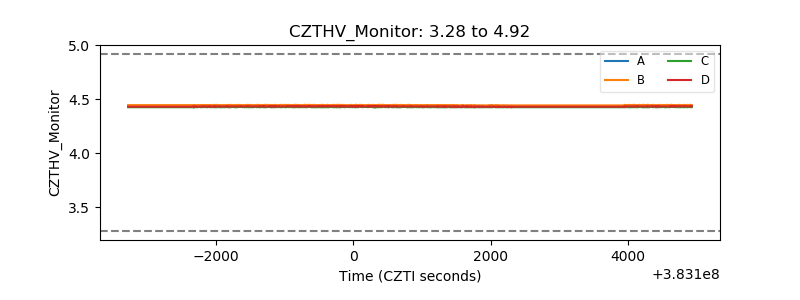 |
| D_VDD | 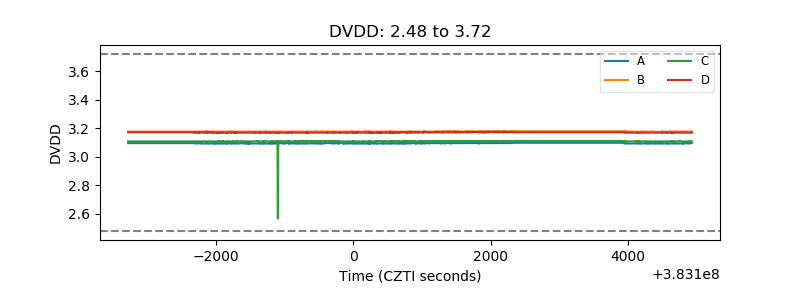 |
| Temperature 1 | 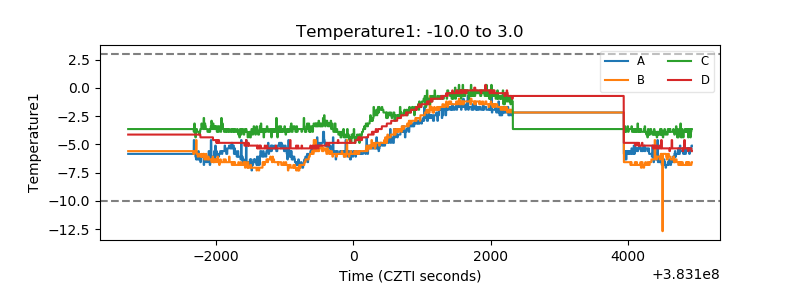 |
| Veto HV Monitor |  |
| Veto LLD | 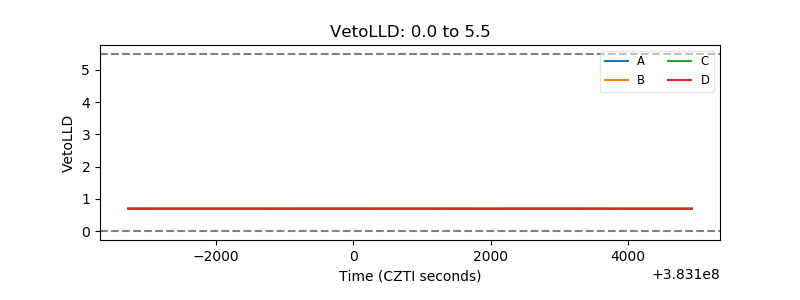 |
| Alpha Counter | 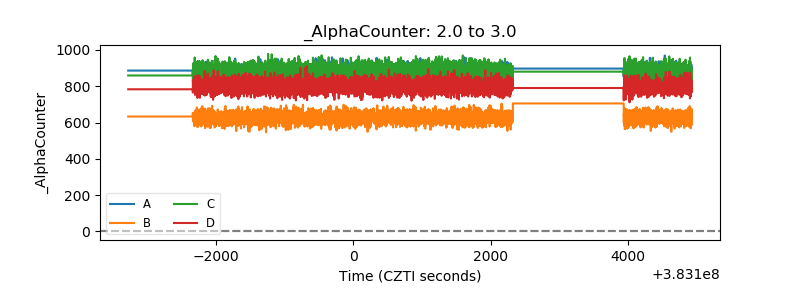 |
| _CPM_Rate | 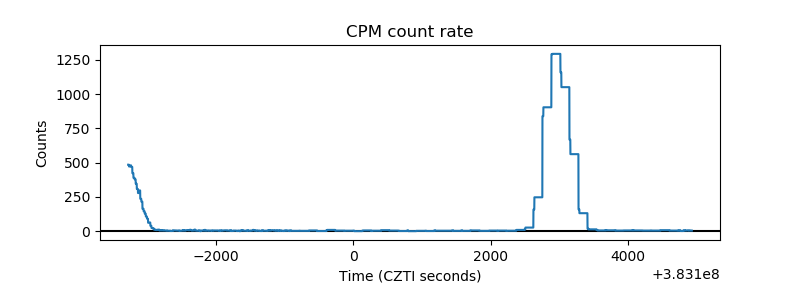 |
| CZT Counter | 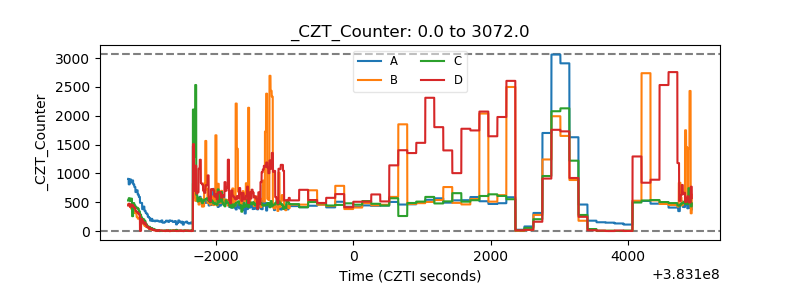 |
| +2.5 Volts monitor | 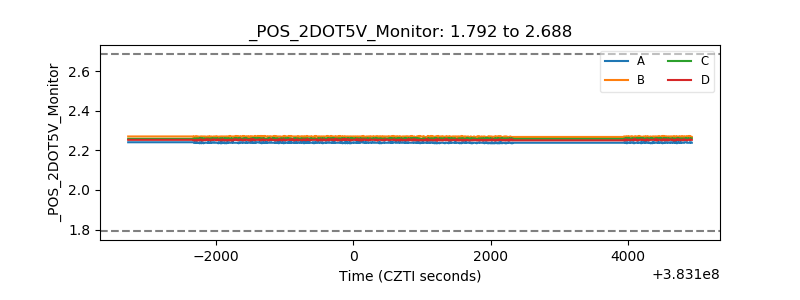 |
| +5 Volts monitor | 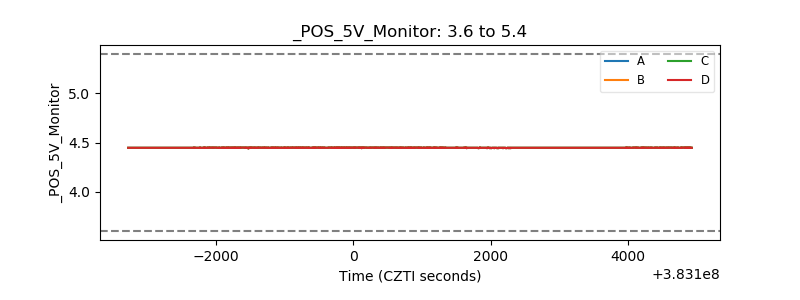 |
| _ROLL_ROT | 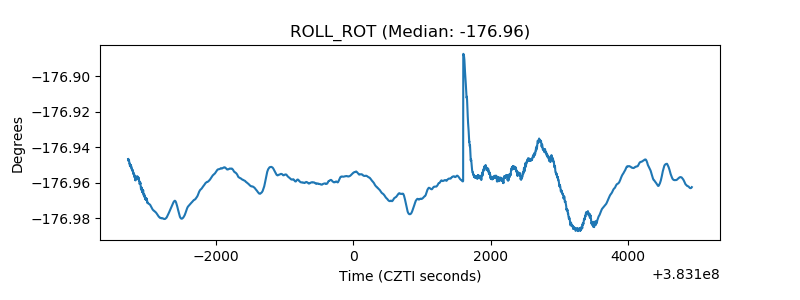 |
| _Roll_DEC | 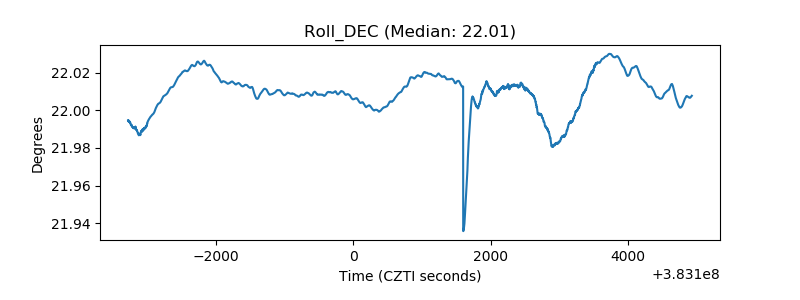 |
| _Roll_RA | 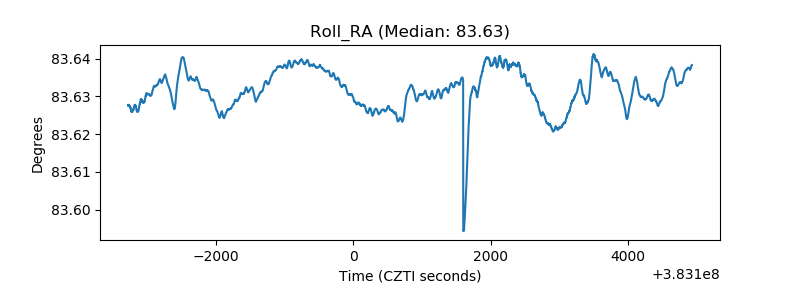 |
| Veto Counter | 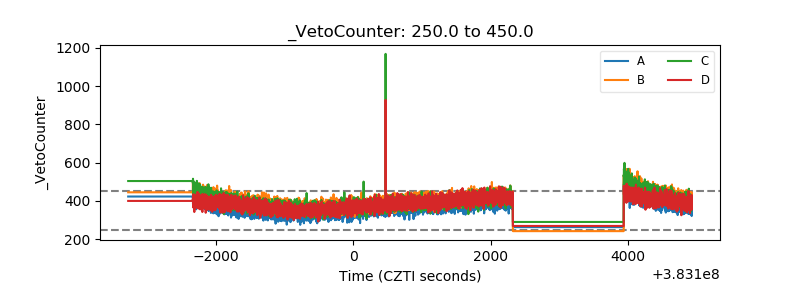 |