| Param | Original file | Final file |
|---|---|---|
| Filename | modeM0/AS1C07_014T01_9000004950_34601cztM0_level2.evt | modeM0/AS1C07_014T01_9000004950_34601cztM0_level2_quad_clean.evt |
| Size (bytes) | 573,995,520 | 75,355,200 |
| Size | 547.4 MB | 71.9 MB |
| Events in quadrant A | 3,079,627 | 490,457 |
| Events in quadrant B | 4,178,409 | 488,377 |
| Events in quadrant C | 2,987,203 | 485,357 |
| Events in quadrant D | 6,750,968 | 417,101 |
| Mode SS | |||
|---|---|---|---|
| Quadrant | BADHDUFLAG | Total packets | Discarded packets |
| A | 0 | 116 | 0 |
| B | 0 | 116 | 0 |
| C | 0 | 116 | 0 |
| D | 0 | 116 | 0 |
| Mode M9 | |||
|---|---|---|---|
| Quadrant | BADHDUFLAG | Total packets | Discarded packets |
| A | 0 | 13 | 0 |
| B | 0 | 13 | 0 |
| C | 0 | 13 | 0 |
| D | 0 | 13 | 0 |
| Mode M0 | |||
|---|---|---|---|
| Quadrant | BADHDUFLAG | Total packets | Discarded packets |
| A | 0 | 12859 | 2 |
| B | 0 | 16130 | 1 |
| C | 0 | 12224 | 1 |
| D | 0 | 24248 | 1 |
| Quadrant | Total seconds | Saturated seconds | Saturation percentage |
|---|---|---|---|
| A | 5725 | 115 | 2.008734% |
| B | 5725 | 377 | 6.585153% |
| C | 5725 | 39 | 0.681223% |
| D | 5725 | 783 | 13.676856% |
Noise dominated data is calculated using 1-second bins in cleaned event files. If a bin has >2000 counts, and if more than 50% of those come from <1% of pixels, then it is considered to be noise-dominated and hence unusable.
| Quadrant | # 1 sec bins | Bins with >0 counts | Bins with >2000 counts | High rate bins dominated by noise | Noise dominated (total time) | Noise dominated (detector-on time) | Marked lightcurve |
|---|---|---|---|---|---|---|---|
| A | 7038 | 5726 | 87 | 87 | 1.24% | 1.52% | 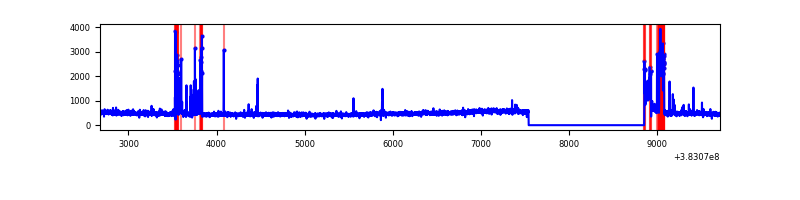 |
| B | 7038 | 5726 | 233 | 233 | 3.31% | 4.07% | 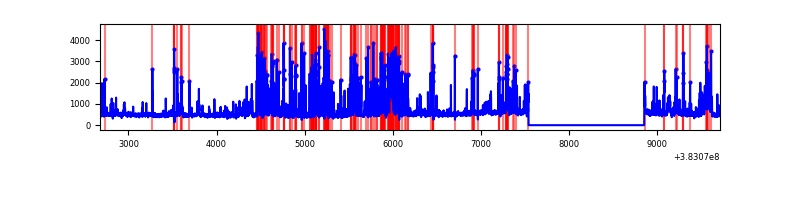 |
| C | 7038 | 5726 | 23 | 23 | 0.33% | 0.40% | 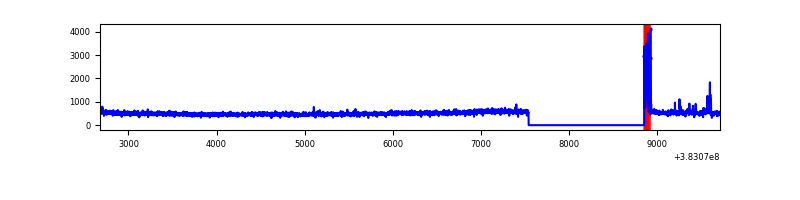 |
| D | 7038 | 5726 | 752 | 752 | 10.68% | 13.13% | 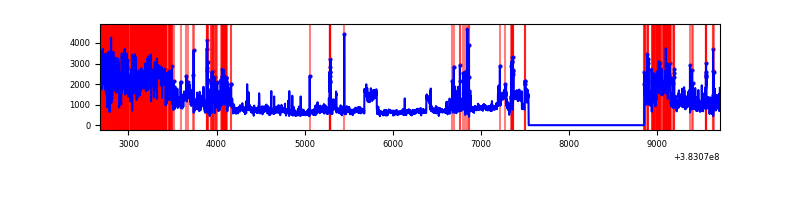 |
Top three noisy pixels from each quadrant. If the there are fewer than three noisy pixels in the level2.evt file, extra rows are filled as -1
| Pixel properties | Quadrant properties | ||||||
|---|---|---|---|---|---|---|---|
| Quadrant | DetID | PixID | Counts | Sigma | Mean | Median | Sigma |
| A | 15 | 169 | 379289 | 2752.85 | 679 | 668 | 137.5 |
| A | 10 | 83 | 35053 | 250.0 | 679 | 668 | 137.5 |
| A | 9 | 143 | 21511 | 151.54 | 679 | 668 | 137.5 |
| B | 5 | 172 | 1068411 | 8333.46 | 665 | 650 | 128.1 |
| B | 4 | 171 | 137320 | 1066.66 | 665 | 650 | 128.1 |
| B | 0 | 189 | 110884 | 860.33 | 665 | 650 | 128.1 |
| C | 15 | 214 | 237920 | 1522.23 | 664 | 670 | 155.9 |
| C | 0 | 10 | 92256 | 587.63 | 664 | 670 | 155.9 |
| C | 0 | 207 | 39683 | 250.31 | 664 | 670 | 155.9 |
| D | 8 | 195 | 2626390 | 15678.63 | 630 | 616 | 167.5 |
| D | 13 | 249 | 475402 | 2834.97 | 630 | 616 | 167.5 |
| D | 14 | 52 | 455377 | 2715.4 | 630 | 616 | 167.5 |
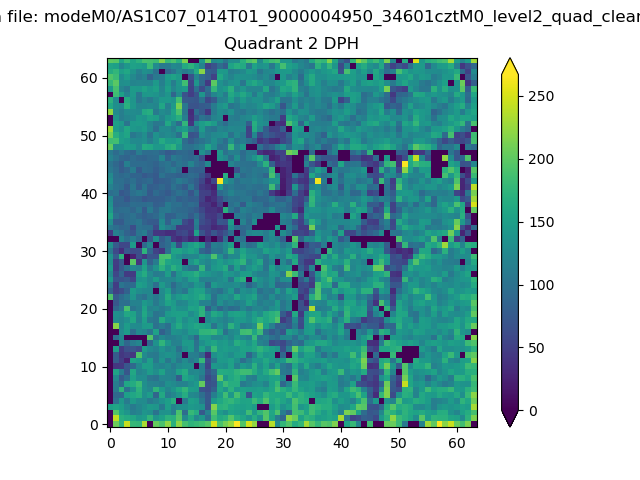
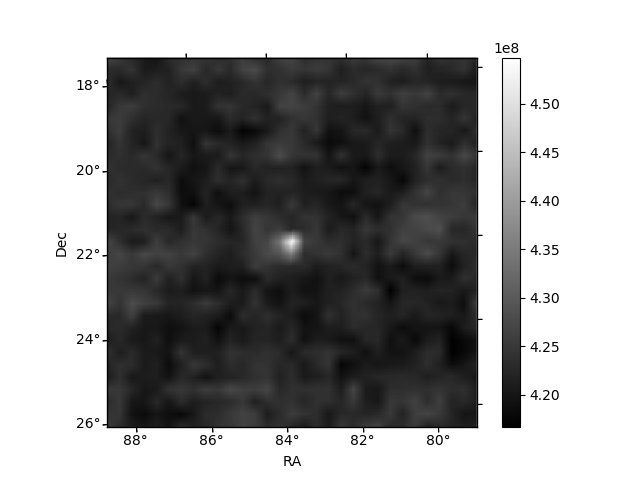
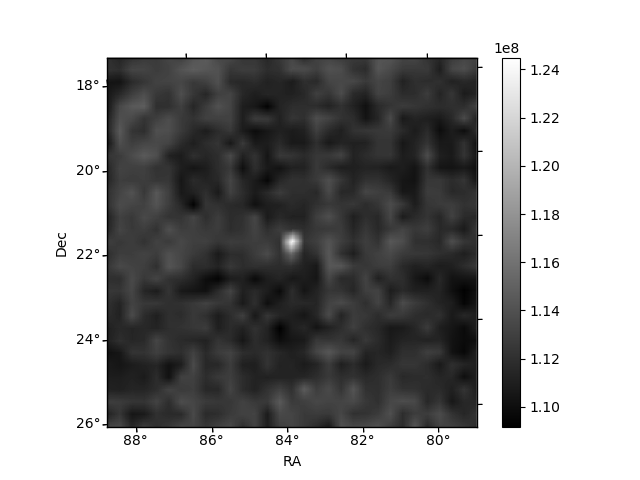
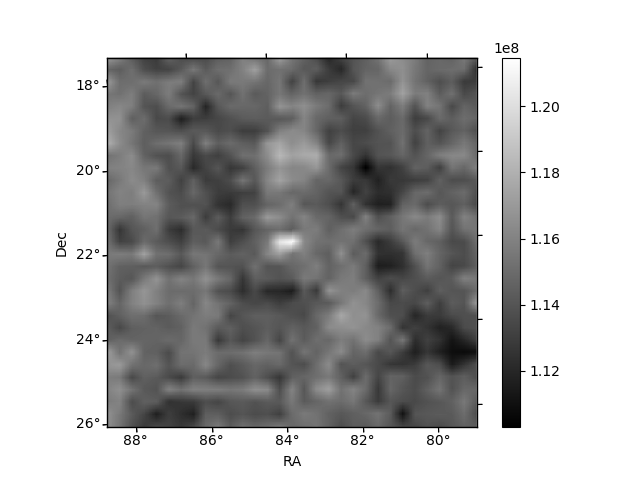
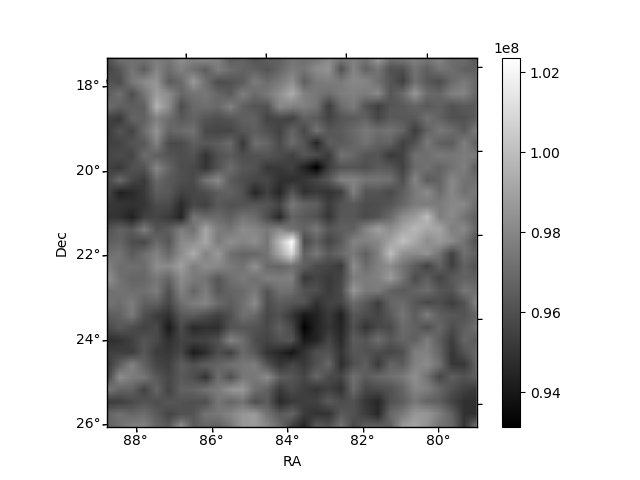
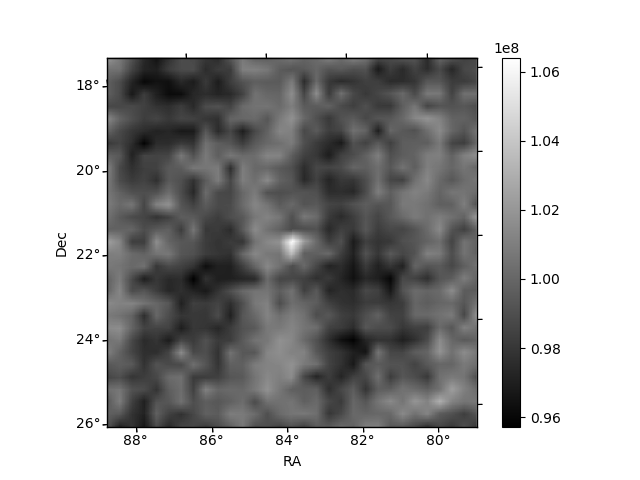
Histogram calculated using DETX and DETY for each event in the final _common_clean file
| Quadrant A | 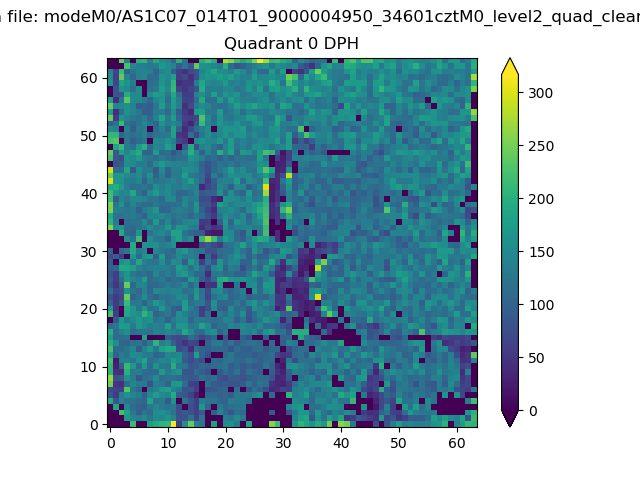 |
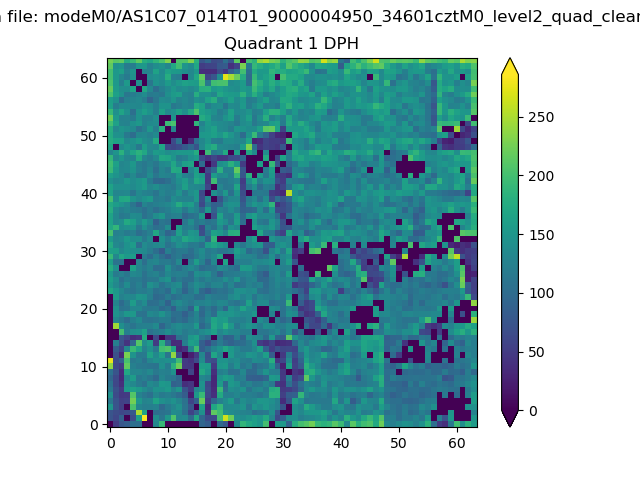 |
Quadrant B |
|---|---|---|---|
| Quadrant D | 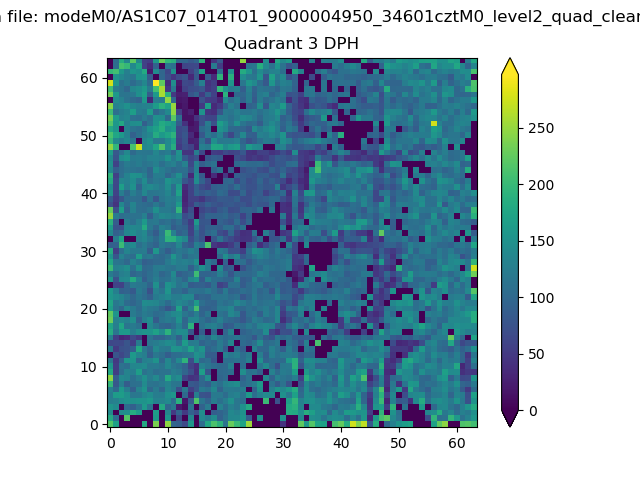 |
 |
Quadrant C |
| Plot type | Count rate plots | Images |
|---|---|---|
| Comparison with Poisson distribution Blue bars denote a histogram of data divided into 1 sec bins. Red curve is a Poisson curve with rate = median count rate of data. |
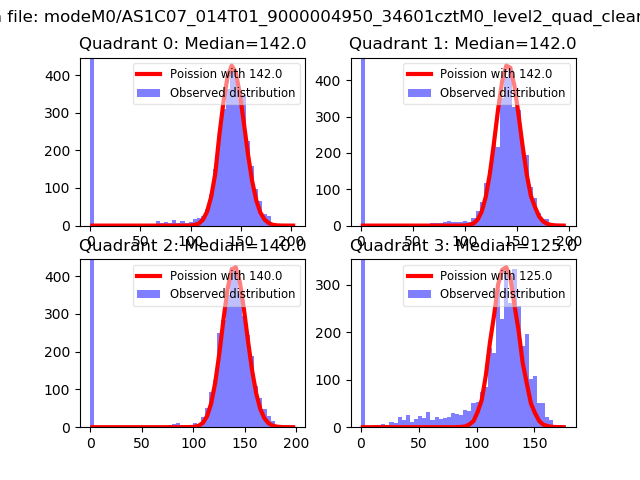 |
 |
| Quadrant-wise count rates Data is divided into 100 sec bins |
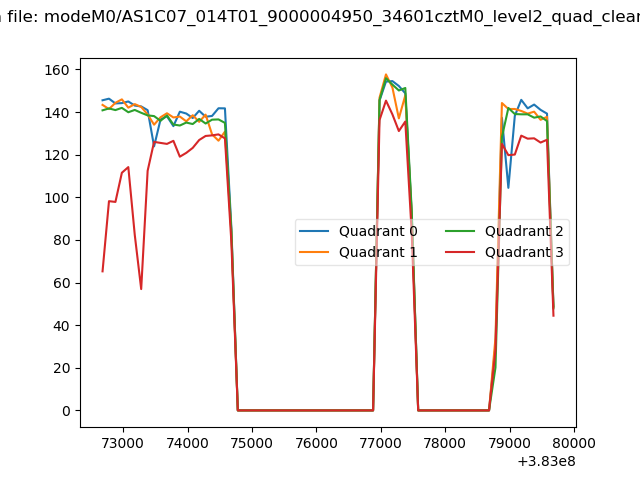 |
|
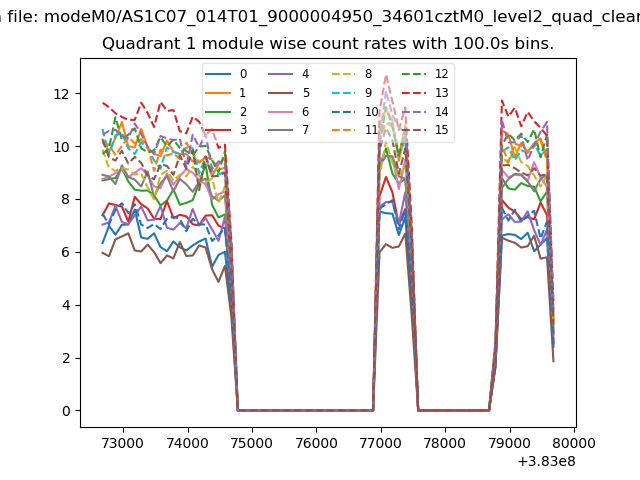
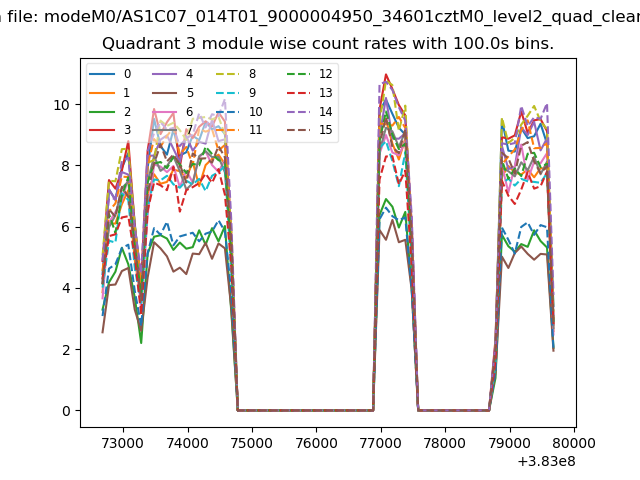
| Module-wise count rates for Quadrant A Data is divided into 100 sec bins |
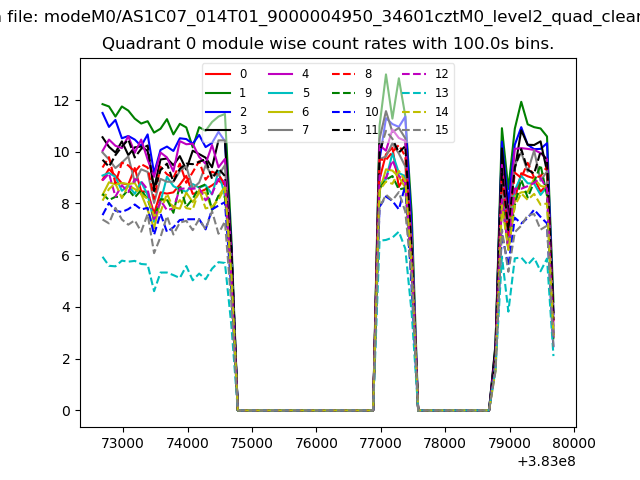 |
 |
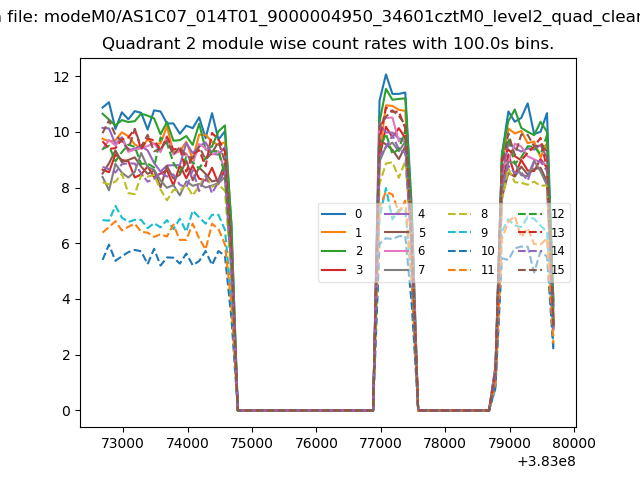
| Module-wise count rates for Quadrant B Data is divided into 100 sec bins |
 |
 |
| Module-wise count rates for Quadrant C Data is divided into 100 sec bins |
 |
 |
| Module-wise count rates for Quadrant D Data is divided into 100 sec bins |
 |
 |
| Parameter | Plot |
|---|---|
| CZT HV Monitor | 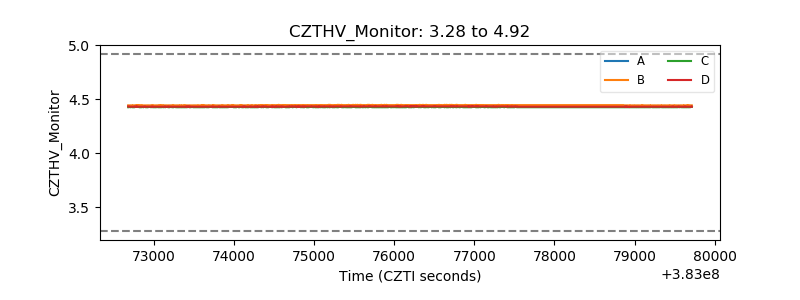 |
| D_VDD | 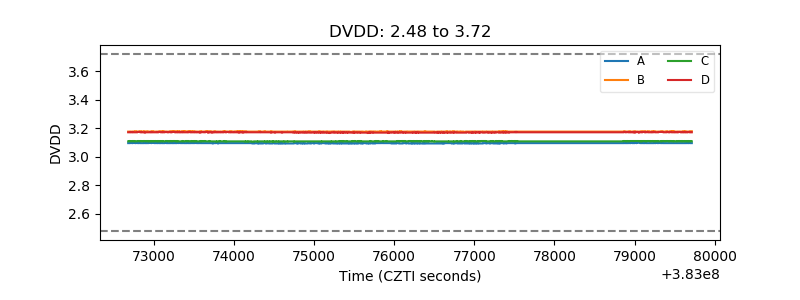 |
| Temperature 1 | 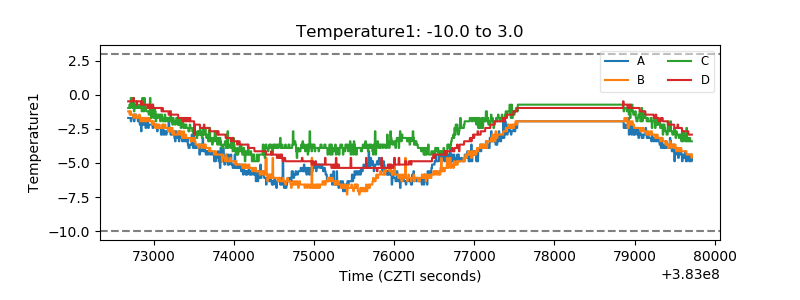 |
| Veto HV Monitor | 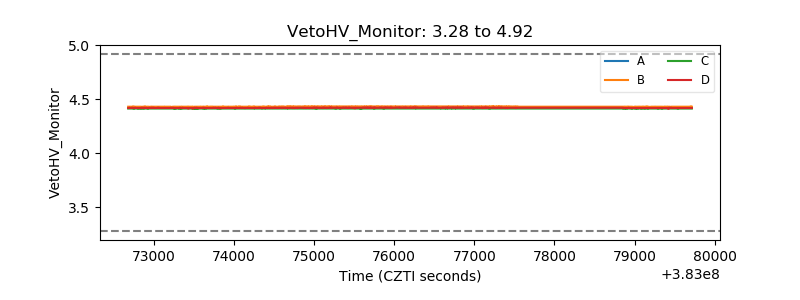 |
| Veto LLD | 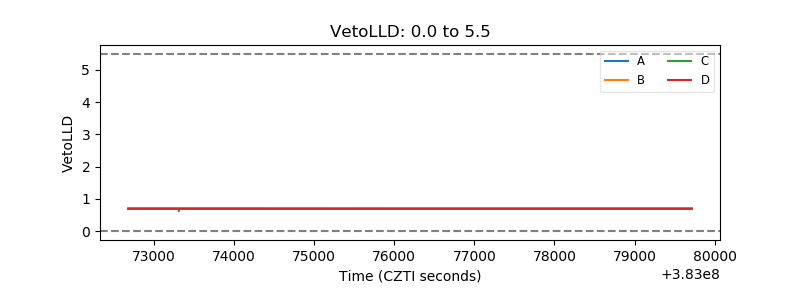 |
| Alpha Counter | 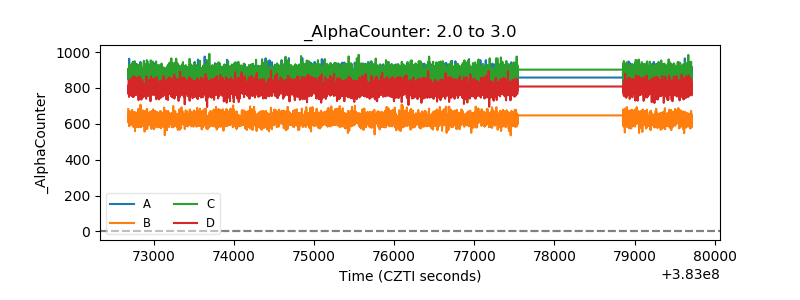 |
| _CPM_Rate | 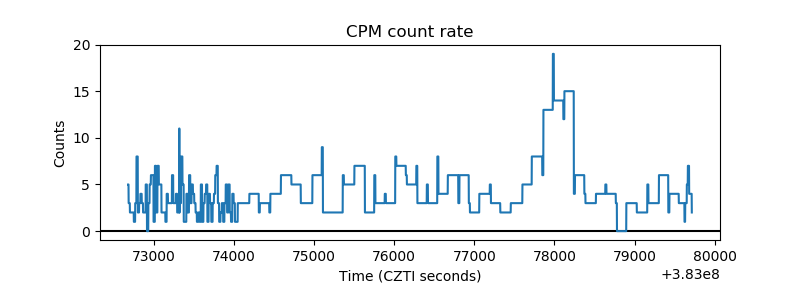 |
| CZT Counter | 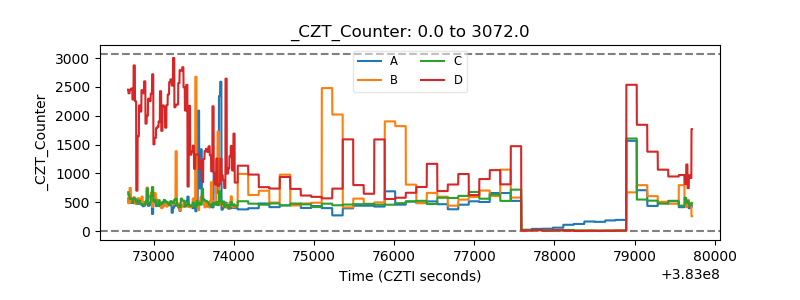 |
| +2.5 Volts monitor | 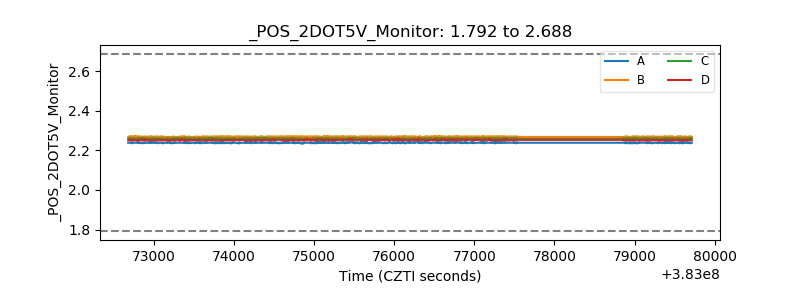 |
| +5 Volts monitor | 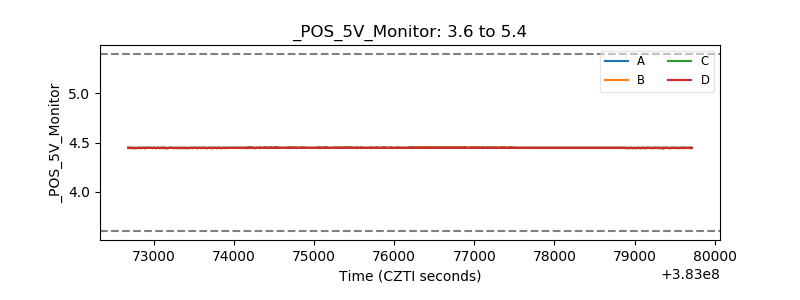 |
| _ROLL_ROT | 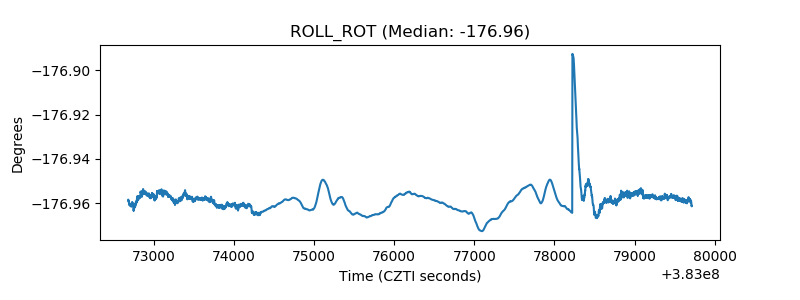 |
| _Roll_DEC | 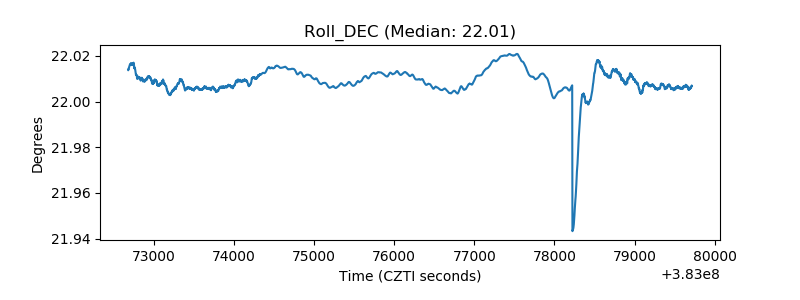 |
| _Roll_RA | 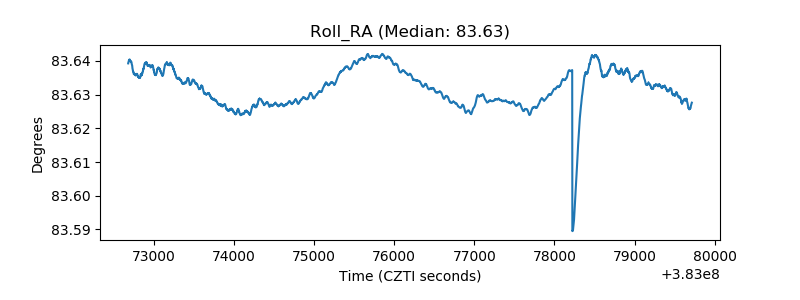 |
| Veto Counter | 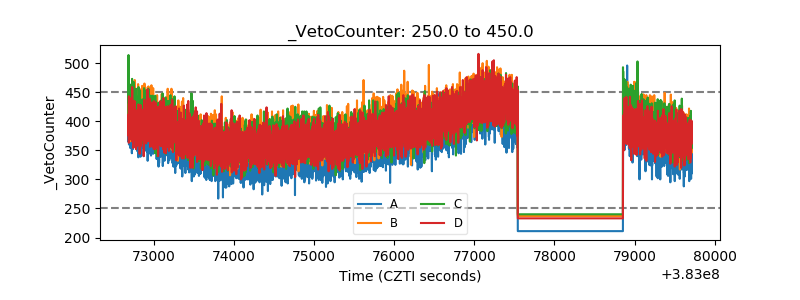 |