| Param | Original file | Final file |
|---|---|---|
| Filename | modeM0/AS1C07_014T01_9000004950_34600cztM0_level2.evt | modeM0/AS1C07_014T01_9000004950_34600cztM0_level2_quad_clean.evt |
| Size (bytes) | 609,056,640 | 74,093,760 |
| Size | 580.8 MB | 70.7 MB |
| Events in quadrant A | 3,434,016 | 482,918 |
| Events in quadrant B | 3,901,423 | 480,998 |
| Events in quadrant C | 3,010,576 | 480,904 |
| Events in quadrant D | 7,716,589 | 402,424 |
| Mode SS | |||
|---|---|---|---|
| Quadrant | BADHDUFLAG | Total packets | Discarded packets |
| A | 0 | 114 | 0 |
| B | 0 | 114 | 0 |
| C | 0 | 114 | 0 |
| D | 0 | 114 | 0 |
| Mode M9 | |||
|---|---|---|---|
| Quadrant | BADHDUFLAG | Total packets | Discarded packets |
| A | 0 | 15 | 0 |
| B | 0 | 15 | 0 |
| C | 0 | 15 | 0 |
| D | 0 | 15 | 0 |
| Mode M0 | |||
|---|---|---|---|
| Quadrant | BADHDUFLAG | Total packets | Discarded packets |
| A | 0 | 13821 | 2 |
| B | 0 | 15112 | 1 |
| C | 0 | 12120 | 1 |
| D | 0 | 26980 | 1 |
| Quadrant | Total seconds | Saturated seconds | Saturation percentage |
|---|---|---|---|
| A | 5665 | 179 | 3.159753% |
| B | 5665 | 373 | 6.584289% |
| C | 5665 | 29 | 0.511915% |
| D | 5665 | 967 | 17.069726% |
Noise dominated data is calculated using 1-second bins in cleaned event files. If a bin has >2000 counts, and if more than 50% of those come from <1% of pixels, then it is considered to be noise-dominated and hence unusable.
| Quadrant | # 1 sec bins | Bins with >0 counts | Bins with >2000 counts | High rate bins dominated by noise | Noise dominated (total time) | Noise dominated (detector-on time) | Marked lightcurve |
|---|---|---|---|---|---|---|---|
| A | 7125 | 5666 | 113 | 113 | 1.59% | 1.99% | 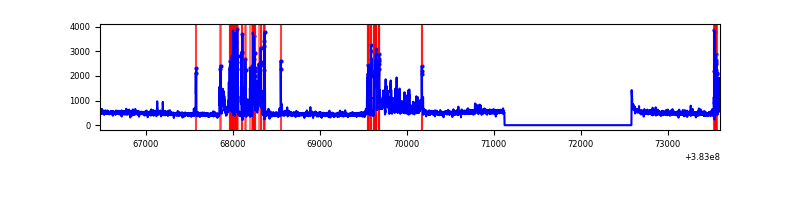 |
| B | 7125 | 5666 | 265 | 265 | 3.72% | 4.68% | 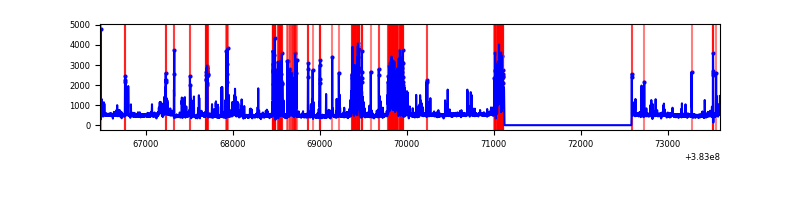 |
| C | 7125 | 5666 | 20 | 20 | 0.28% | 0.35% | 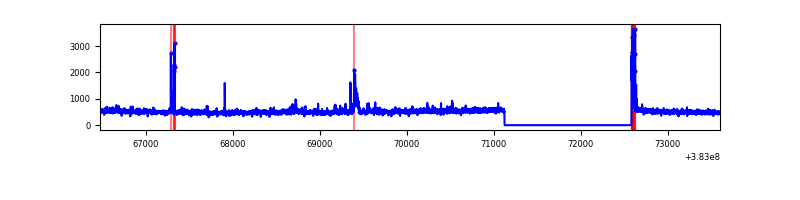 |
| D | 7125 | 5666 | 925 | 925 | 12.98% | 16.33% | 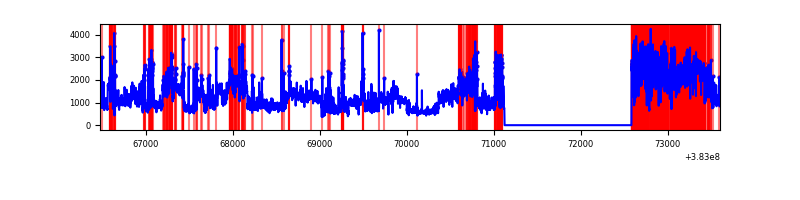 |
Top three noisy pixels from each quadrant. If the there are fewer than three noisy pixels in the level2.evt file, extra rows are filled as -1
| Pixel properties | Quadrant properties | ||||||
|---|---|---|---|---|---|---|---|
| Quadrant | DetID | PixID | Counts | Sigma | Mean | Median | Sigma |
| A | 15 | 169 | 799197 | 5867.79 | 667 | 654 | 136.1 |
| A | 10 | 83 | 33325 | 240.07 | 667 | 654 | 136.1 |
| A | 13 | 6 | 13330 | 93.14 | 667 | 654 | 136.1 |
| B | 5 | 172 | 916836 | 7217.18 | 655 | 640 | 126.9 |
| B | 5 | 255 | 128588 | 1007.89 | 655 | 640 | 126.9 |
| B | 0 | 218 | 67698 | 528.24 | 655 | 640 | 126.9 |
| C | 15 | 214 | 233947 | 1521.22 | 656 | 663 | 153.4 |
| C | 5 | 80 | 63210 | 407.86 | 656 | 663 | 153.4 |
| C | 0 | 10 | 62852 | 405.53 | 656 | 663 | 153.4 |
| D | 8 | 195 | 2848348 | 17260.18 | 612 | 601 | 165.0 |
| D | 14 | 52 | 995392 | 6029.42 | 612 | 601 | 165.0 |
| D | 13 | 249 | 470434 | 2847.66 | 612 | 601 | 165.0 |
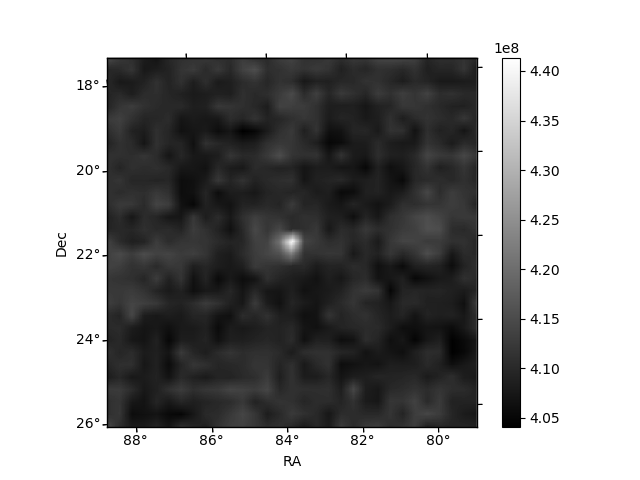
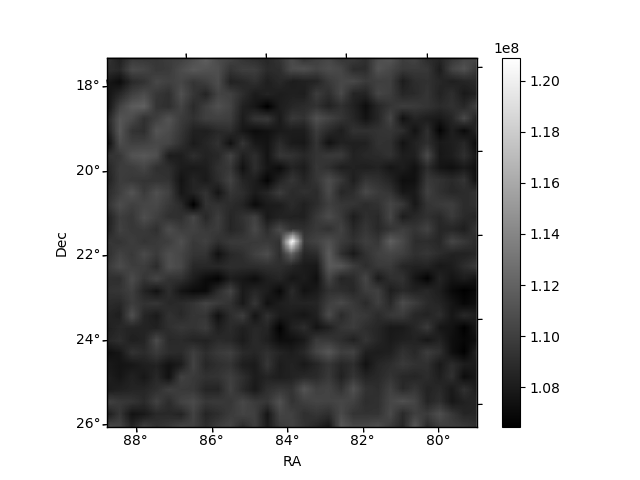
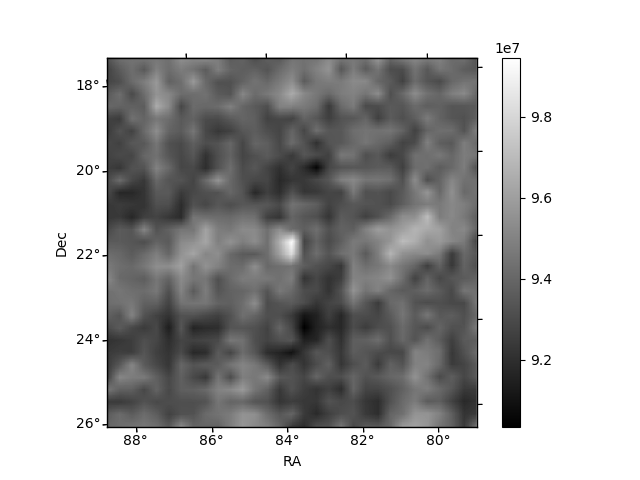
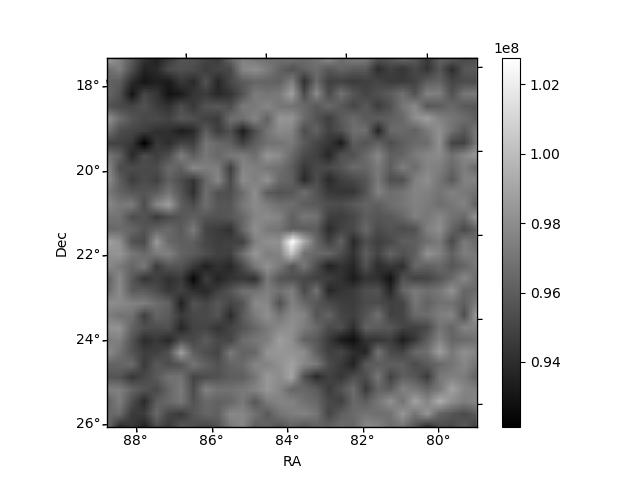
Histogram calculated using DETX and DETY for each event in the final _common_clean file
| Quadrant A | 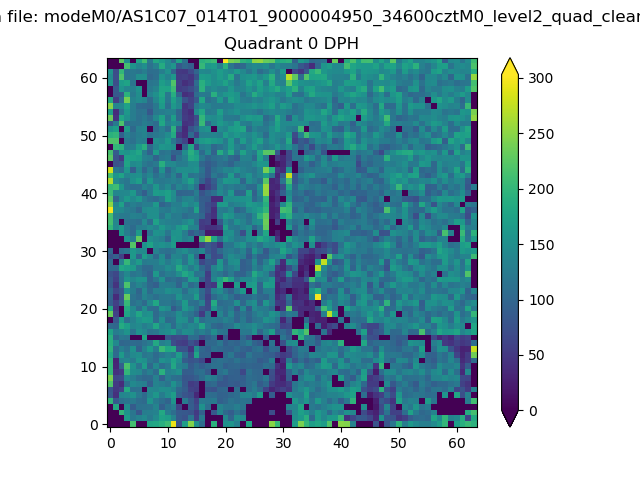 |
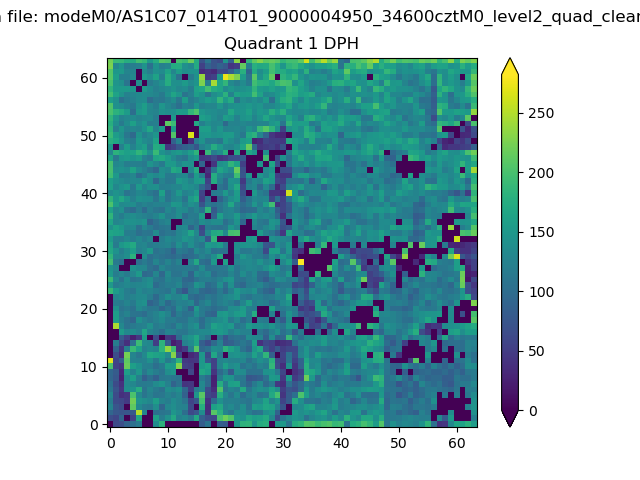 |
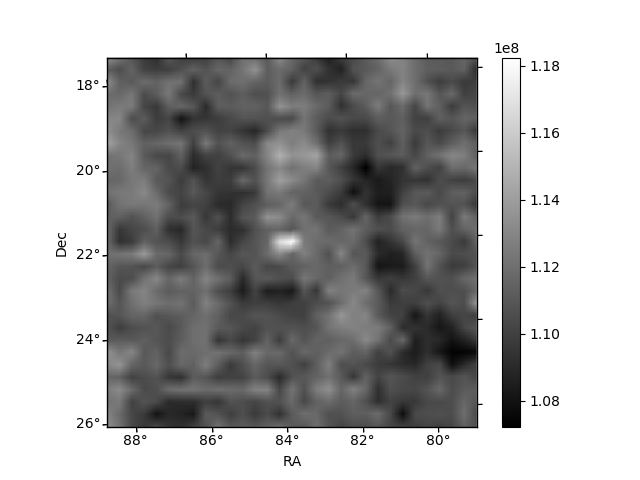
Quadrant B |
|---|---|---|---|
| Quadrant D | 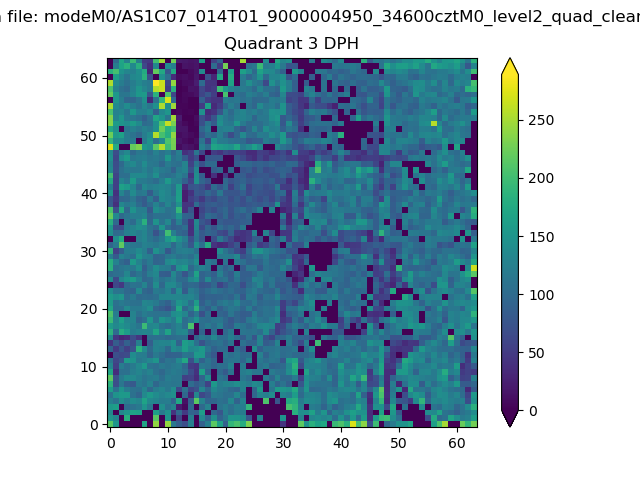 |
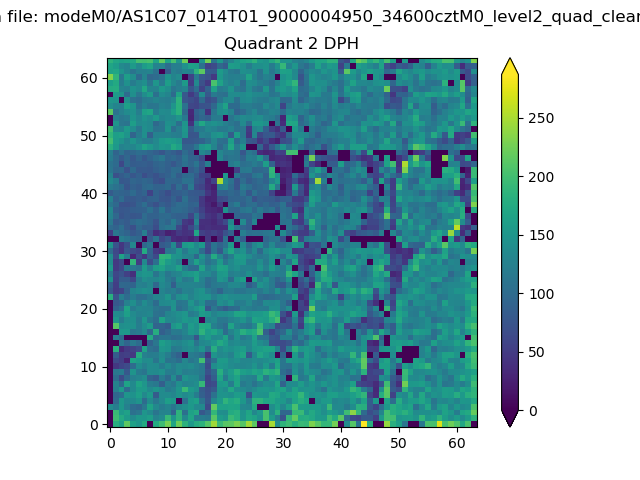 |
Quadrant C |
| Plot type | Count rate plots | Images |
|---|---|---|
| Comparison with Poisson distribution Blue bars denote a histogram of data divided into 1 sec bins. Red curve is a Poisson curve with rate = median count rate of data. |
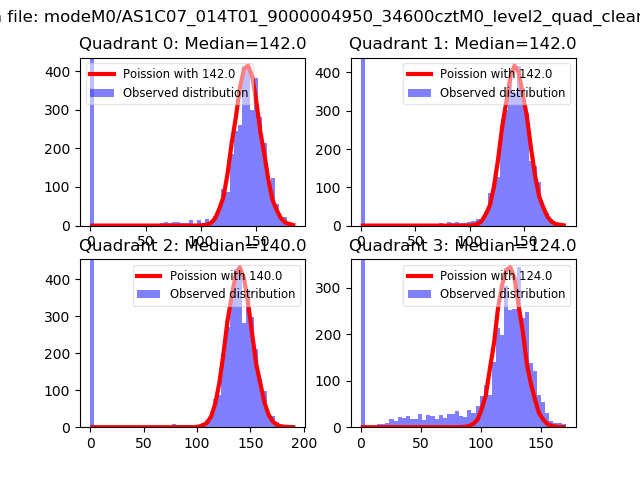 |
 |
| Quadrant-wise count rates Data is divided into 100 sec bins |
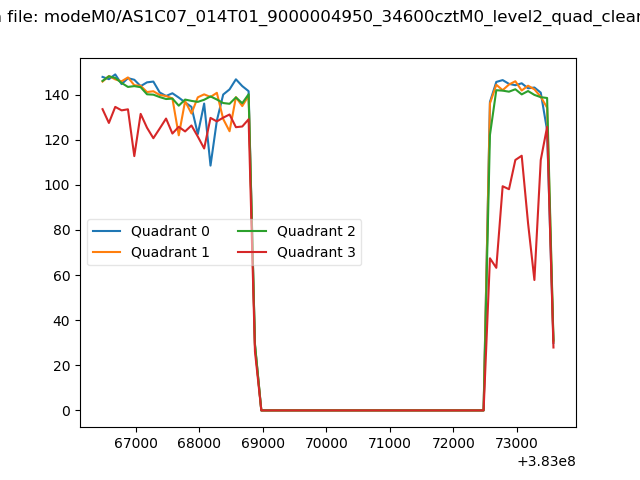 |
|
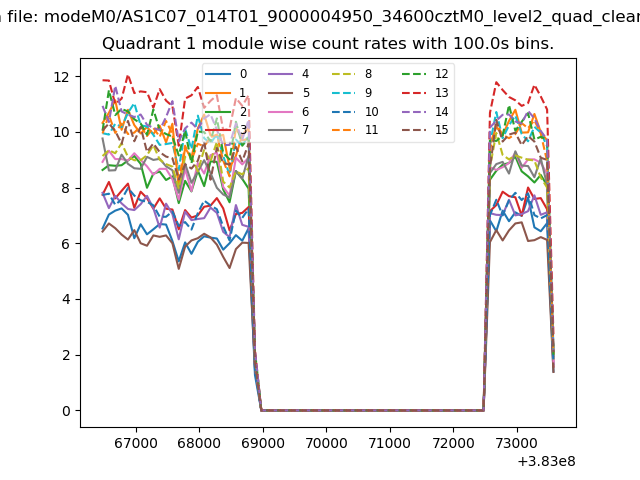
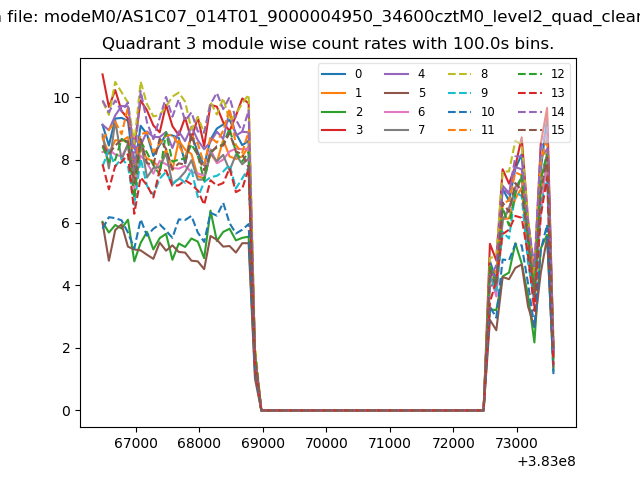
| Module-wise count rates for Quadrant A Data is divided into 100 sec bins |
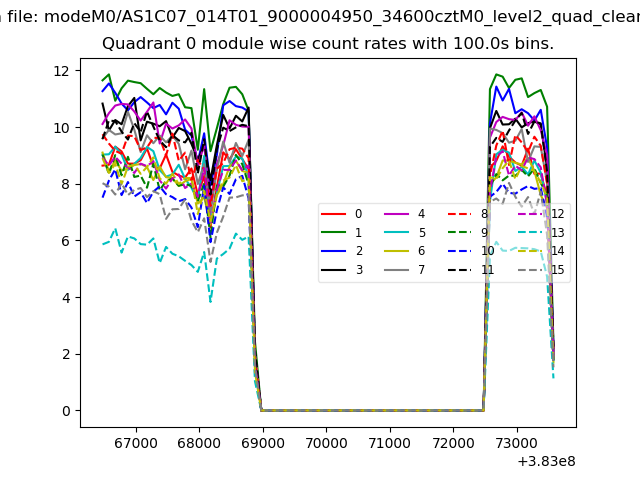 |
 |
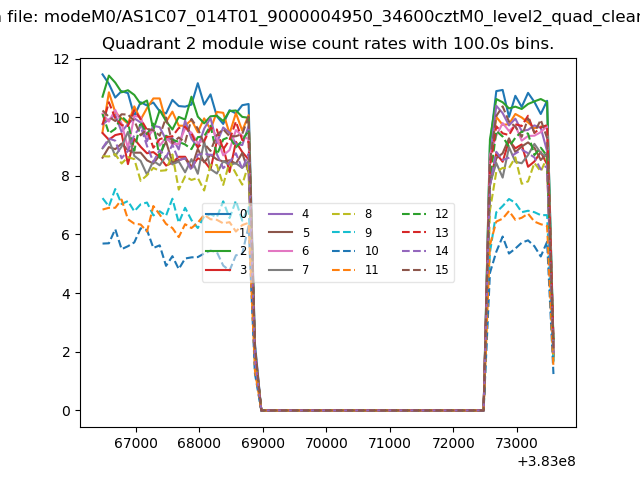
| Module-wise count rates for Quadrant B Data is divided into 100 sec bins |
 |
 |
| Module-wise count rates for Quadrant C Data is divided into 100 sec bins |
 |
 |
| Module-wise count rates for Quadrant D Data is divided into 100 sec bins |
 |
 |
| Parameter | Plot |
|---|---|
| CZT HV Monitor |  |
| D_VDD | 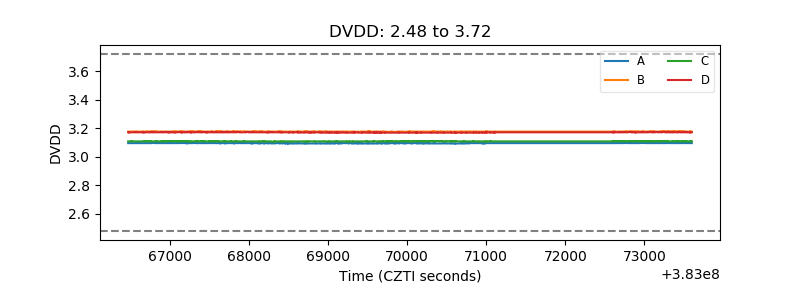 |
| Temperature 1 | 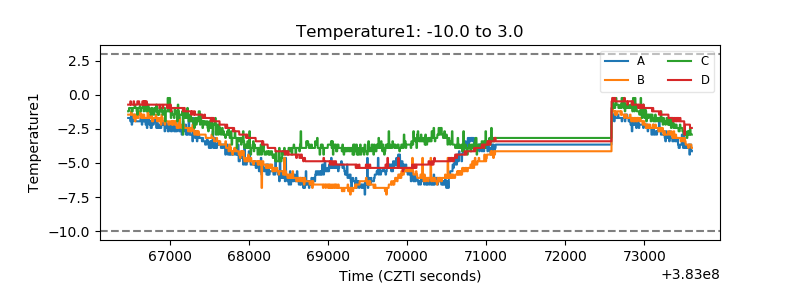 |
| Veto HV Monitor | 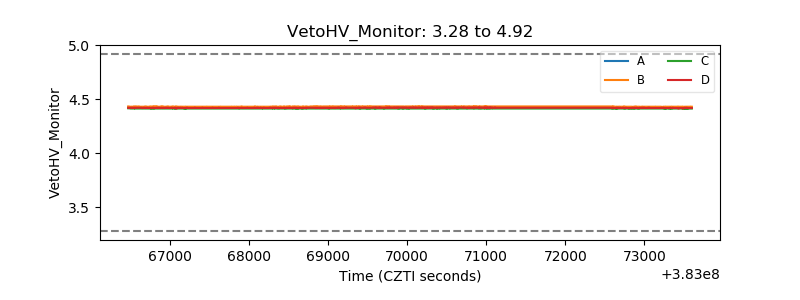 |
| Veto LLD | 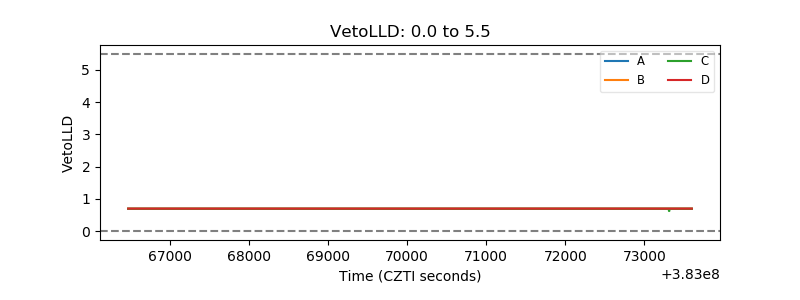 |
| Alpha Counter | 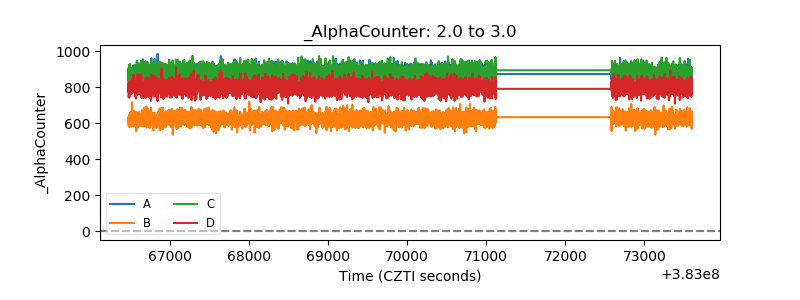 |
| _CPM_Rate | 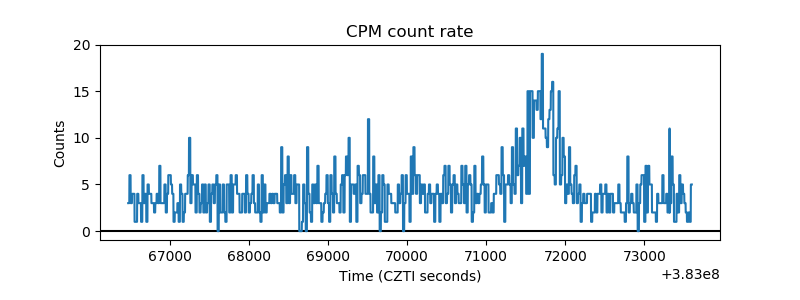 |
| CZT Counter | 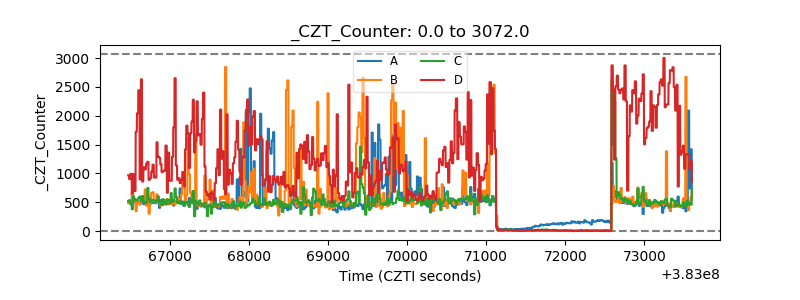 |
| +2.5 Volts monitor | 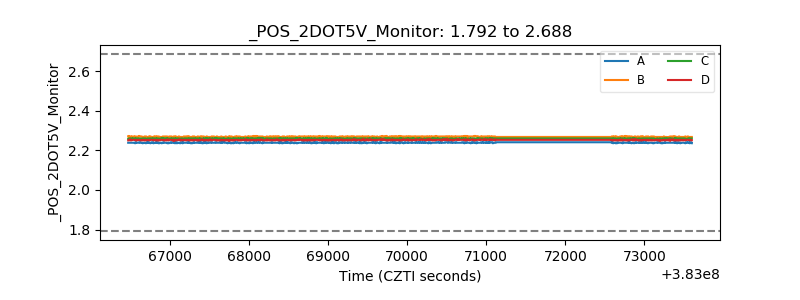 |
| +5 Volts monitor | 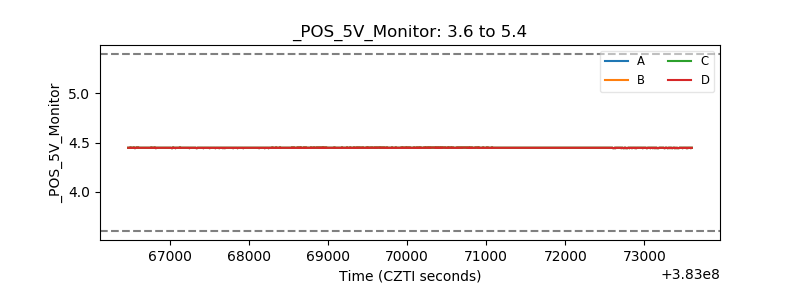 |
| _ROLL_ROT | 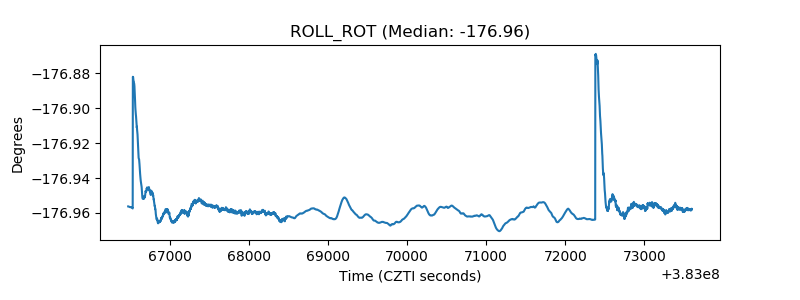 |
| _Roll_DEC | 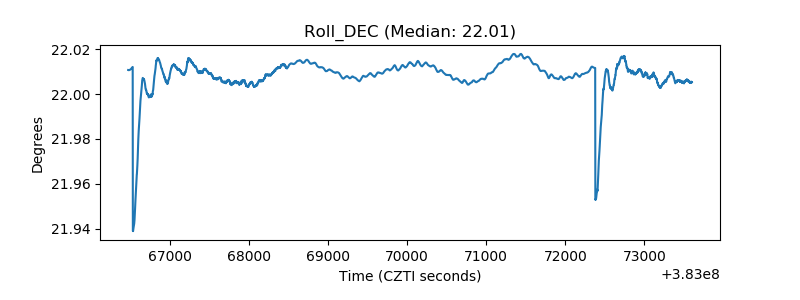 |
| _Roll_RA | 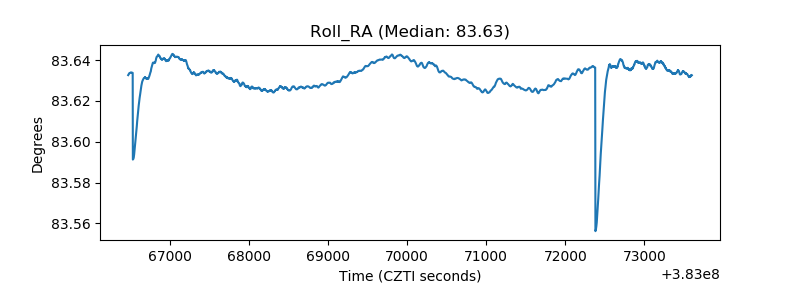 |
| Veto Counter | 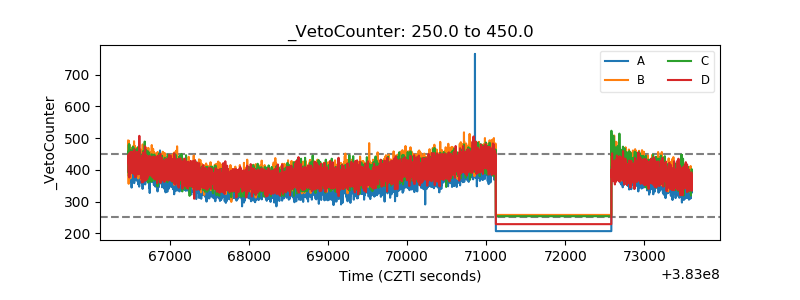 |