| Param | Original file | Final file |
|---|---|---|
| Filename | modeM0/AS1C07_014T01_9000004950_34597cztM0_level2.evt | modeM0/AS1C07_014T01_9000004950_34597cztM0_level2_quad_clean.evt |
| Size (bytes) | 514,022,400 | 101,724,480 |
| Size | 490.2 MB | 97.0 MB |
| Events in quadrant A | 2,599,045 | 717,543 |
| Events in quadrant B | 3,229,384 | 704,634 |
| Events in quadrant C | 2,813,162 | 692,337 |
| Events in quadrant D | 6,596,032 | 624,248 |
| Mode SS | |||
|---|---|---|---|
| Quadrant | BADHDUFLAG | Total packets | Discarded packets |
| A | 0 | 100 | 0 |
| B | 0 | 100 | 0 |
| C | 0 | 100 | 0 |
| D | 0 | 100 | 0 |
| Mode M9 | |||
|---|---|---|---|
| Quadrant | BADHDUFLAG | Total packets | Discarded packets |
| A | 0 | 34 | 0 |
| B | 0 | 34 | 0 |
| C | 0 | 34 | 0 |
| D | 0 | 35 | 0 |
| Mode M0 | |||
|---|---|---|---|
| Quadrant | BADHDUFLAG | Total packets | Discarded packets |
| A | 0 | 10525 | 3 |
| B | 0 | 12482 | 2 |
| C | 0 | 11162 | 2 |
| D | 0 | 23022 | 2 |
| Quadrant | Total seconds | Saturated seconds | Saturation percentage |
|---|---|---|---|
| A | 4873 | 9 | 0.184691% |
| B | 4873 | 224 | 4.596758% |
| C | 4873 | 39 | 0.800328% |
| D | 4873 | 336 | 6.895136% |
Noise dominated data is calculated using 1-second bins in cleaned event files. If a bin has >2000 counts, and if more than 50% of those come from <1% of pixels, then it is considered to be noise-dominated and hence unusable.
| Quadrant | # 1 sec bins | Bins with >0 counts | Bins with >2000 counts | High rate bins dominated by noise | Noise dominated (total time) | Noise dominated (detector-on time) | Marked lightcurve |
|---|---|---|---|---|---|---|---|
| A | 7025 | 4874 | 0 | 0 | 0.00% | 0.00% |  |
| B | 7025 | 4874 | 147 | 147 | 2.09% | 3.02% |  |
| C | 7025 | 4874 | 27 | 27 | 0.38% | 0.55% | 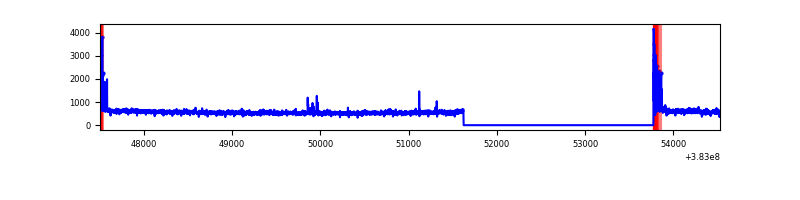 |
| D | 7025 | 4874 | 433 | 433 | 6.16% | 8.88% |  |
Top three noisy pixels from each quadrant. If the there are fewer than three noisy pixels in the level2.evt file, extra rows are filled as -1
| Pixel properties | Quadrant properties | ||||||
|---|---|---|---|---|---|---|---|
| Quadrant | DetID | PixID | Counts | Sigma | Mean | Median | Sigma |
| A | 10 | 83 | 42839 | 319.57 | 656 | 647 | 132.0 |
| A | 9 | 143 | 18722 | 136.9 | 656 | 647 | 132.0 |
| A | 13 | 254 | 8634 | 60.49 | 656 | 647 | 132.0 |
| B | 5 | 172 | 633713 | 5266.71 | 634 | 622 | 120.2 |
| B | 0 | 189 | 23121 | 187.17 | 634 | 622 | 120.2 |
| B | 5 | 255 | 15482 | 123.62 | 634 | 622 | 120.2 |
| C | 15 | 214 | 210632 | 1468.77 | 618 | 626 | 143.0 |
| C | 0 | 10 | 118255 | 822.69 | 618 | 626 | 143.0 |
| C | 14 | 67 | 30002 | 205.45 | 618 | 626 | 143.0 |
| D | 8 | 195 | 3609109 | 23576.43 | 616 | 601 | 153.1 |
| D | 2 | 249 | 120496 | 783.34 | 616 | 601 | 153.1 |
| D | 13 | 249 | 118982 | 773.45 | 616 | 601 | 153.1 |
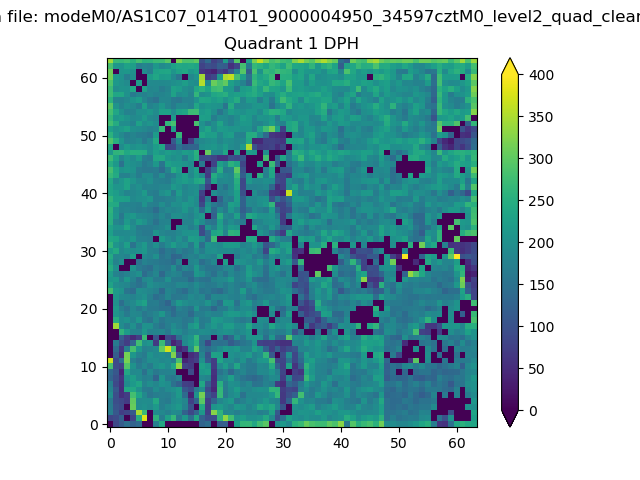
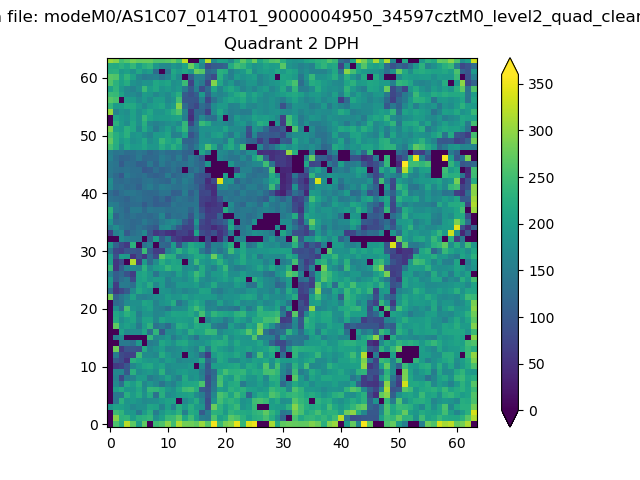
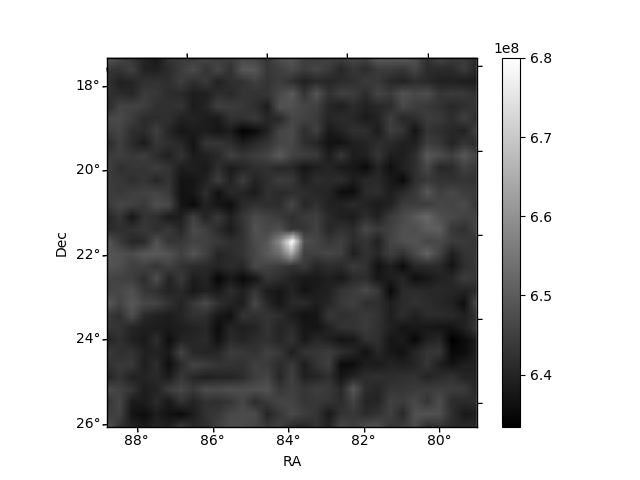
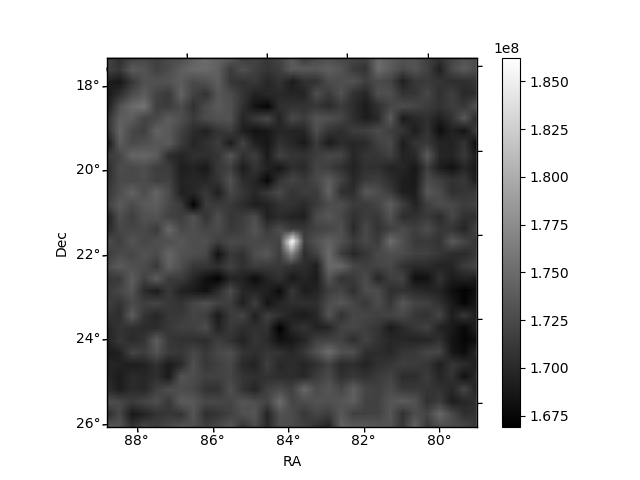
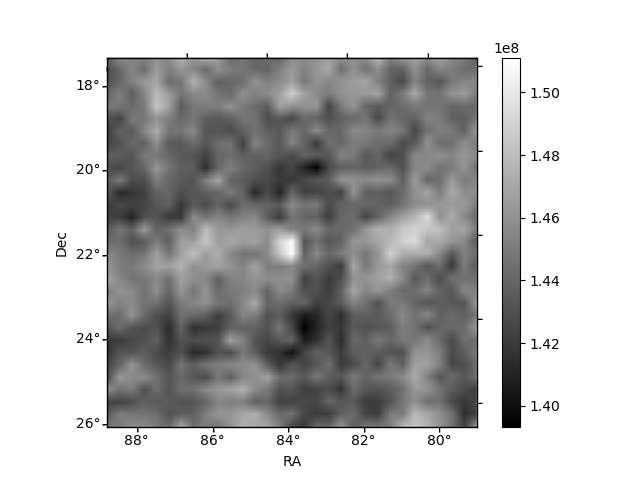
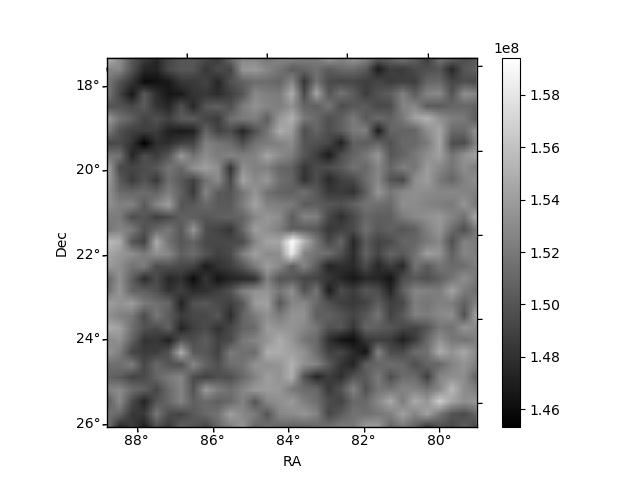
Histogram calculated using DETX and DETY for each event in the final _common_clean file
| Quadrant A |  |
 |
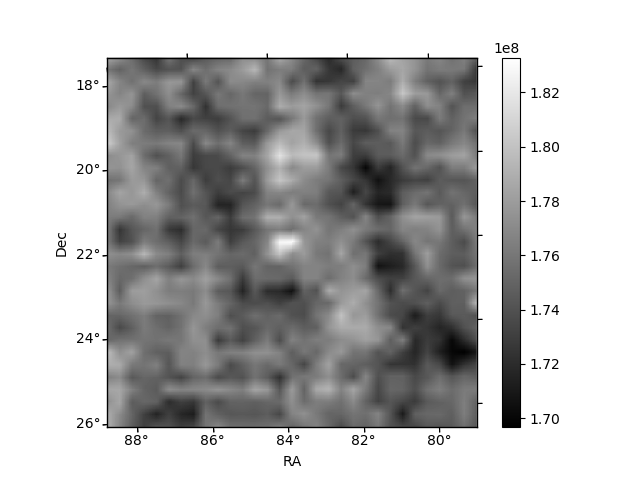
Quadrant B |
|---|---|---|---|
| Quadrant D | 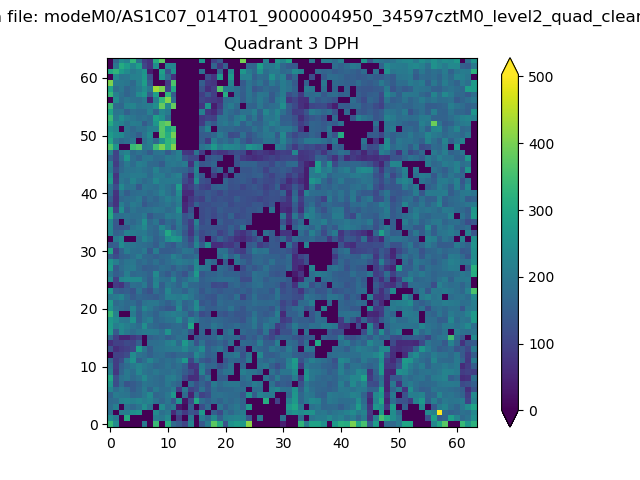 |
 |
Quadrant C |
| Plot type | Count rate plots | Images |
|---|---|---|
| Comparison with Poisson distribution Blue bars denote a histogram of data divided into 1 sec bins. Red curve is a Poisson curve with rate = median count rate of data. |
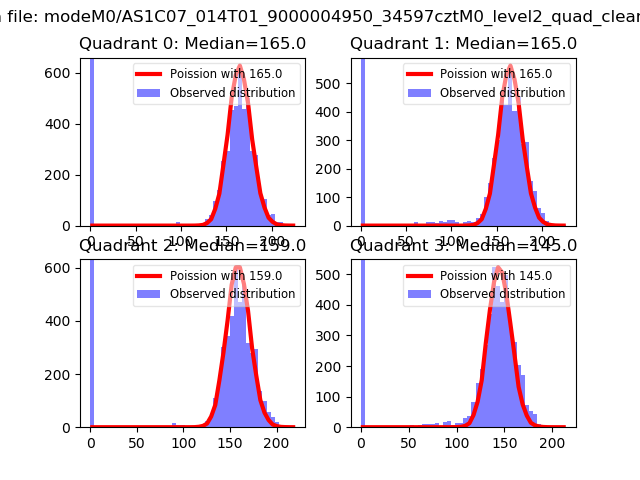 |
 |
| Quadrant-wise count rates Data is divided into 100 sec bins |
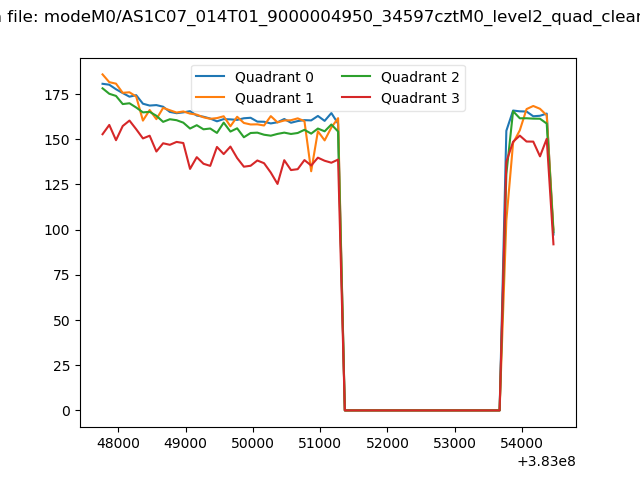 |
|
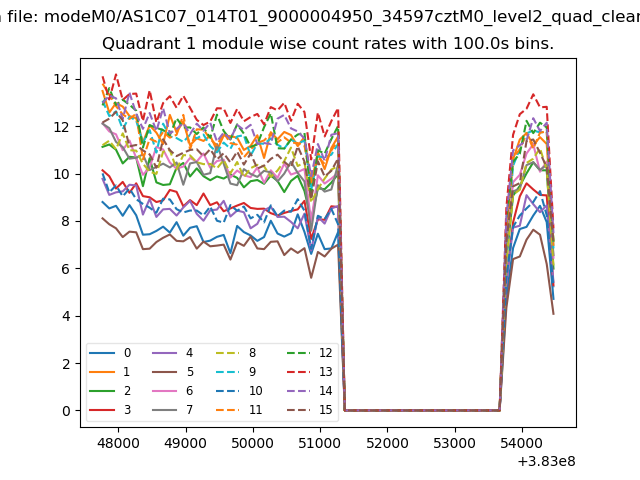
| Module-wise count rates for Quadrant A Data is divided into 100 sec bins |
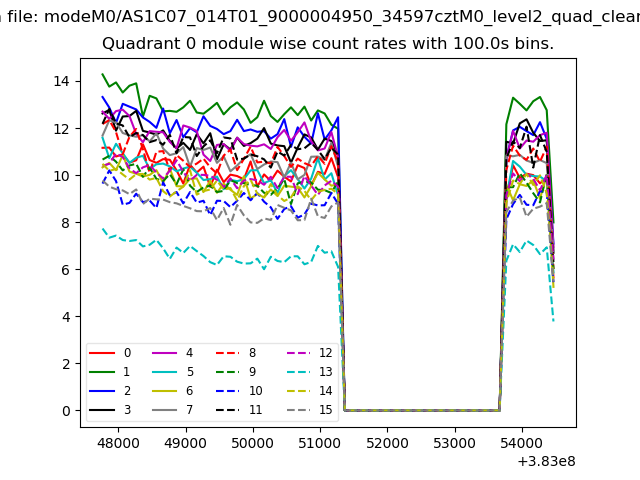 |
 |
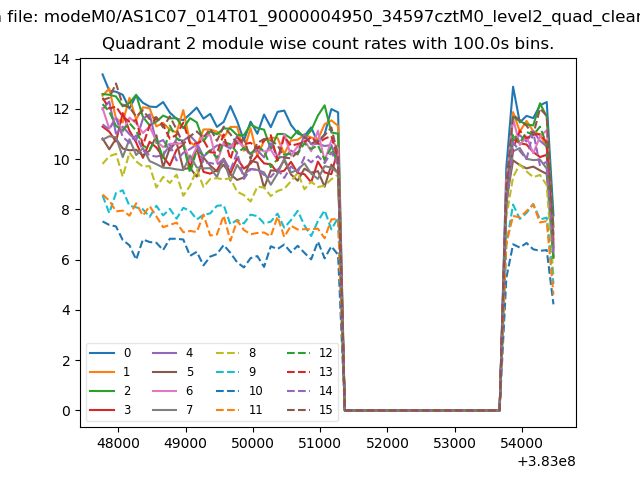
| Module-wise count rates for Quadrant B Data is divided into 100 sec bins |
 |
 |
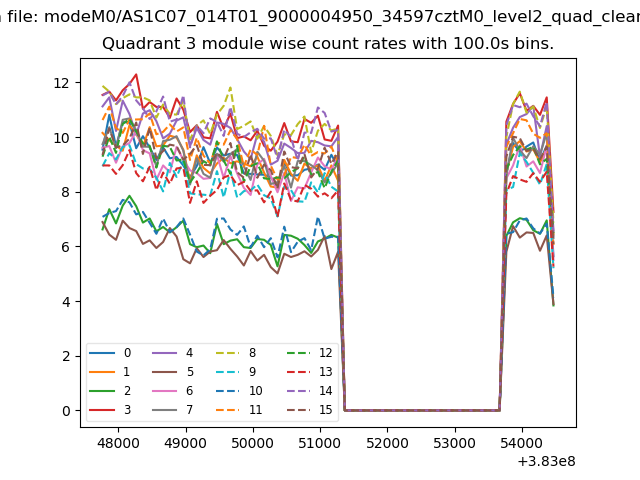
| Module-wise count rates for Quadrant C Data is divided into 100 sec bins |
 |
 |
| Module-wise count rates for Quadrant D Data is divided into 100 sec bins |
 |
 |
| Parameter | Plot |
|---|---|
| CZT HV Monitor | 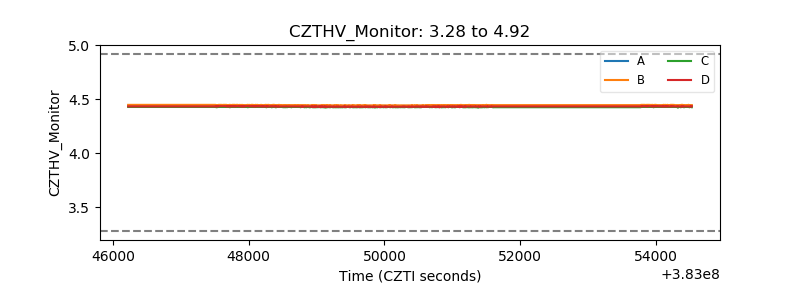 |
| D_VDD | 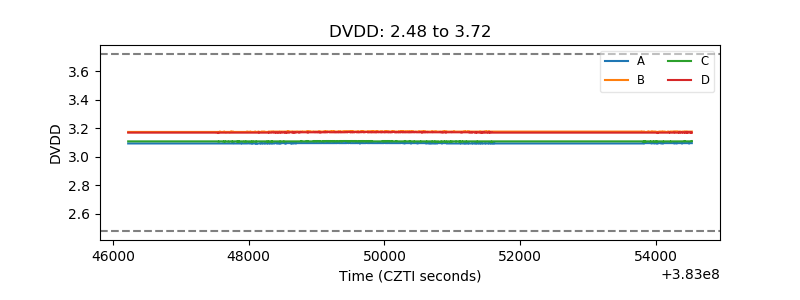 |
| Temperature 1 | 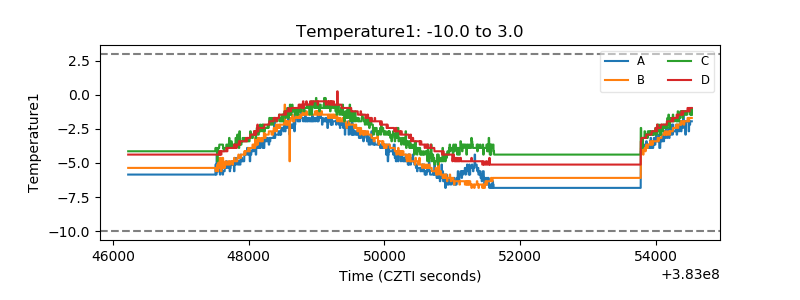 |
| Veto HV Monitor | 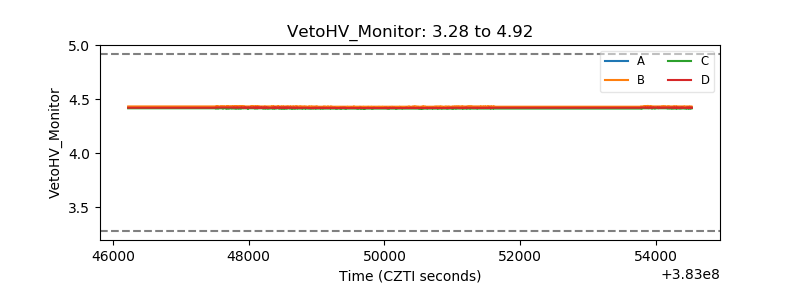 |
| Veto LLD | 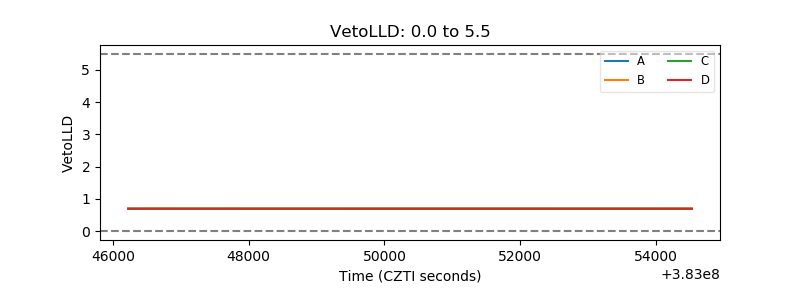 |
| Alpha Counter | 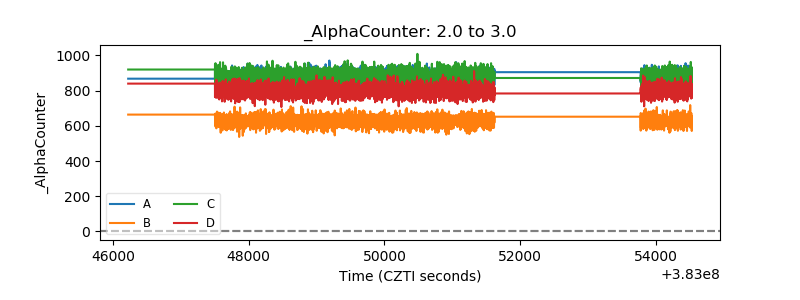 |
| _CPM_Rate | 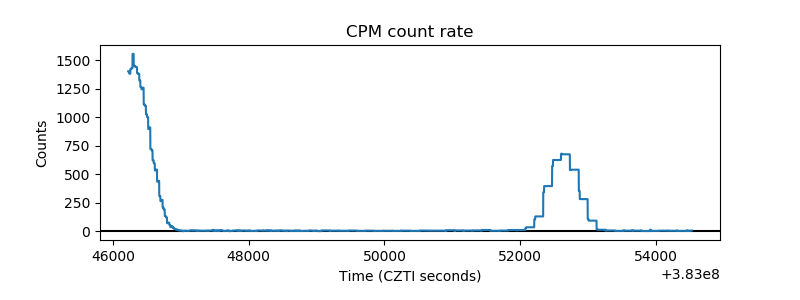 |
| CZT Counter | 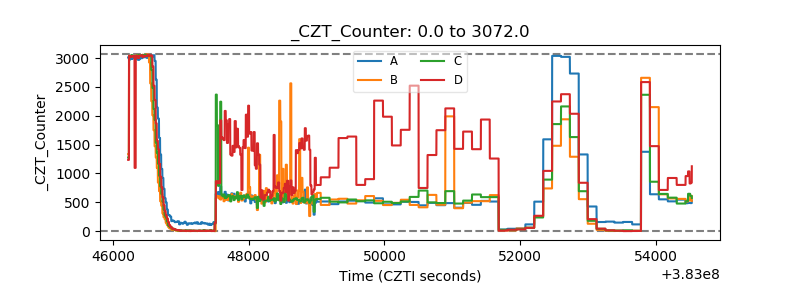 |
| +2.5 Volts monitor | 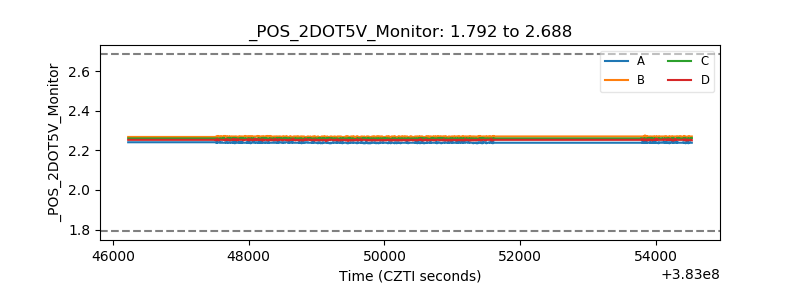 |
| +5 Volts monitor |  |
| _ROLL_ROT | 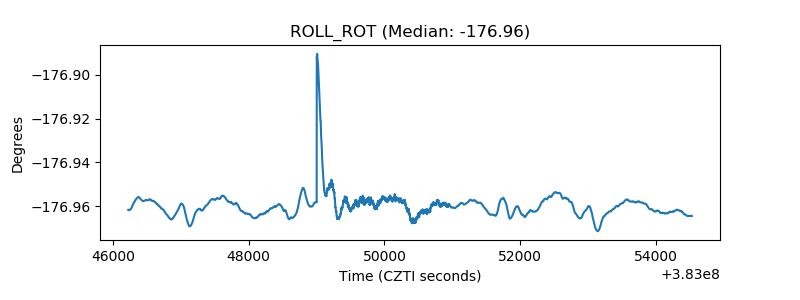 |
| _Roll_DEC | 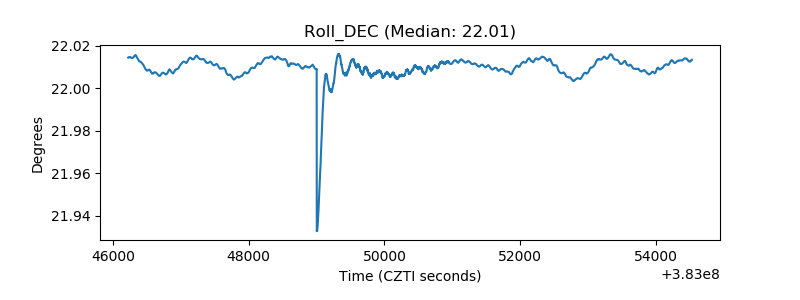 |
| _Roll_RA | 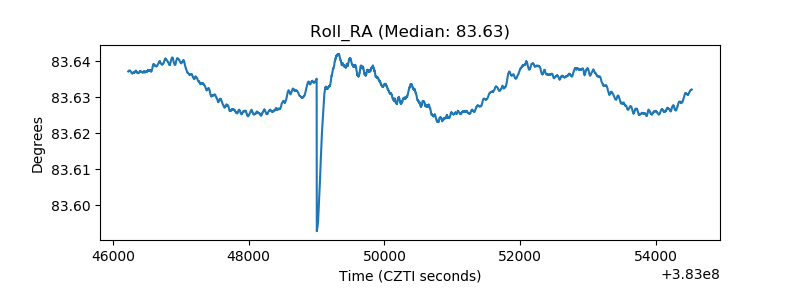 |
| Veto Counter | 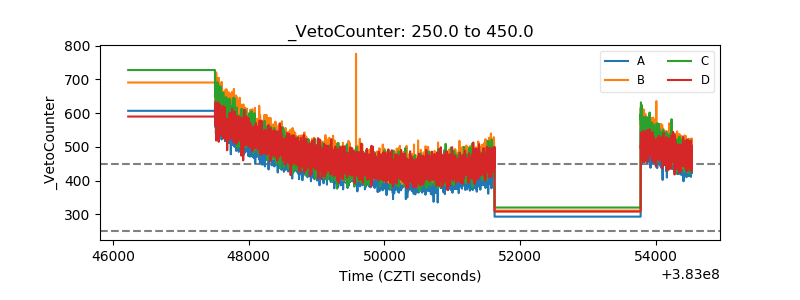 |