| Param | Original file | Final file |
|---|---|---|
| Filename | modeM0/AS1C07_014T01_9000004950_34596cztM0_level2.evt | modeM0/AS1C07_014T01_9000004950_34596cztM0_level2_quad_clean.evt |
| Size (bytes) | 561,191,040 | 95,849,280 |
| Size | 535.2 MB | 91.4 MB |
| Events in quadrant A | 2,733,754 | 674,997 |
| Events in quadrant B | 3,715,121 | 657,288 |
| Events in quadrant C | 2,969,874 | 655,215 |
| Events in quadrant D | 7,242,064 | 567,082 |
| Mode SS | |||
|---|---|---|---|
| Quadrant | BADHDUFLAG | Total packets | Discarded packets |
| A | 0 | 100 | 0 |
| B | 0 | 100 | 0 |
| C | 0 | 100 | 0 |
| D | 0 | 100 | 0 |
| Mode M9 | |||
|---|---|---|---|
| Quadrant | BADHDUFLAG | Total packets | Discarded packets |
| A | 0 | 29 | 0 |
| B | 0 | 29 | 0 |
| C | 0 | 29 | 0 |
| D | 0 | 30 | 0 |
| Mode M0 | |||
|---|---|---|---|
| Quadrant | BADHDUFLAG | Total packets | Discarded packets |
| A | 0 | 10931 | 3 |
| B | 0 | 14231 | 2 |
| C | 0 | 11875 | 2 |
| D | 0 | 24992 | 2 |
| Quadrant | Total seconds | Saturated seconds | Saturation percentage |
|---|---|---|---|
| A | 4965 | 7 | 0.140987% |
| B | 4965 | 372 | 7.492447% |
| C | 4965 | 30 | 0.604230% |
| D | 4965 | 651 | 13.111782% |
Noise dominated data is calculated using 1-second bins in cleaned event files. If a bin has >2000 counts, and if more than 50% of those come from <1% of pixels, then it is considered to be noise-dominated and hence unusable.
| Quadrant | # 1 sec bins | Bins with >0 counts | Bins with >2000 counts | High rate bins dominated by noise | Noise dominated (total time) | Noise dominated (detector-on time) | Marked lightcurve |
|---|---|---|---|---|---|---|---|
| A | 7086 | 4966 | 0 | 0 | 0.00% | 0.00% | 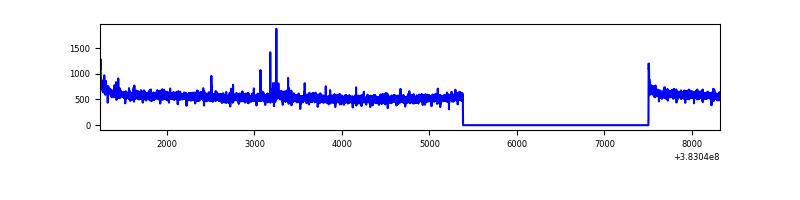 |
| B | 7086 | 4966 | 254 | 254 | 3.58% | 5.11% | 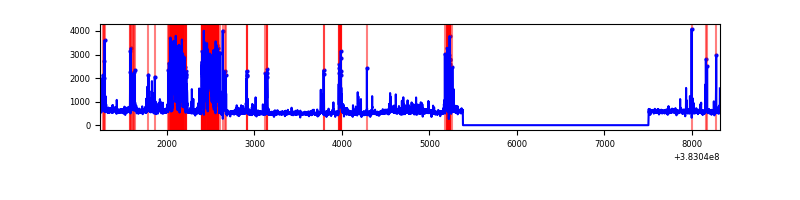 |
| C | 7086 | 4966 | 17 | 17 | 0.24% | 0.34% | 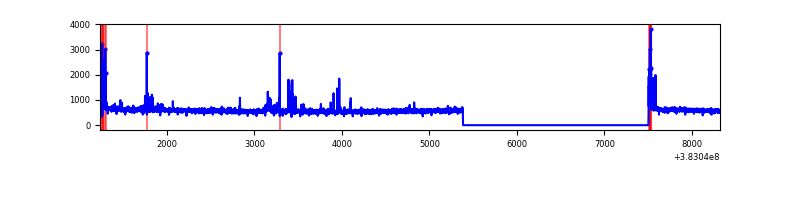 |
| D | 7086 | 4966 | 778 | 778 | 10.98% | 15.67% | 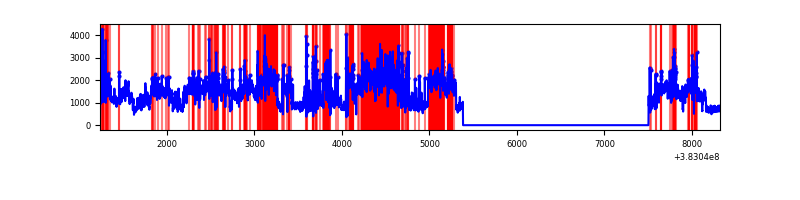 |
Top three noisy pixels from each quadrant. If the there are fewer than three noisy pixels in the level2.evt file, extra rows are filled as -1
| Pixel properties | Quadrant properties | ||||||
|---|---|---|---|---|---|---|---|
| Quadrant | DetID | PixID | Counts | Sigma | Mean | Median | Sigma |
| A | 10 | 83 | 42867 | 303.8 | 690 | 682 | 138.9 |
| A | 9 | 143 | 17763 | 123.01 | 690 | 682 | 138.9 |
| A | 13 | 6 | 10997 | 74.28 | 690 | 682 | 138.9 |
| B | 5 | 172 | 931733 | 7433.63 | 663 | 653 | 125.3 |
| B | 0 | 190 | 69140 | 546.79 | 663 | 653 | 125.3 |
| B | 4 | 232 | 32357 | 253.12 | 663 | 653 | 125.3 |
| C | 15 | 214 | 214906 | 1422.35 | 651 | 660 | 150.6 |
| C | 0 | 207 | 85044 | 560.22 | 651 | 660 | 150.6 |
| C | 0 | 10 | 78634 | 517.66 | 651 | 660 | 150.6 |
| D | 8 | 195 | 3720387 | 24046.81 | 631 | 616 | 154.7 |
| D | 13 | 249 | 208160 | 1341.69 | 631 | 616 | 154.7 |
| D | 1 | 52 | 205663 | 1325.55 | 631 | 616 | 154.7 |
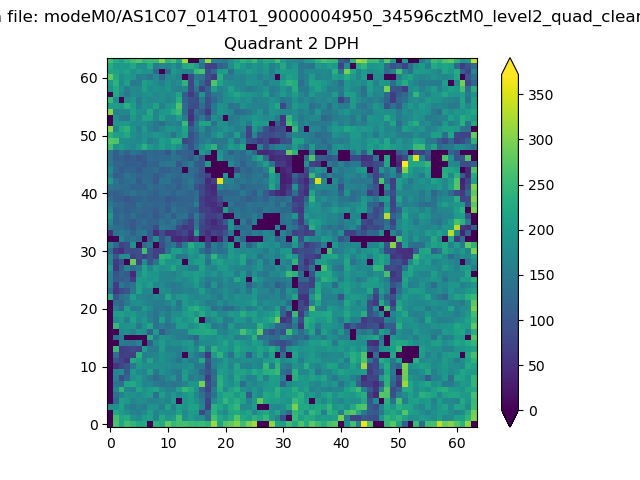
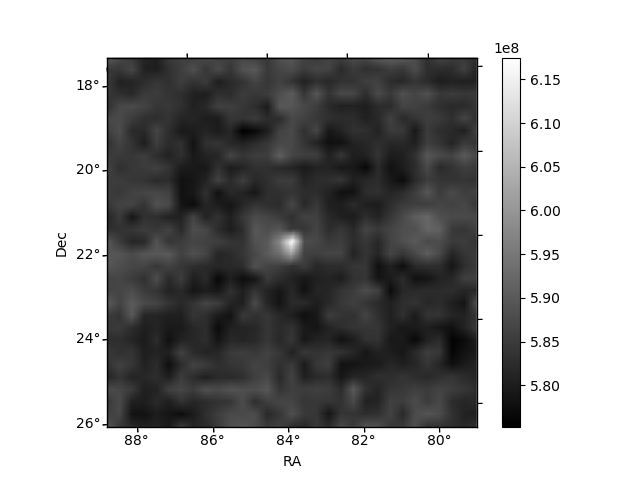
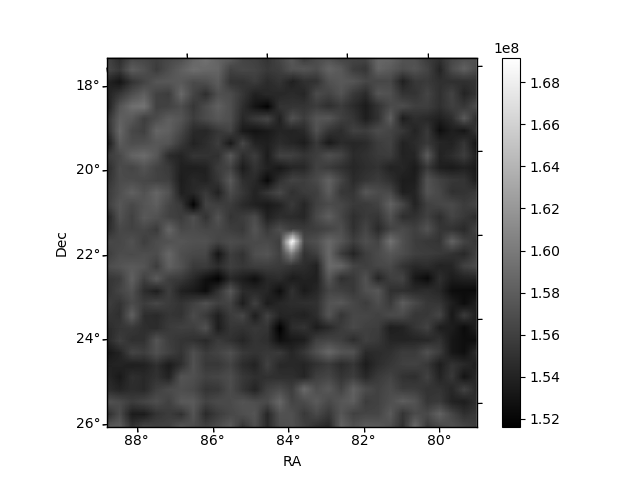
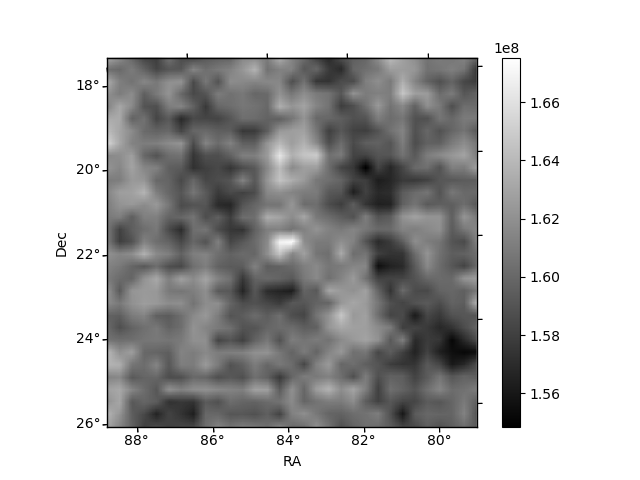
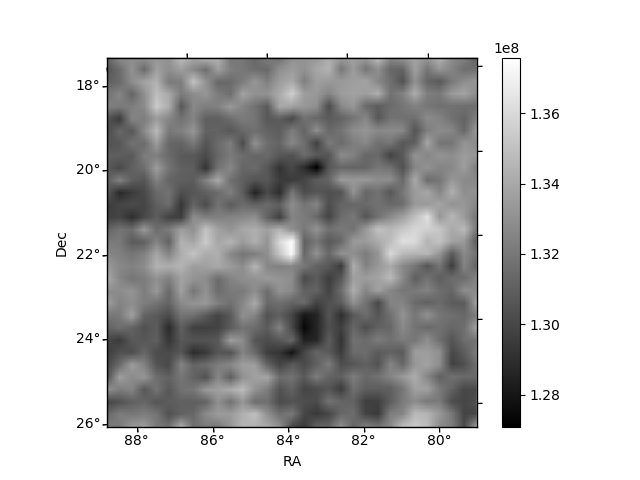
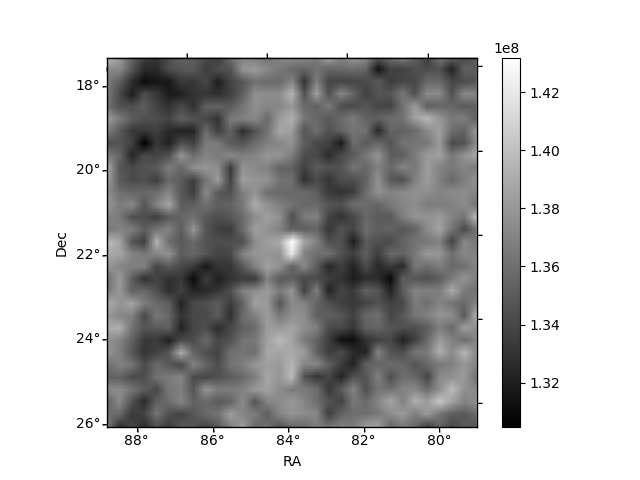
Histogram calculated using DETX and DETY for each event in the final _common_clean file
| Quadrant A | 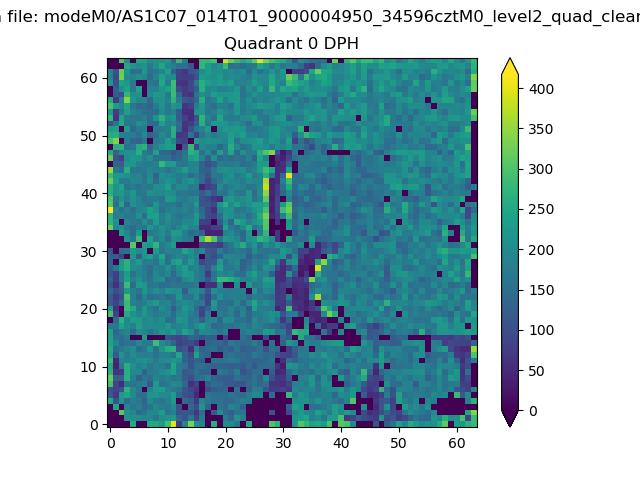 |
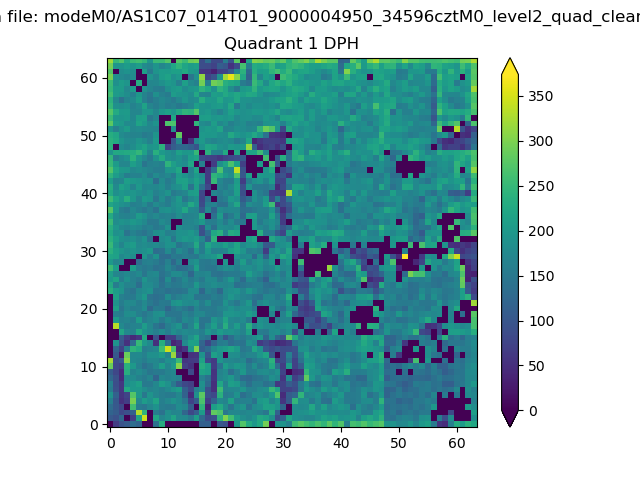 |
Quadrant B |
|---|---|---|---|
| Quadrant D | 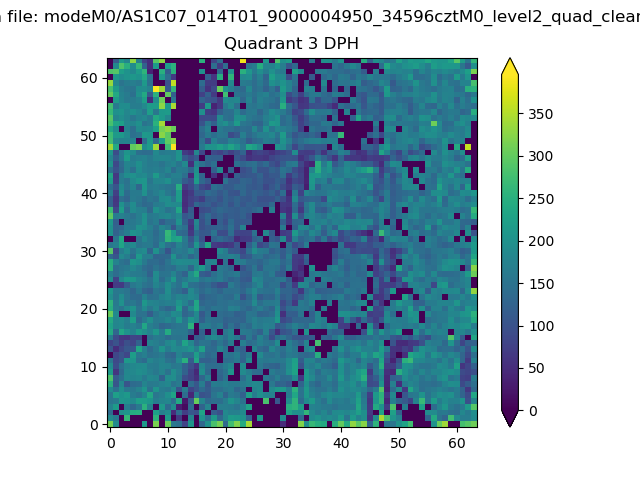 |
 |
Quadrant C |
| Plot type | Count rate plots | Images |
|---|---|---|
| Comparison with Poisson distribution Blue bars denote a histogram of data divided into 1 sec bins. Red curve is a Poisson curve with rate = median count rate of data. |
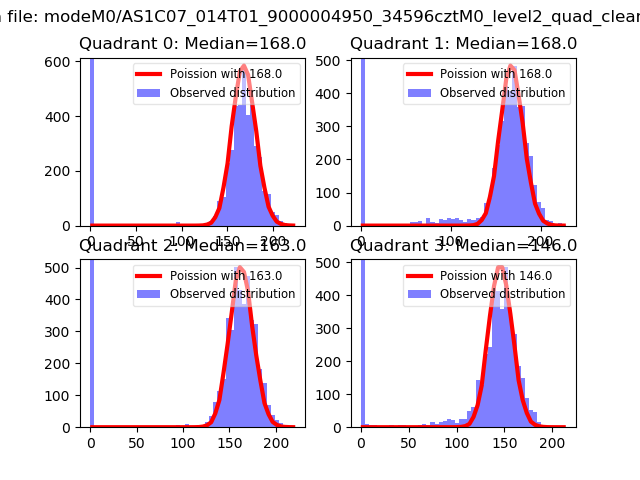 |
 |
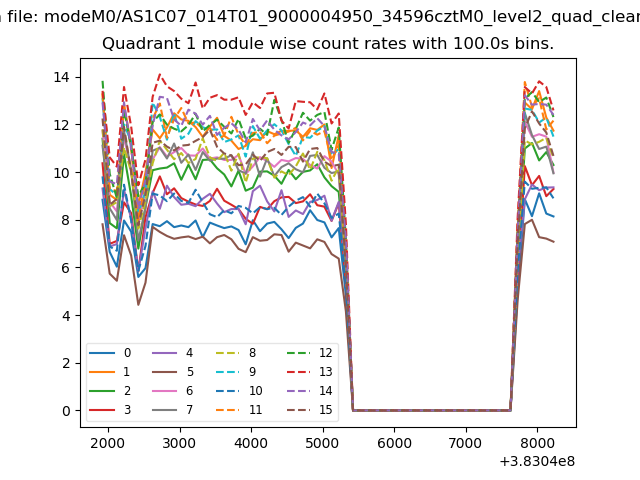
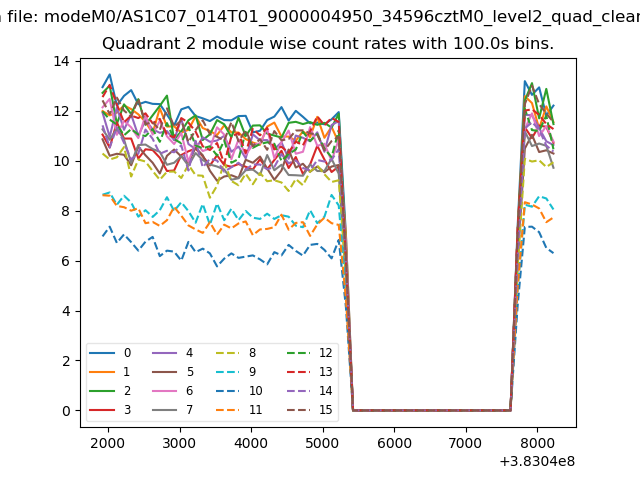
| Quadrant-wise count rates Data is divided into 100 sec bins |
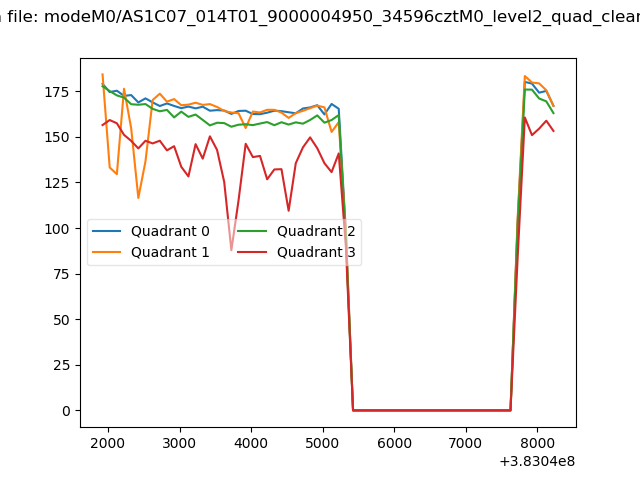 |
|
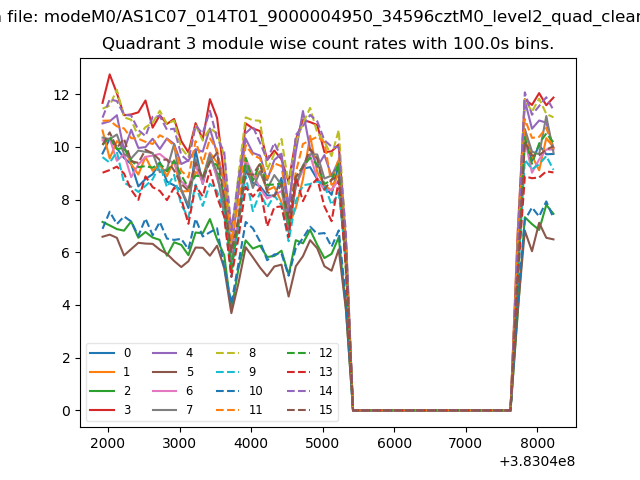
| Module-wise count rates for Quadrant A Data is divided into 100 sec bins |
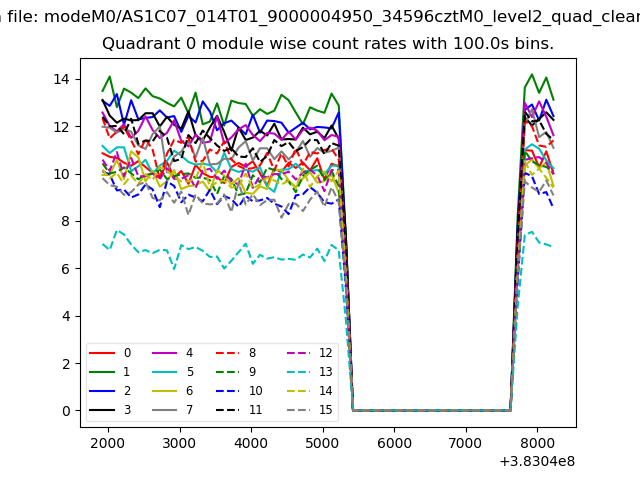 |
 |
| Module-wise count rates for Quadrant B Data is divided into 100 sec bins |
 |
 |
| Module-wise count rates for Quadrant C Data is divided into 100 sec bins |
 |
 |
| Module-wise count rates for Quadrant D Data is divided into 100 sec bins |
 |
 |
| Parameter | Plot |
|---|---|
| CZT HV Monitor | 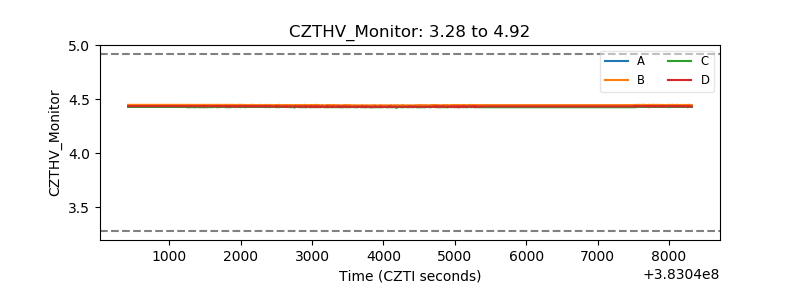 |
| D_VDD | 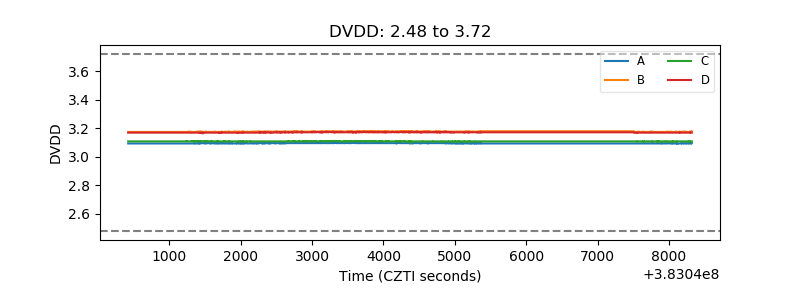 |
| Temperature 1 | 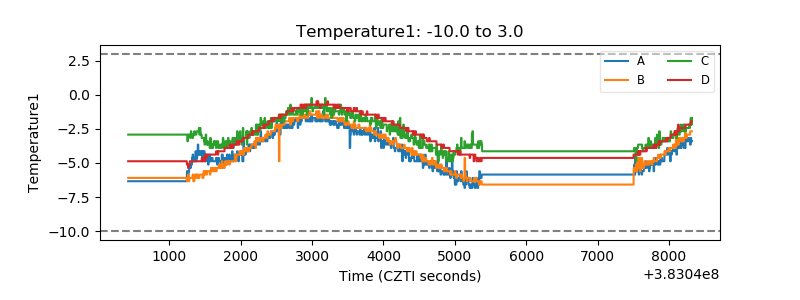 |
| Veto HV Monitor | 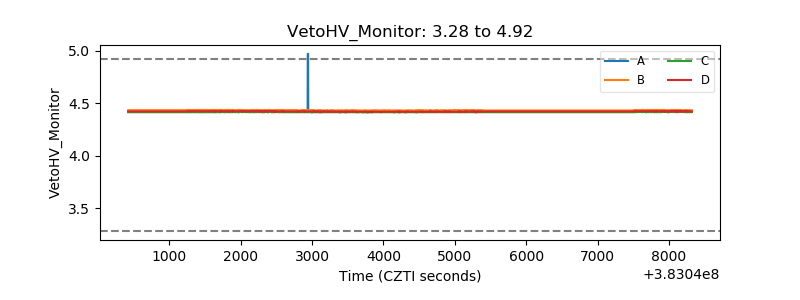 |
| Veto LLD | 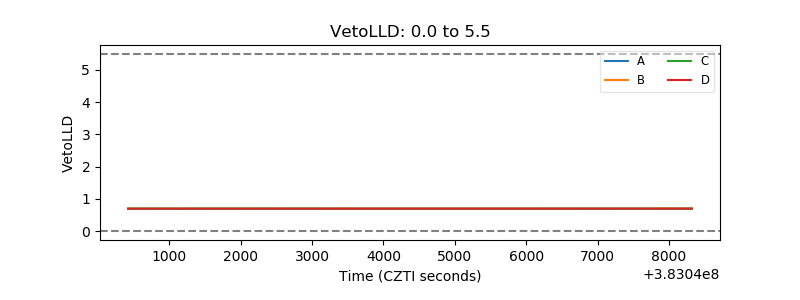 |
| Alpha Counter | 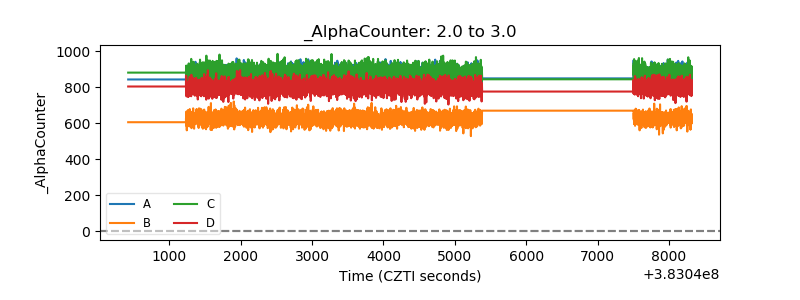 |
| _CPM_Rate | 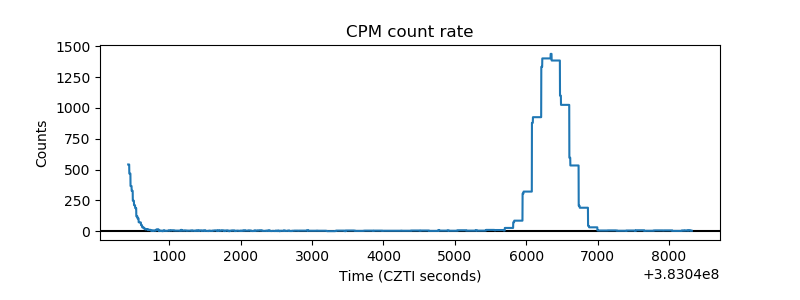 |
| CZT Counter | 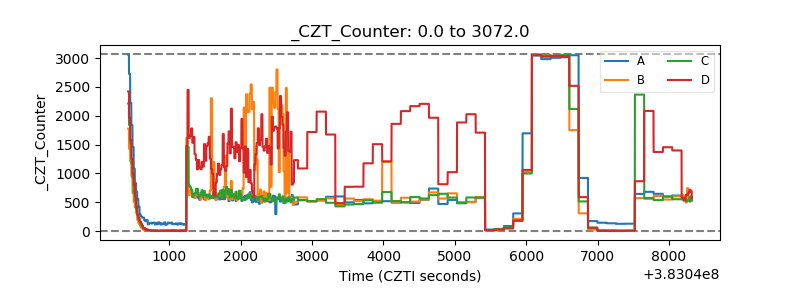 |
| +2.5 Volts monitor | 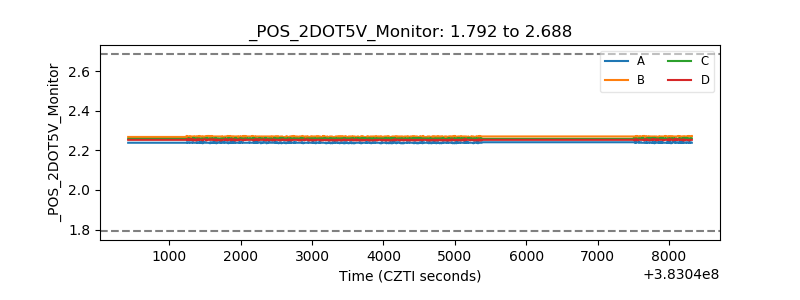 |
| +5 Volts monitor | 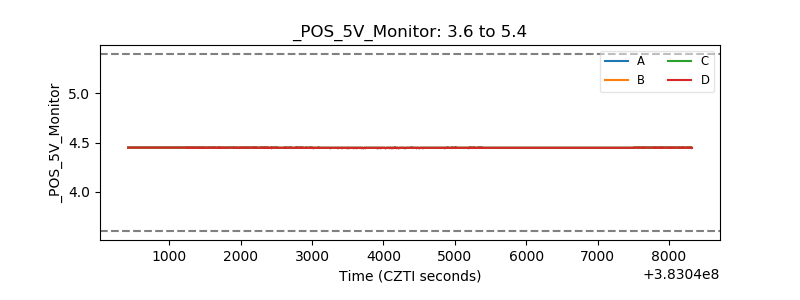 |
| _ROLL_ROT | 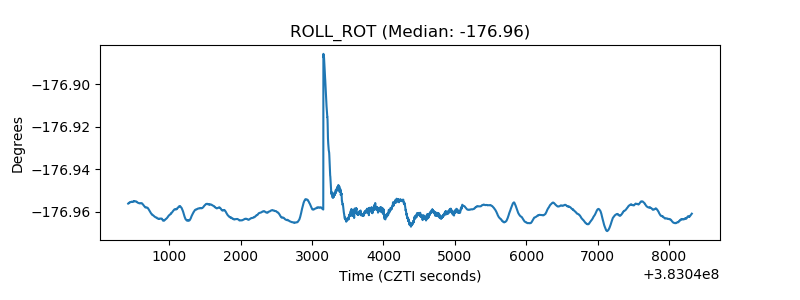 |
| _Roll_DEC | 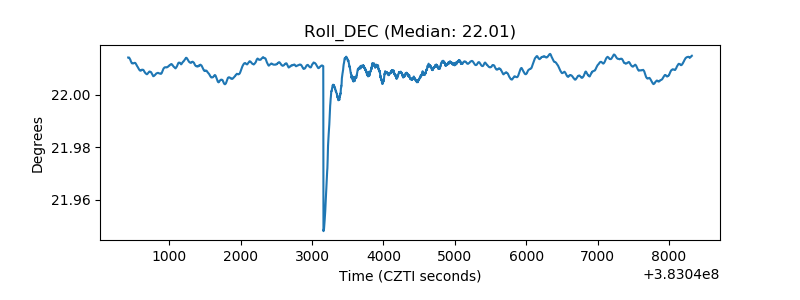 |
| _Roll_RA | 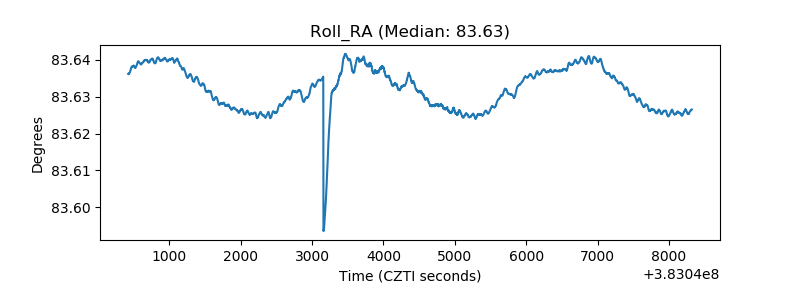 |
| Veto Counter | 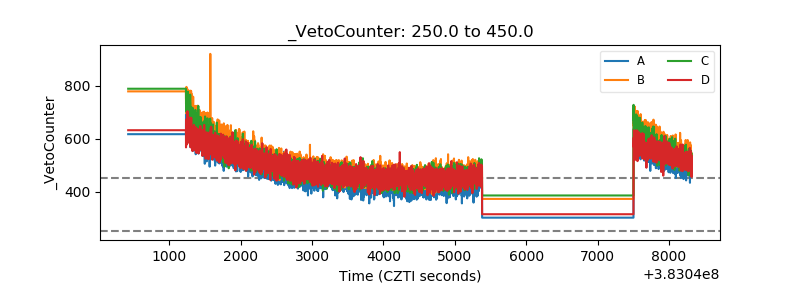 |