| Param | Original file | Final file |
|---|---|---|
| Filename | modeM0/AS1C07_014T01_9000004950_34595cztM0_level2.evt | modeM0/AS1C07_014T01_9000004950_34595cztM0_level2_quad_clean.evt |
| Size (bytes) | 478,157,760 | 77,978,880 |
| Size | 456.0 MB | 74.4 MB |
| Events in quadrant A | 2,757,586 | 522,671 |
| Events in quadrant B | 3,499,658 | 518,248 |
| Events in quadrant C | 2,983,430 | 508,044 |
| Events in quadrant D | 4,901,440 | 461,579 |
| Mode SS | |||
|---|---|---|---|
| Quadrant | BADHDUFLAG | Total packets | Discarded packets |
| A | 0 | 100 | 0 |
| B | 0 | 100 | 0 |
| C | 0 | 100 | 0 |
| D | 0 | 100 | 0 |
| Mode M9 | |||
|---|---|---|---|
| Quadrant | BADHDUFLAG | Total packets | Discarded packets |
| A | 0 | 28 | 0 |
| B | 0 | 28 | 0 |
| C | 0 | 28 | 0 |
| D | 0 | 29 | 0 |
| Mode M0 | |||
|---|---|---|---|
| Quadrant | BADHDUFLAG | Total packets | Discarded packets |
| A | 0 | 10930 | 3 |
| B | 0 | 13657 | 2 |
| C | 0 | 11932 | 2 |
| D | 0 | 18206 | 2 |
| Quadrant | Total seconds | Saturated seconds | Saturation percentage |
|---|---|---|---|
| A | 5009 | 9 | 0.179677% |
| B | 5009 | 208 | 4.152525% |
| C | 5009 | 39 | 0.778599% |
| D | 5009 | 256 | 5.110801% |
Noise dominated data is calculated using 1-second bins in cleaned event files. If a bin has >2000 counts, and if more than 50% of those come from <1% of pixels, then it is considered to be noise-dominated and hence unusable.
| Quadrant | # 1 sec bins | Bins with >0 counts | Bins with >2000 counts | High rate bins dominated by noise | Noise dominated (total time) | Noise dominated (detector-on time) | Marked lightcurve |
|---|---|---|---|---|---|---|---|
| A | 7041 | 5010 | 0 | 0 | 0.00% | 0.00% | 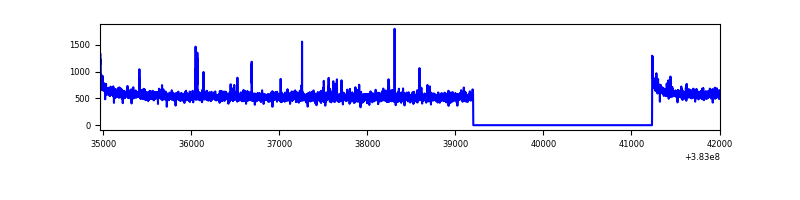 |
| B | 7041 | 5010 | 139 | 139 | 1.97% | 2.77% | 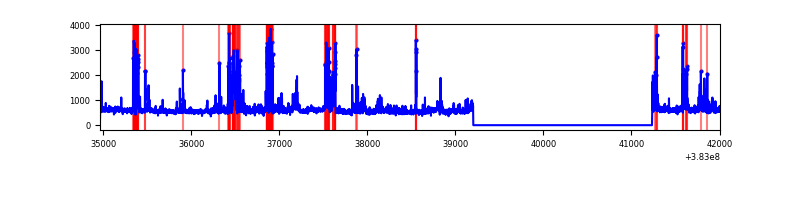 |
| C | 7041 | 5010 | 29 | 29 | 0.41% | 0.58% | 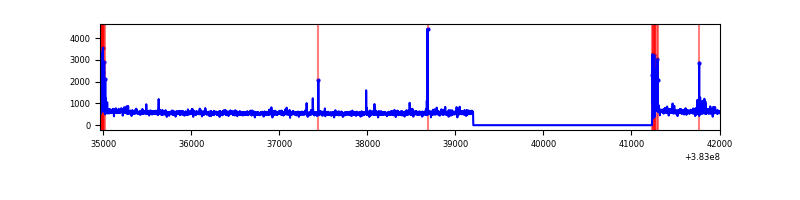 |
| D | 7041 | 5010 | 199 | 199 | 2.83% | 3.97% | 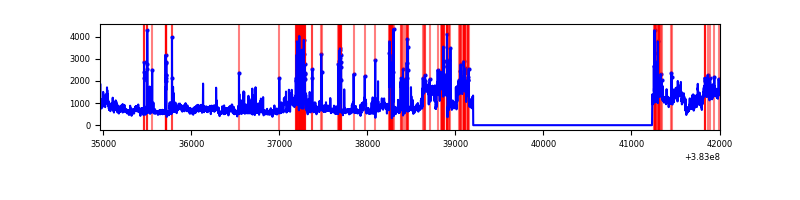 |
Top three noisy pixels from each quadrant. If the there are fewer than three noisy pixels in the level2.evt file, extra rows are filled as -1
| Pixel properties | Quadrant properties | ||||||
|---|---|---|---|---|---|---|---|
| Quadrant | DetID | PixID | Counts | Sigma | Mean | Median | Sigma |
| A | 10 | 83 | 43499 | 309.49 | 692 | 683 | 138.3 |
| A | 9 | 143 | 26113 | 183.82 | 692 | 683 | 138.3 |
| A | 13 | 254 | 11623 | 79.08 | 692 | 683 | 138.3 |
| B | 5 | 172 | 531378 | 4122.48 | 675 | 661 | 128.7 |
| B | 0 | 219 | 88334 | 681.02 | 675 | 661 | 128.7 |
| B | 15 | 222 | 67270 | 517.4 | 675 | 661 | 128.7 |
| C | 15 | 214 | 216827 | 1427.0 | 654 | 664 | 151.5 |
| C | 0 | 10 | 101037 | 662.61 | 654 | 664 | 151.5 |
| C | 14 | 67 | 45752 | 297.65 | 654 | 664 | 151.5 |
| D | 8 | 195 | 1501054 | 9486.94 | 646 | 631 | 158.2 |
| D | 13 | 249 | 237299 | 1496.41 | 646 | 631 | 158.2 |
| D | 1 | 52 | 193719 | 1220.87 | 646 | 631 | 158.2 |
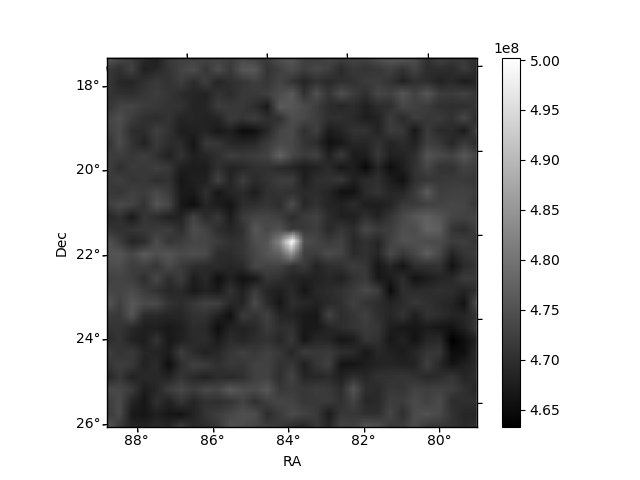
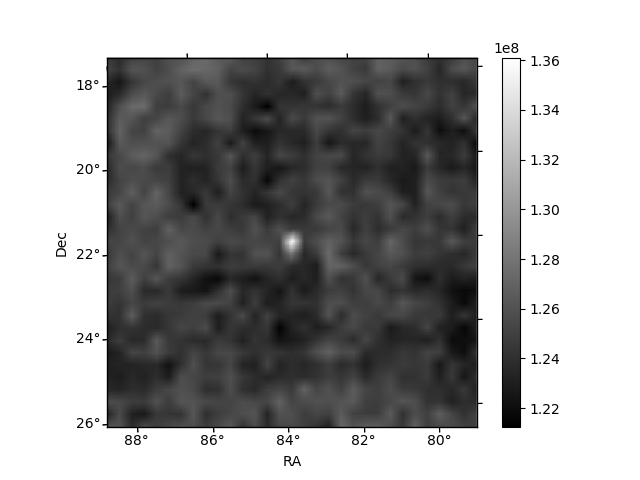
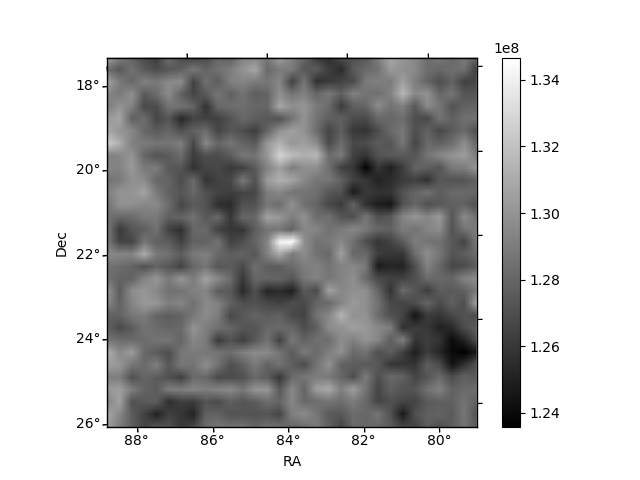
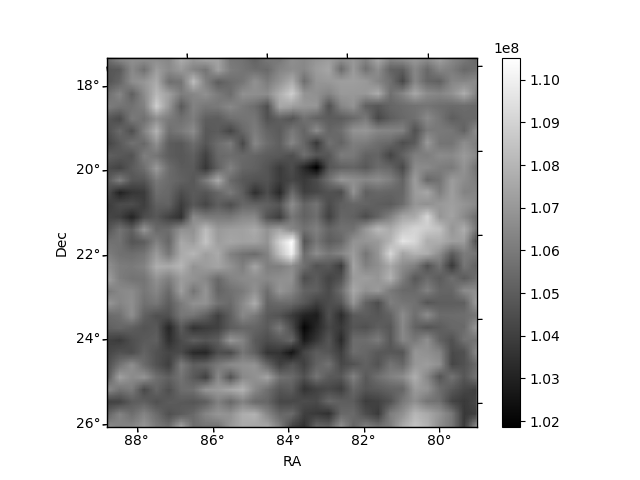
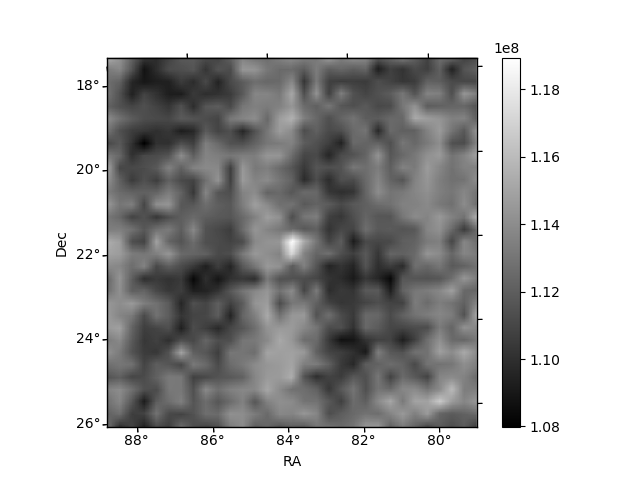
Histogram calculated using DETX and DETY for each event in the final _common_clean file
| Quadrant A | 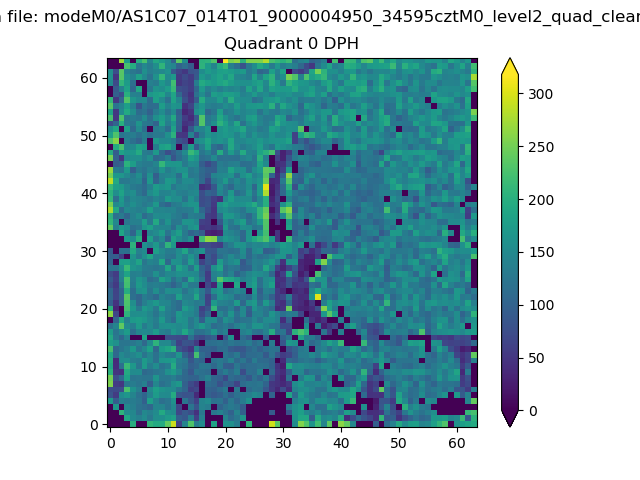 |
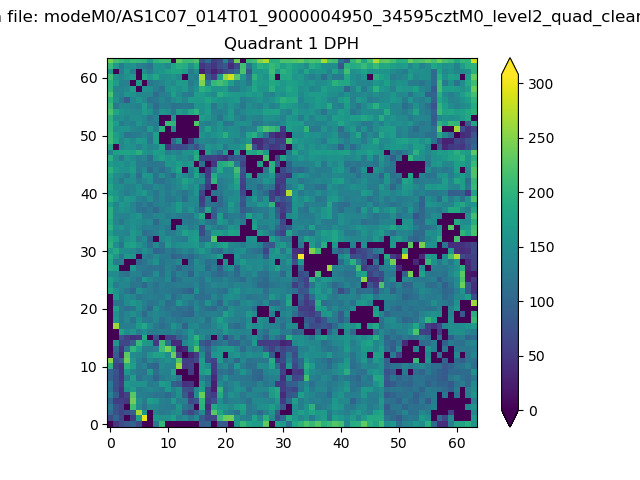 |
Quadrant B |
|---|---|---|---|
| Quadrant D | 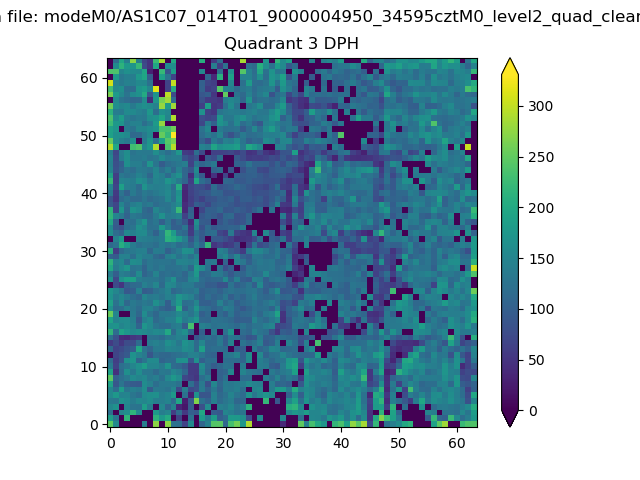 |
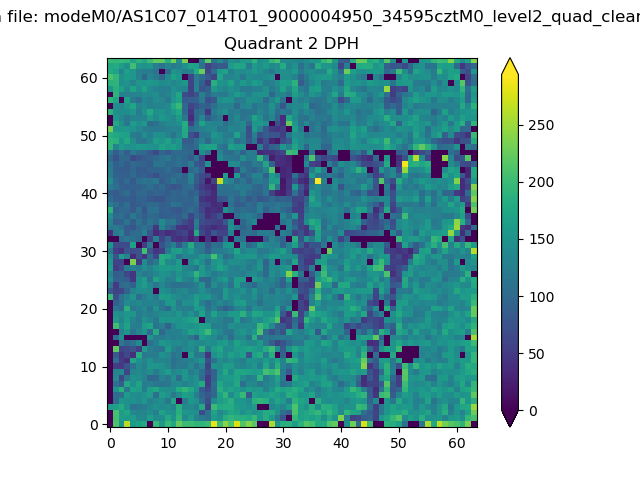 |
Quadrant C |
| Plot type | Count rate plots | Images |
|---|---|---|
| Comparison with Poisson distribution Blue bars denote a histogram of data divided into 1 sec bins. Red curve is a Poisson curve with rate = median count rate of data. |
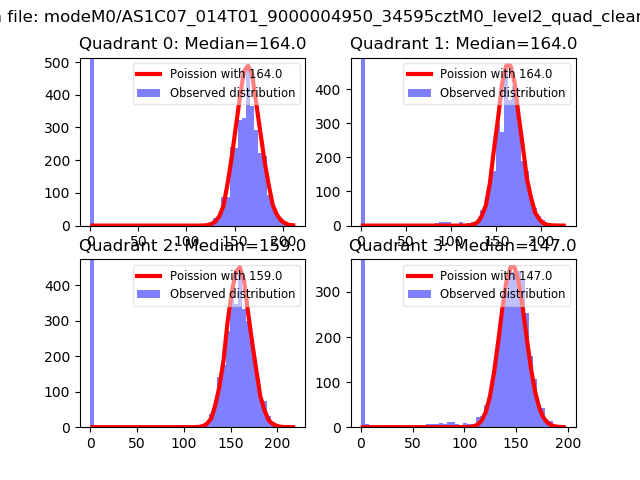 |
 |
| Quadrant-wise count rates Data is divided into 100 sec bins |
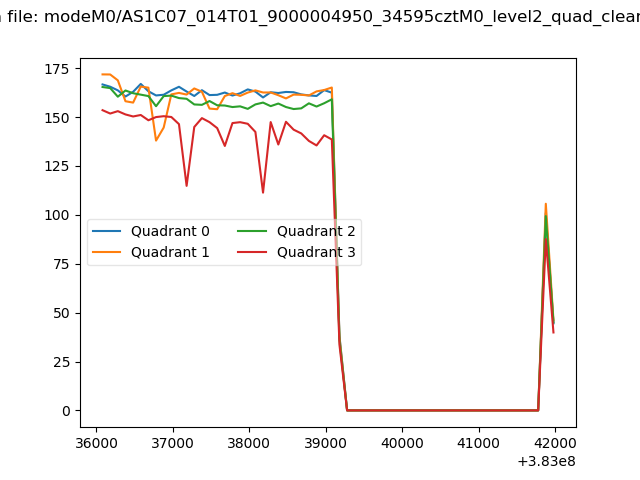 |
|
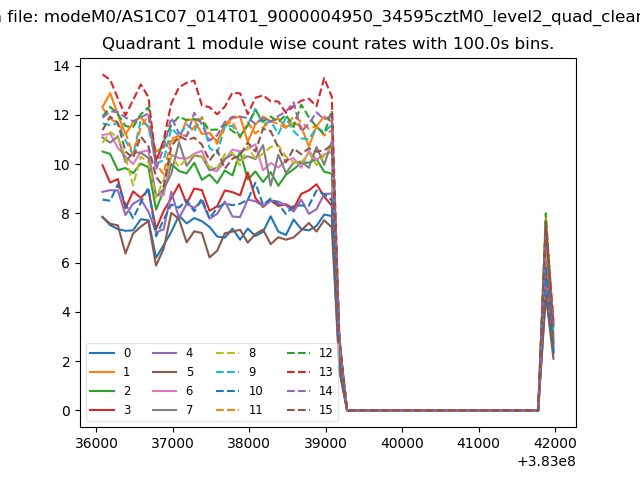
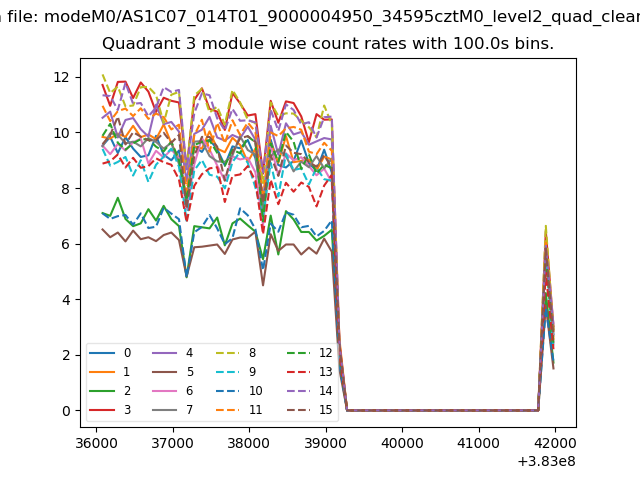
| Module-wise count rates for Quadrant A Data is divided into 100 sec bins |
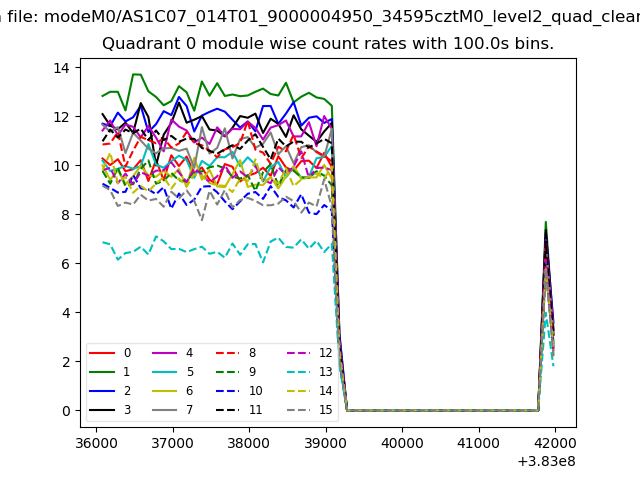 |
 |
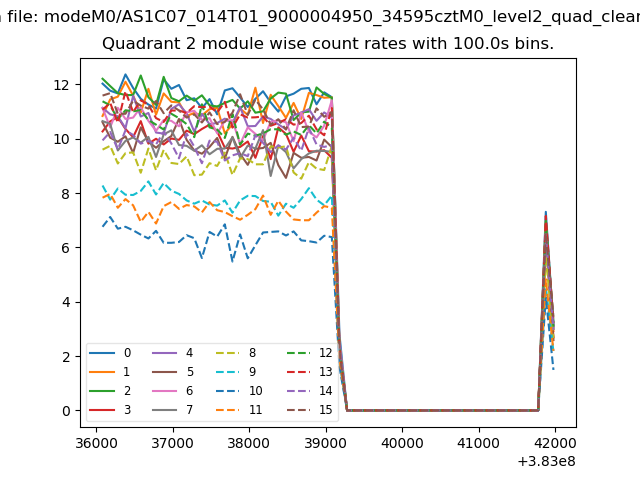
| Module-wise count rates for Quadrant B Data is divided into 100 sec bins |
 |
 |
| Module-wise count rates for Quadrant C Data is divided into 100 sec bins |
 |
 |
| Module-wise count rates for Quadrant D Data is divided into 100 sec bins |
 |
 |
| Parameter | Plot |
|---|---|
| CZT HV Monitor | 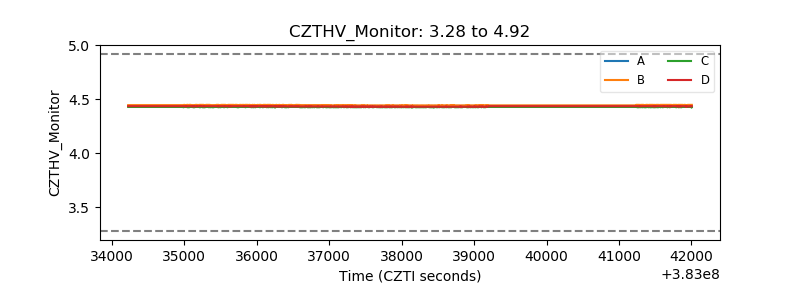 |
| D_VDD | 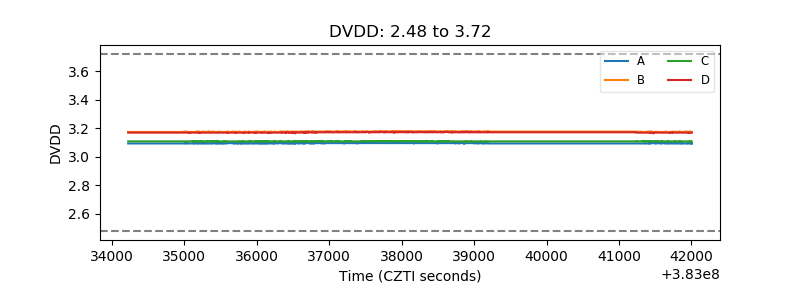 |
| Temperature 1 | 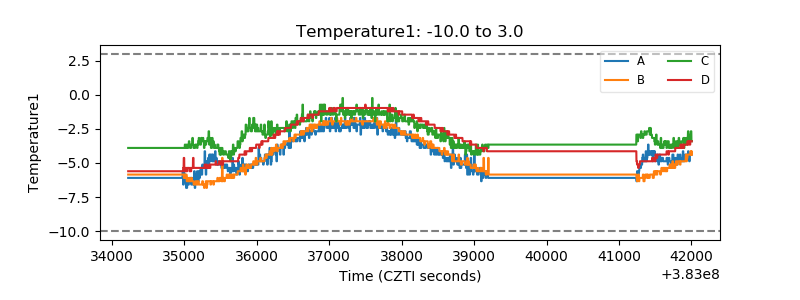 |
| Veto HV Monitor | 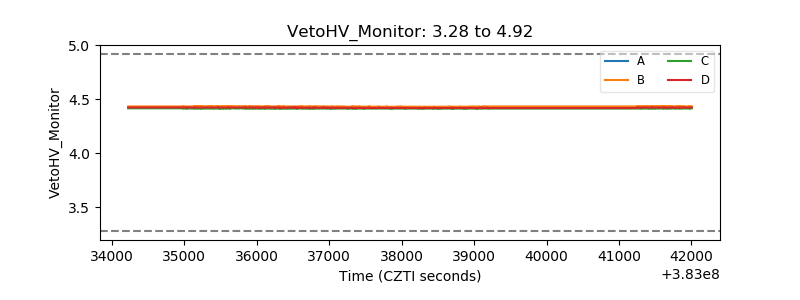 |
| Veto LLD | 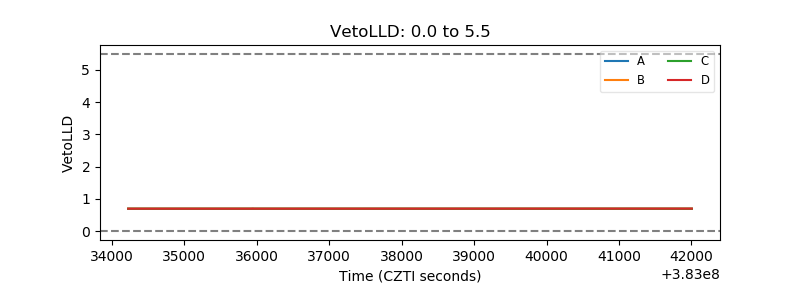 |
| Alpha Counter | 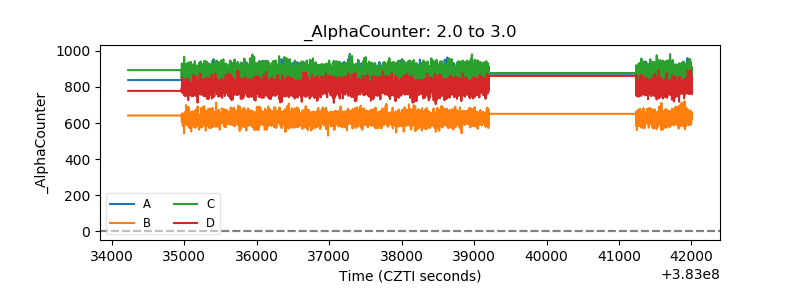 |
| _CPM_Rate | 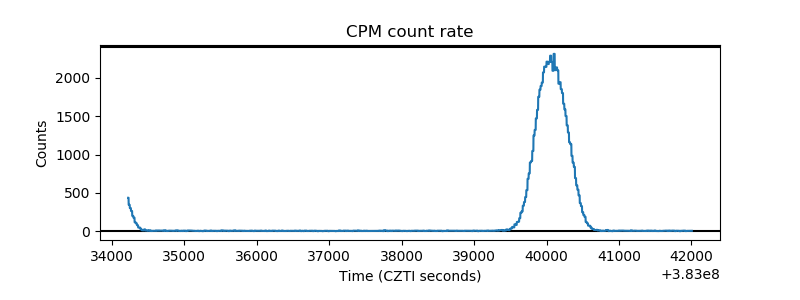 |
| CZT Counter | 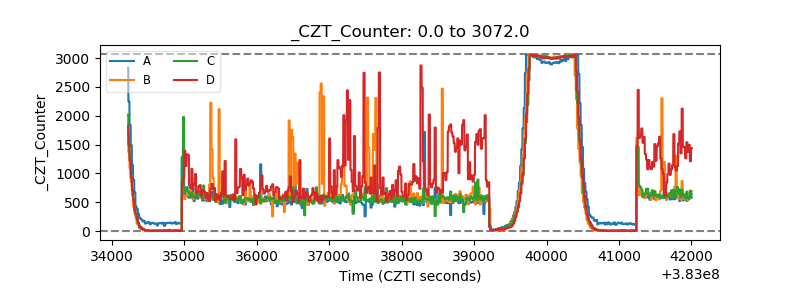 |
| +2.5 Volts monitor | 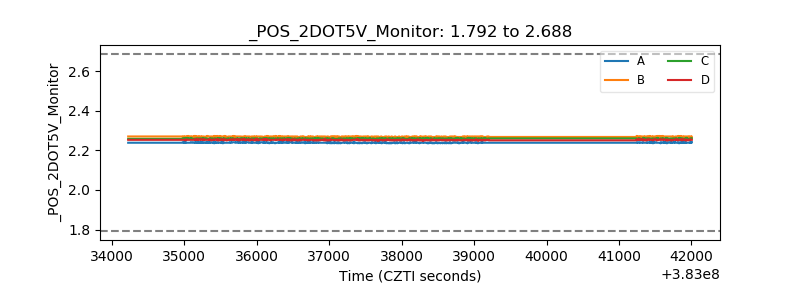 |
| +5 Volts monitor | 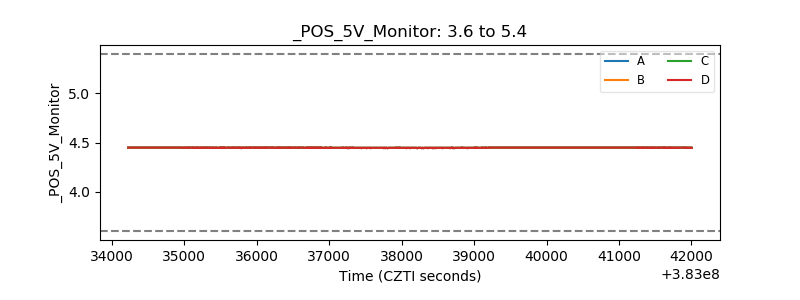 |
| _ROLL_ROT | 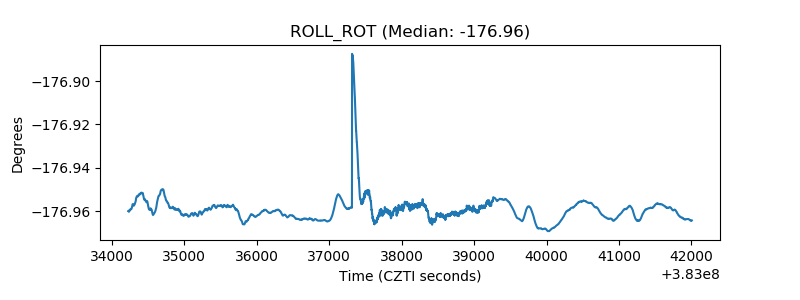 |
| _Roll_DEC | 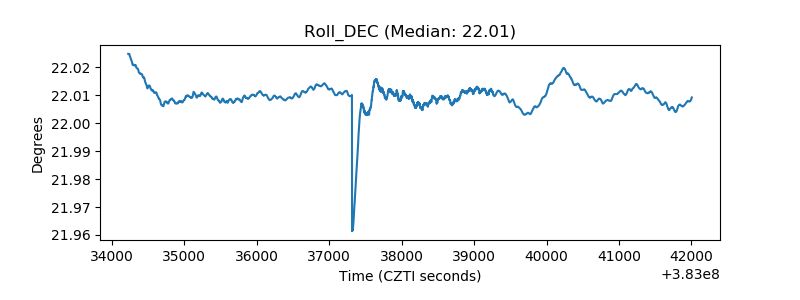 |
| _Roll_RA | 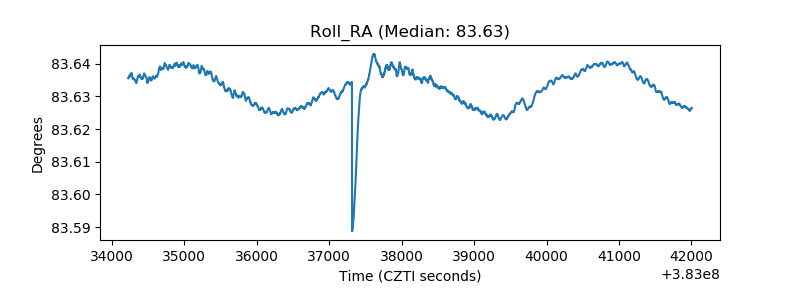 |
| Veto Counter | 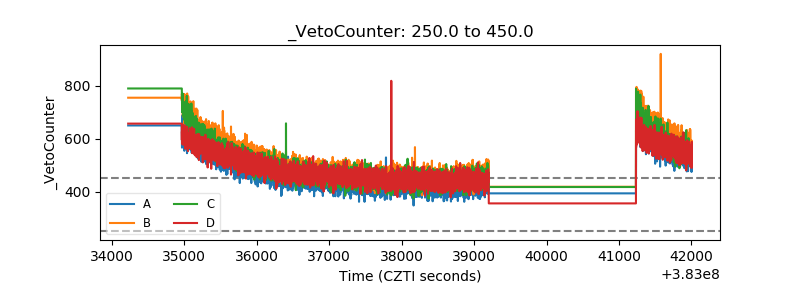 |