| Param | Original file | Final file |
|---|---|---|
| Filename | modeM0/AS1C07_014T01_9000004950_34594cztM0_level2.evt | modeM0/AS1C07_014T01_9000004950_34594cztM0_level2_quad_clean.evt |
| Size (bytes) | 435,101,760 | 68,227,200 |
| Size | 414.9 MB | 65.1 MB |
| Events in quadrant A | 2,697,612 | 439,279 |
| Events in quadrant B | 3,463,799 | 435,872 |
| Events in quadrant C | 2,980,997 | 430,555 |
| Events in quadrant D | 3,690,208 | 404,400 |
| Mode SS | |||
|---|---|---|---|
| Quadrant | BADHDUFLAG | Total packets | Discarded packets |
| A | 0 | 104 | 0 |
| B | 0 | 104 | 0 |
| C | 0 | 104 | 0 |
| D | 0 | 104 | 0 |
| Mode M9 | |||
|---|---|---|---|
| Quadrant | BADHDUFLAG | Total packets | Discarded packets |
| A | 0 | 26 | 0 |
| B | 0 | 26 | 0 |
| C | 0 | 26 | 0 |
| D | 0 | 27 | 0 |
| Mode M0 | |||
|---|---|---|---|
| Quadrant | BADHDUFLAG | Total packets | Discarded packets |
| A | 0 | 10796 | 3 |
| B | 0 | 13303 | 2 |
| C | 0 | 11906 | 2 |
| D | 0 | 14498 | 2 |
| Quadrant | Total seconds | Saturated seconds | Saturation percentage |
|---|---|---|---|
| A | 5073 | 20 | 0.394244% |
| B | 5073 | 294 | 5.795387% |
| C | 5073 | 29 | 0.571654% |
| D | 5073 | 56 | 1.103883% |
Noise dominated data is calculated using 1-second bins in cleaned event files. If a bin has >2000 counts, and if more than 50% of those come from <1% of pixels, then it is considered to be noise-dominated and hence unusable.
| Quadrant | # 1 sec bins | Bins with >0 counts | Bins with >2000 counts | High rate bins dominated by noise | Noise dominated (total time) | Noise dominated (detector-on time) | Marked lightcurve |
|---|---|---|---|---|---|---|---|
| A | 6985 | 5074 | 4 | 4 | 0.06% | 0.08% | 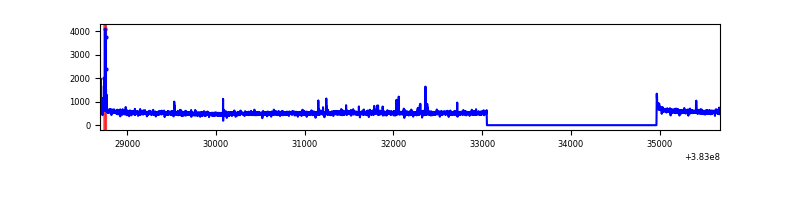 |
| B | 6985 | 5074 | 182 | 182 | 2.61% | 3.59% | 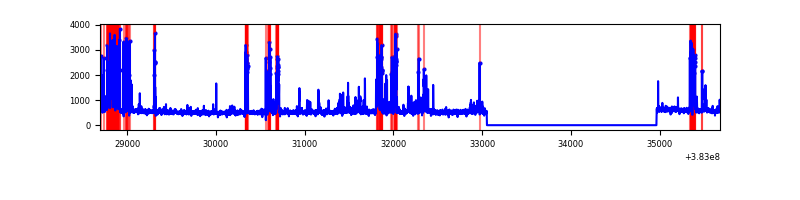 |
| C | 6985 | 5074 | 24 | 24 | 0.34% | 0.47% | 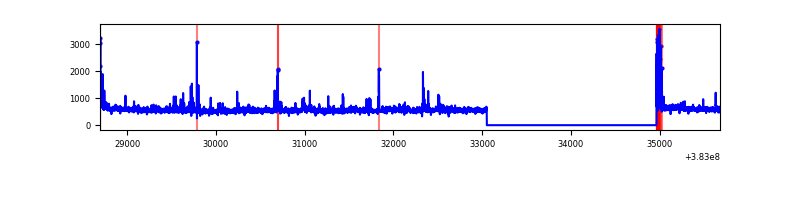 |
| D | 6985 | 5074 | 45 | 45 | 0.64% | 0.89% | 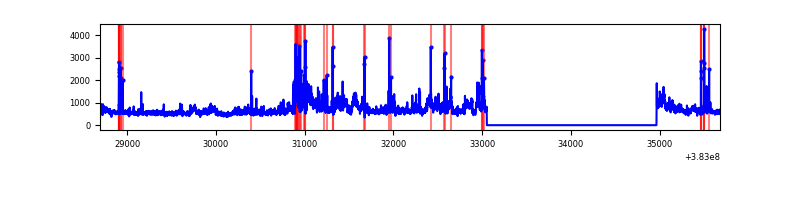 |
Top three noisy pixels from each quadrant. If the there are fewer than three noisy pixels in the level2.evt file, extra rows are filled as -1
| Pixel properties | Quadrant properties | ||||||
|---|---|---|---|---|---|---|---|
| Quadrant | DetID | PixID | Counts | Sigma | Mean | Median | Sigma |
| A | 9 | 143 | 45449 | 330.99 | 673 | 664 | 135.3 |
| A | 10 | 83 | 43190 | 314.29 | 673 | 664 | 135.3 |
| A | 13 | 254 | 10096 | 69.71 | 673 | 664 | 135.3 |
| B | 5 | 172 | 598649 | 4827.5 | 655 | 642 | 123.9 |
| B | 5 | 255 | 160410 | 1289.75 | 655 | 642 | 123.9 |
| B | 0 | 189 | 34118 | 270.24 | 655 | 642 | 123.9 |
| C | 15 | 214 | 216270 | 1450.0 | 642 | 650 | 148.7 |
| C | 0 | 10 | 84729 | 565.41 | 642 | 650 | 148.7 |
| C | 14 | 67 | 76104 | 507.41 | 642 | 650 | 148.7 |
| D | 8 | 195 | 815327 | 4751.6 | 637 | 625 | 171.5 |
| D | 5 | 223 | 91003 | 527.11 | 637 | 625 | 171.5 |
| D | 13 | 249 | 56076 | 323.41 | 637 | 625 | 171.5 |
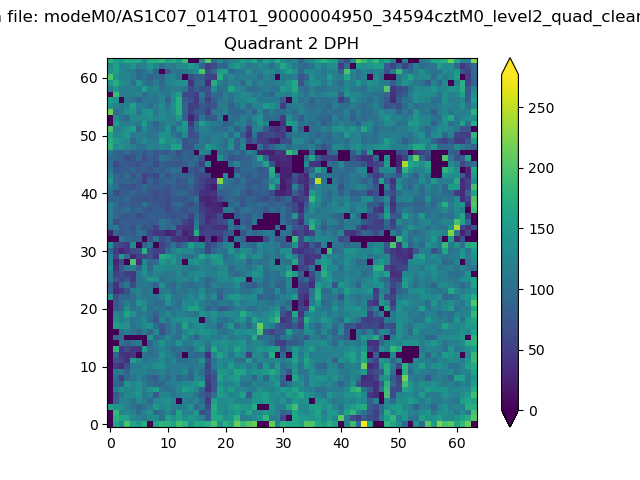
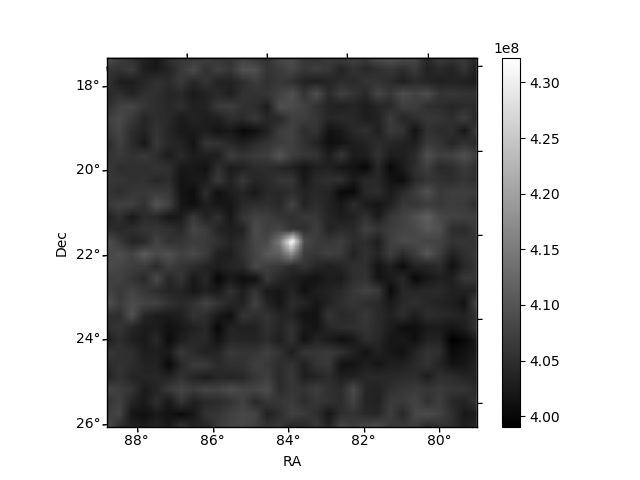
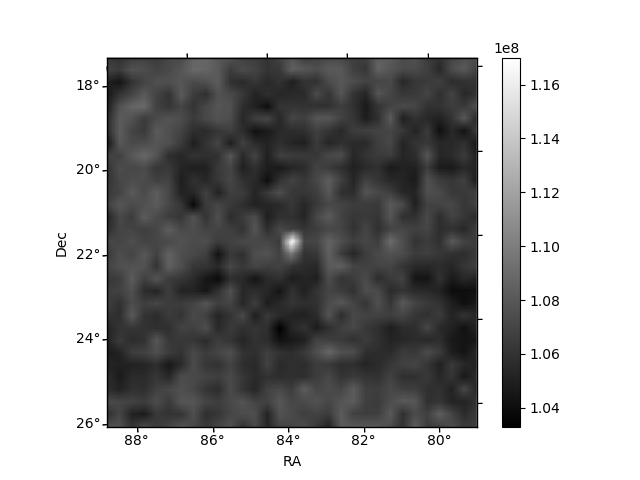
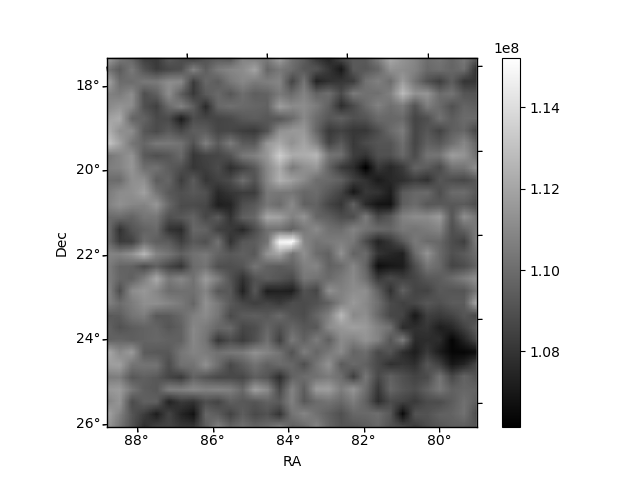
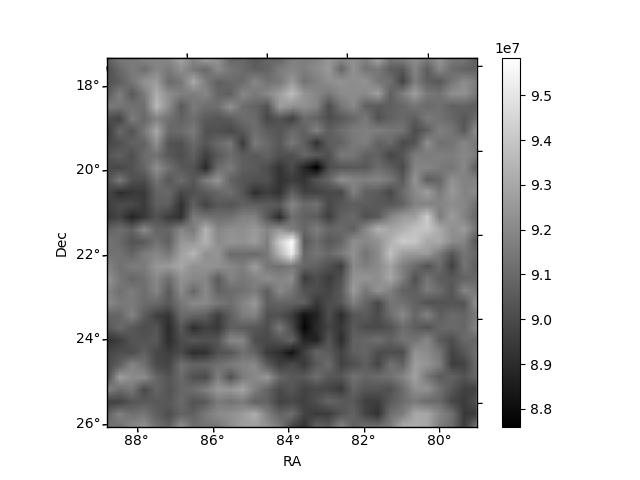
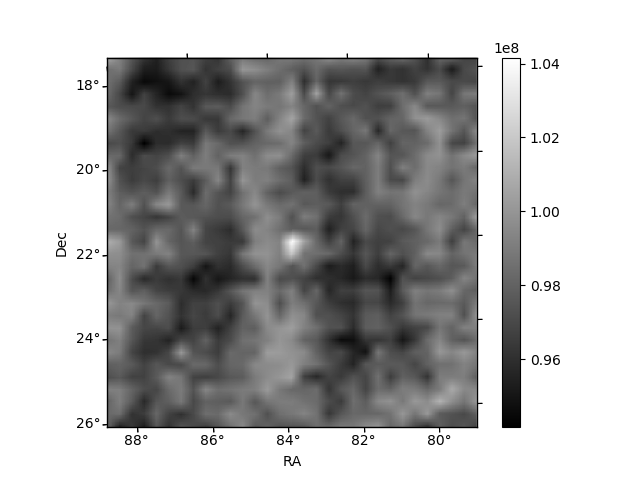
Histogram calculated using DETX and DETY for each event in the final _common_clean file
| Quadrant A | 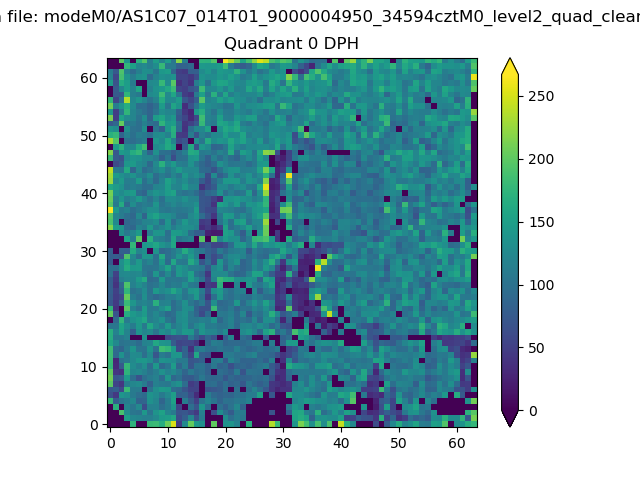 |
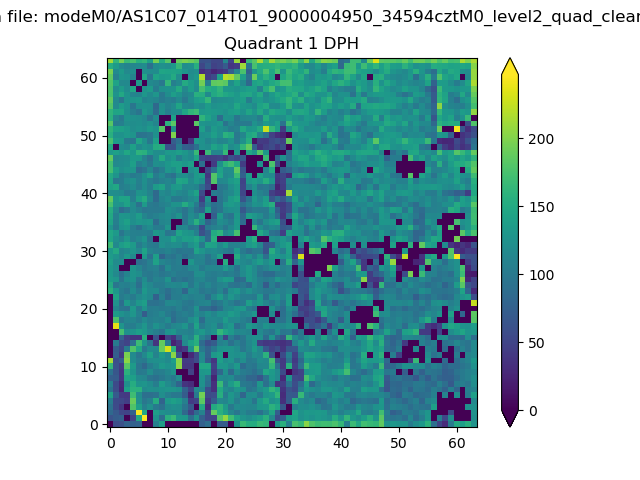 |
Quadrant B |
|---|---|---|---|
| Quadrant D | 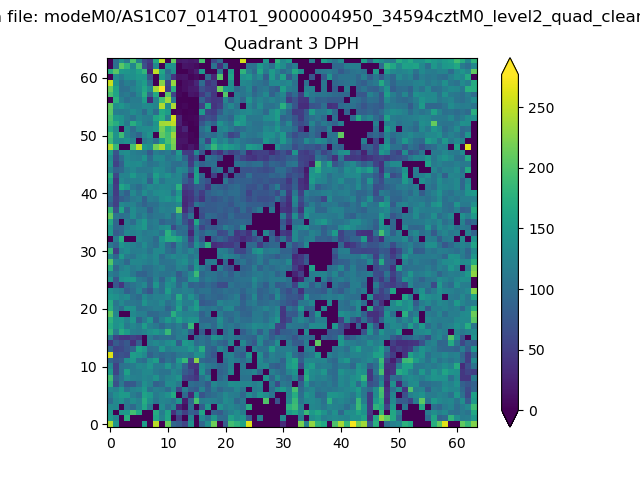 |
 |
Quadrant C |
| Plot type | Count rate plots | Images |
|---|---|---|
| Comparison with Poisson distribution Blue bars denote a histogram of data divided into 1 sec bins. Red curve is a Poisson curve with rate = median count rate of data. |
 |
 |
| Quadrant-wise count rates Data is divided into 100 sec bins |
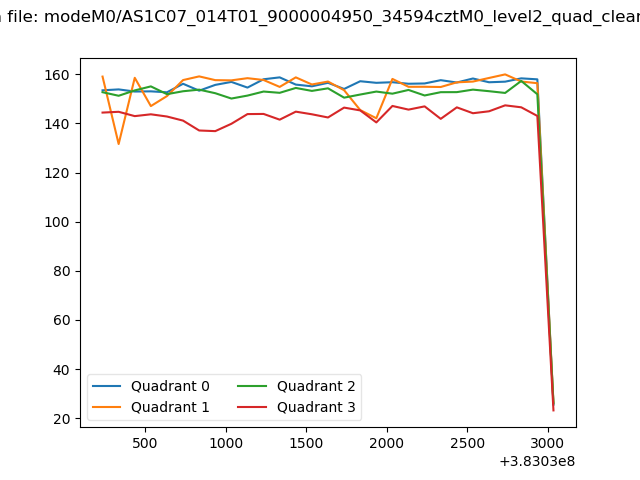 |
|
| Module-wise count rates for Quadrant A Data is divided into 100 sec bins |
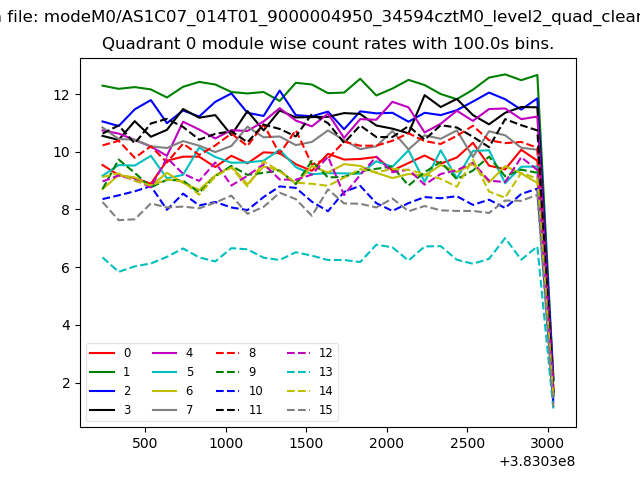 |
 |
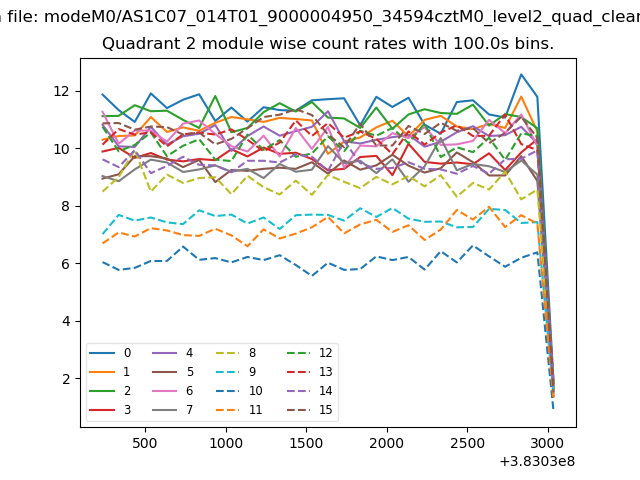
| Module-wise count rates for Quadrant B Data is divided into 100 sec bins |
 |
 |
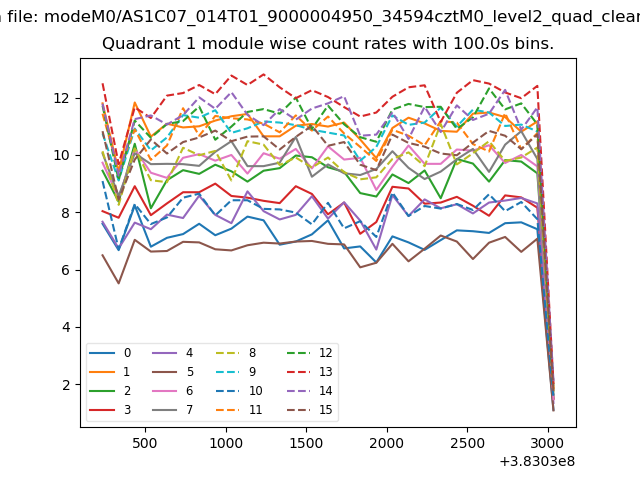
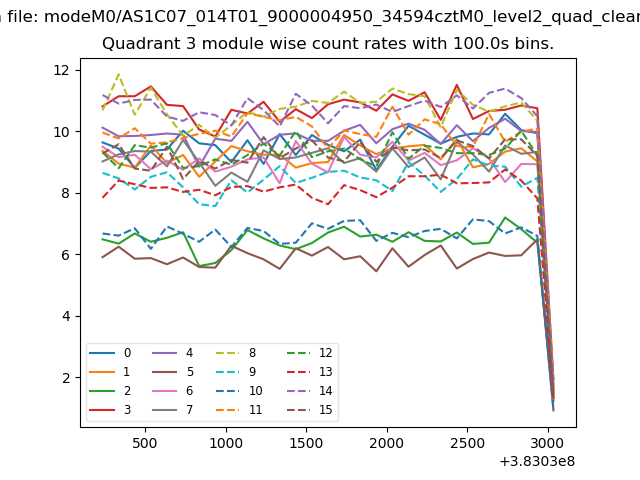
| Module-wise count rates for Quadrant C Data is divided into 100 sec bins |
 |
 |
| Module-wise count rates for Quadrant D Data is divided into 100 sec bins |
 |
 |
| Parameter | Plot |
|---|---|
| CZT HV Monitor | 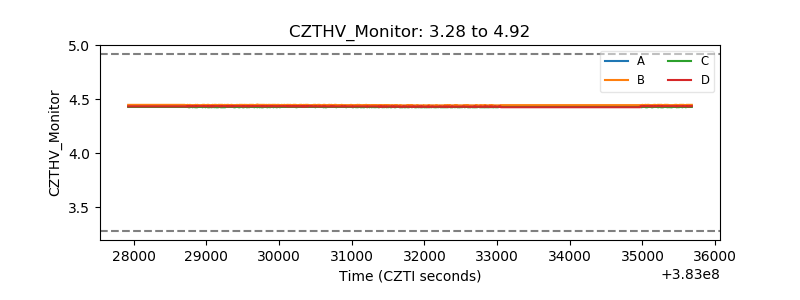 |
| D_VDD | 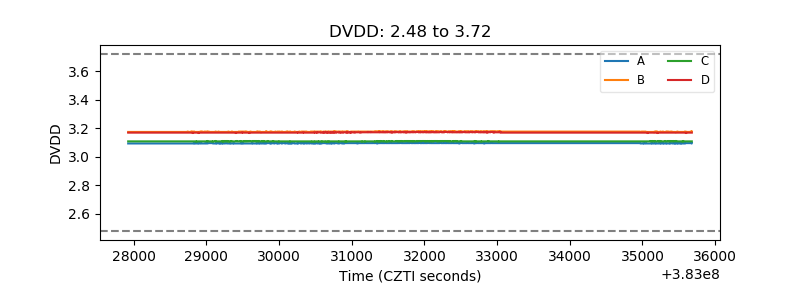 |
| Temperature 1 | 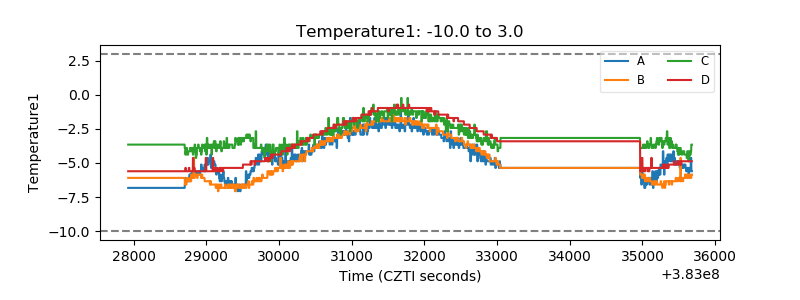 |
| Veto HV Monitor | 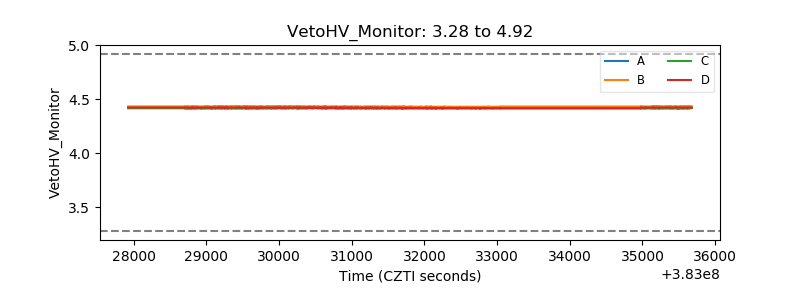 |
| Veto LLD | 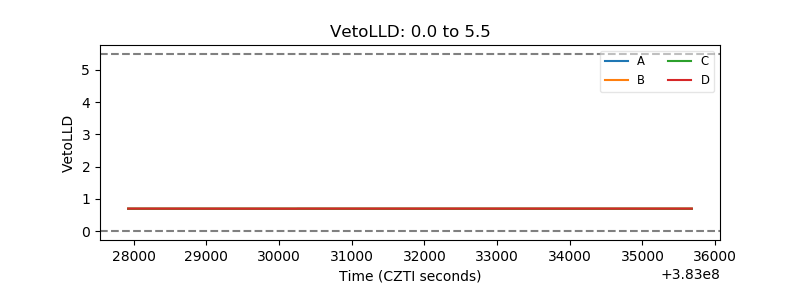 |
| Alpha Counter | 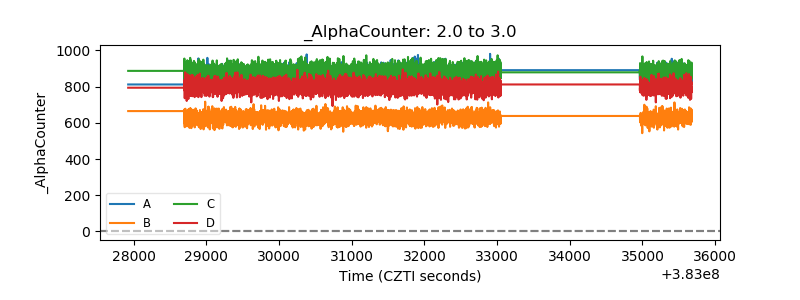 |
| _CPM_Rate | 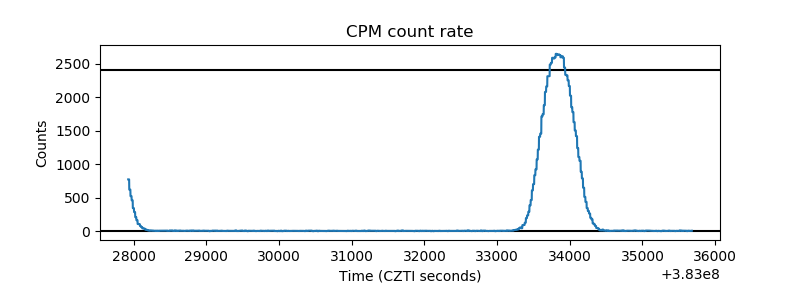 |
| CZT Counter | 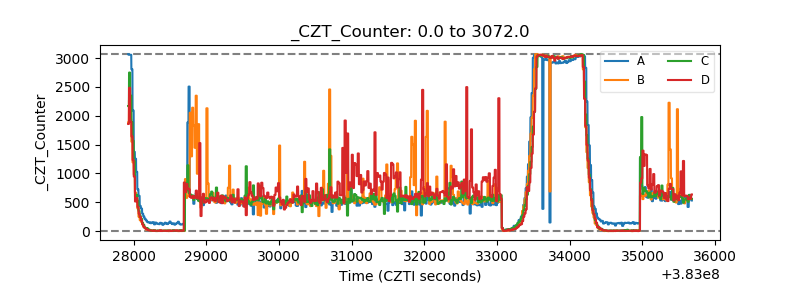 |
| +2.5 Volts monitor | 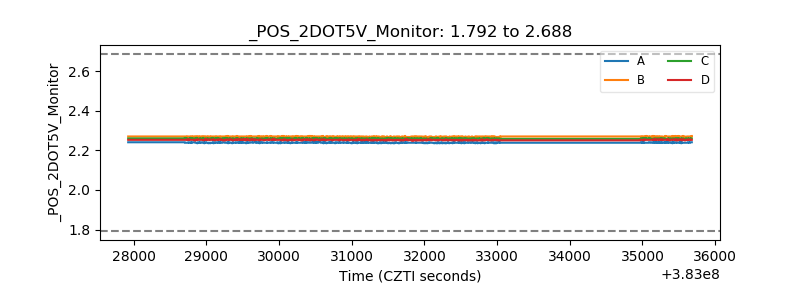 |
| +5 Volts monitor |  |
| _ROLL_ROT | 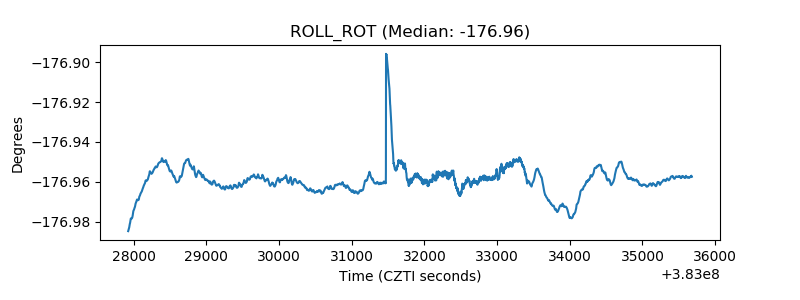 |
| _Roll_DEC | 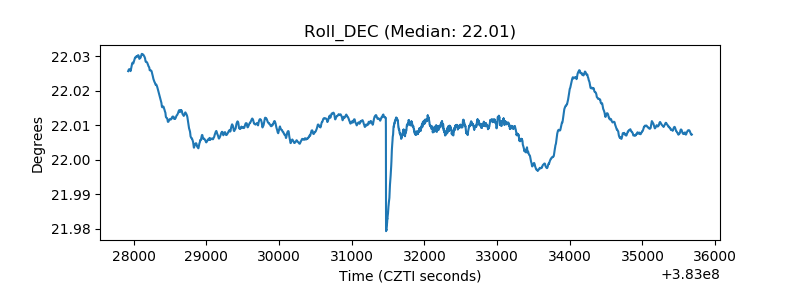 |
| _Roll_RA | 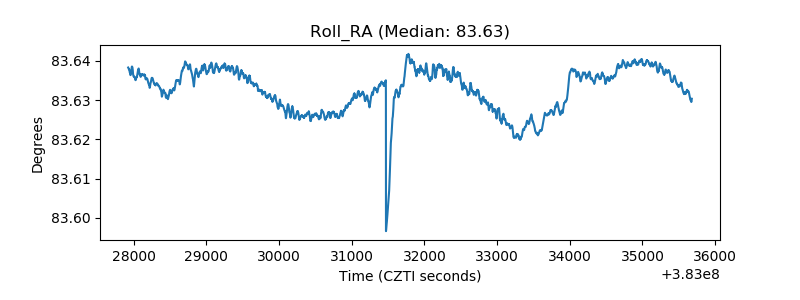 |
| Veto Counter | 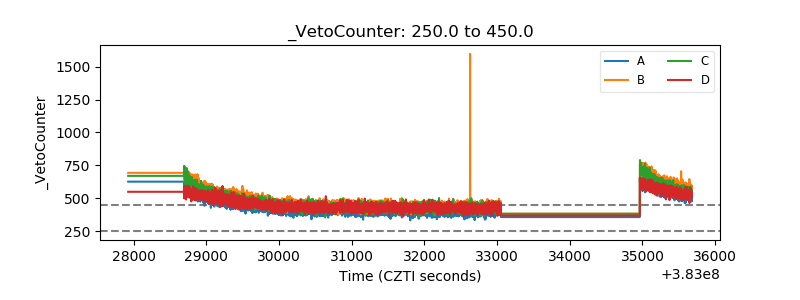 |