| Param | Original file | Final file |
|---|---|---|
| Filename | modeM0/AS1C07_014T01_9000004950_34593cztM0_level2.evt | modeM0/AS1C07_014T01_9000004950_34593cztM0_level2_quad_clean.evt |
| Size (bytes) | 530,017,920 | 60,171,840 |
| Size | 505.5 MB | 57.4 MB |
| Events in quadrant A | 2,794,734 | 374,083 |
| Events in quadrant B | 4,281,026 | 360,819 |
| Events in quadrant C | 3,017,775 | 370,256 |
| Events in quadrant D | 5,590,549 | 336,296 |
| Mode SS | |||
|---|---|---|---|
| Quadrant | BADHDUFLAG | Total packets | Discarded packets |
| A | 0 | 110 | 0 |
| B | 0 | 110 | 0 |
| C | 0 | 110 | 0 |
| D | 0 | 110 | 0 |
| Mode M9 | |||
|---|---|---|---|
| Quadrant | BADHDUFLAG | Total packets | Discarded packets |
| A | 0 | 19 | 0 |
| B | 0 | 19 | 0 |
| C | 0 | 19 | 0 |
| D | 0 | 20 | 0 |
| Mode M0 | |||
|---|---|---|---|
| Quadrant | BADHDUFLAG | Total packets | Discarded packets |
| A | 0 | 11408 | 3 |
| B | 0 | 16057 | 2 |
| C | 0 | 11998 | 2 |
| D | 0 | 20297 | 2 |
| Quadrant | Total seconds | Saturated seconds | Saturation percentage |
|---|---|---|---|
| A | 5432 | 20 | 0.368189% |
| B | 5432 | 557 | 10.254050% |
| C | 5432 | 20 | 0.368189% |
| D | 5432 | 156 | 2.871870% |
Noise dominated data is calculated using 1-second bins in cleaned event files. If a bin has >2000 counts, and if more than 50% of those come from <1% of pixels, then it is considered to be noise-dominated and hence unusable.
| Quadrant | # 1 sec bins | Bins with >0 counts | Bins with >2000 counts | High rate bins dominated by noise | Noise dominated (total time) | Noise dominated (detector-on time) | Marked lightcurve |
|---|---|---|---|---|---|---|---|
| A | 7224 | 5433 | 9 | 9 | 0.12% | 0.17% | 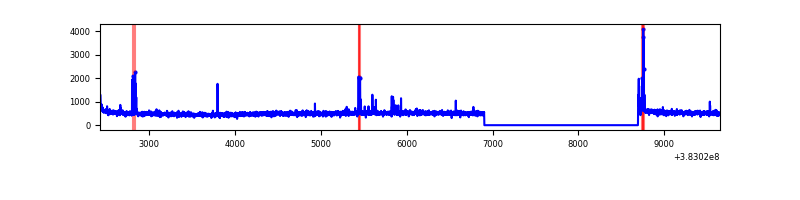 |
| B | 7224 | 5433 | 365 | 365 | 5.05% | 6.72% | 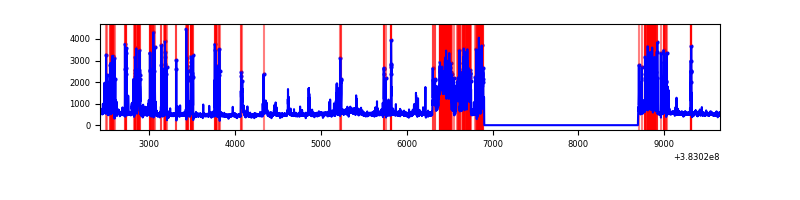 |
| C | 7224 | 5433 | 18 | 18 | 0.25% | 0.33% | 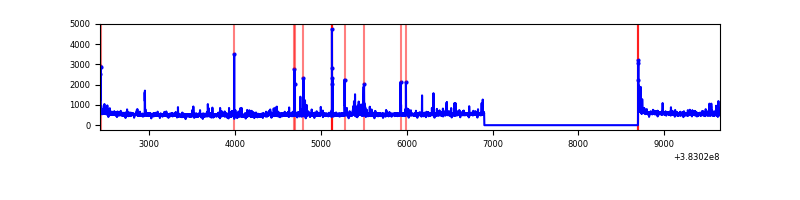 |
| D | 7224 | 5433 | 128 | 128 | 1.77% | 2.36% | 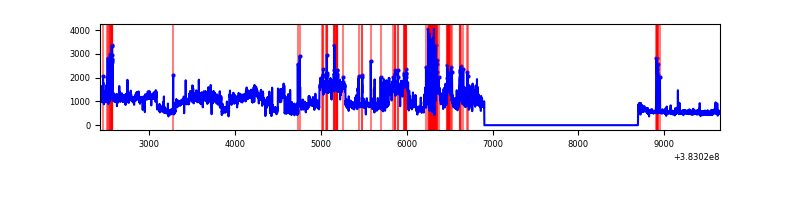 |
Top three noisy pixels from each quadrant. If the there are fewer than three noisy pixels in the level2.evt file, extra rows are filled as -1
| Pixel properties | Quadrant properties | ||||||
|---|---|---|---|---|---|---|---|
| Quadrant | DetID | PixID | Counts | Sigma | Mean | Median | Sigma |
| A | 9 | 143 | 87712 | 630.9 | 684 | 672 | 138.0 |
| A | 10 | 83 | 43676 | 311.71 | 684 | 672 | 138.0 |
| A | 4 | 48 | 15981 | 110.97 | 684 | 672 | 138.0 |
| B | 5 | 172 | 1587878 | 12618.38 | 659 | 643 | 125.8 |
| B | 0 | 190 | 31164 | 242.64 | 659 | 643 | 125.8 |
| B | 15 | 33 | 21901 | 169.0 | 659 | 643 | 125.8 |
| C | 15 | 214 | 231273 | 1502.41 | 661 | 668 | 153.5 |
| C | 0 | 207 | 117423 | 760.67 | 661 | 668 | 153.5 |
| C | 0 | 10 | 51600 | 331.83 | 661 | 668 | 153.5 |
| D | 8 | 195 | 2489328 | 15557.57 | 651 | 634 | 160.0 |
| D | 7 | 38 | 204819 | 1276.42 | 651 | 634 | 160.0 |
| D | 13 | 249 | 132628 | 825.13 | 651 | 634 | 160.0 |
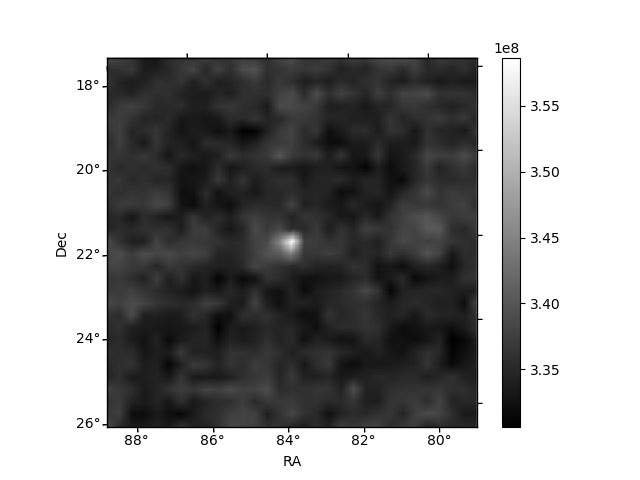
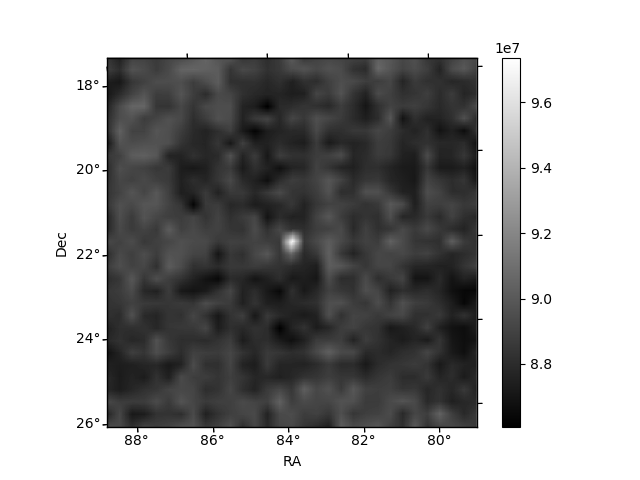
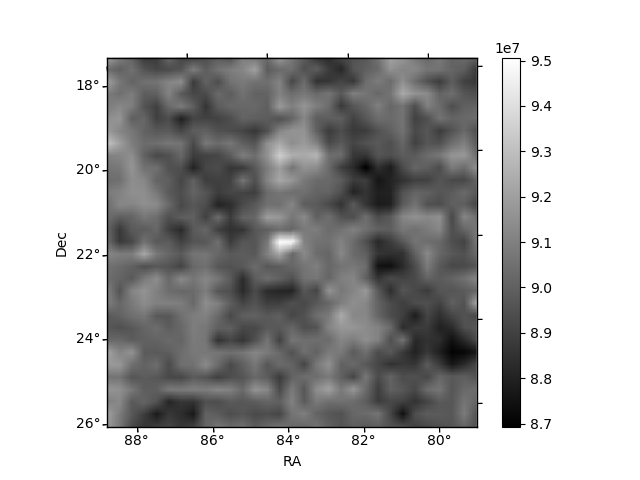
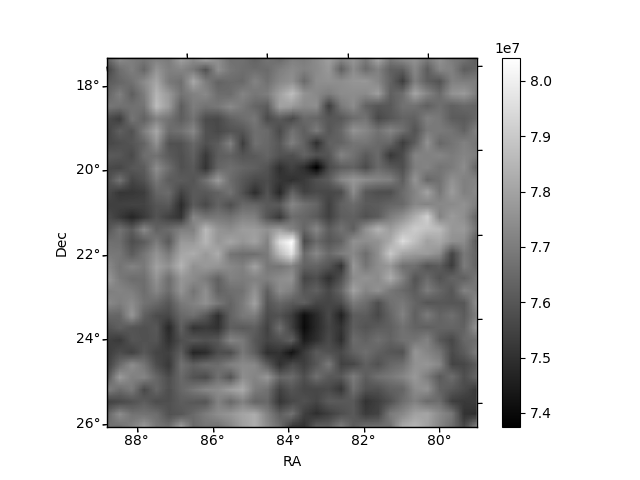
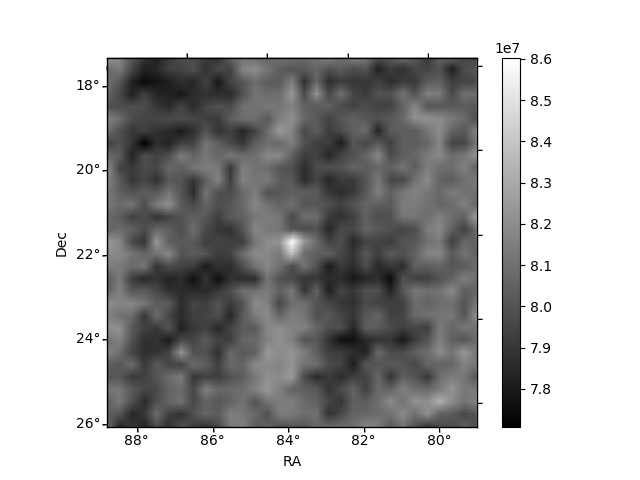
Histogram calculated using DETX and DETY for each event in the final _common_clean file
| Quadrant A | 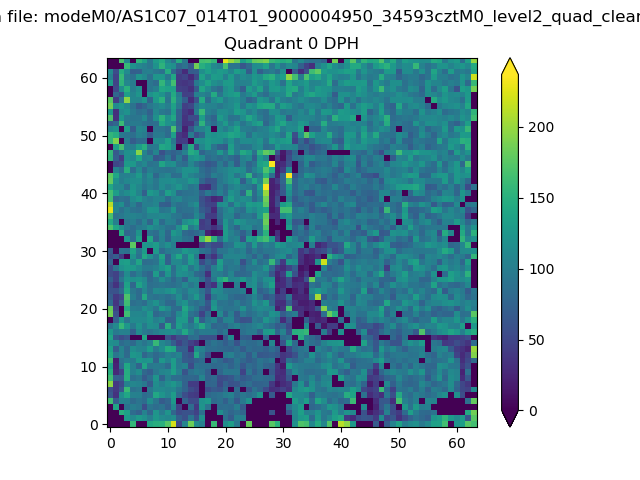 |
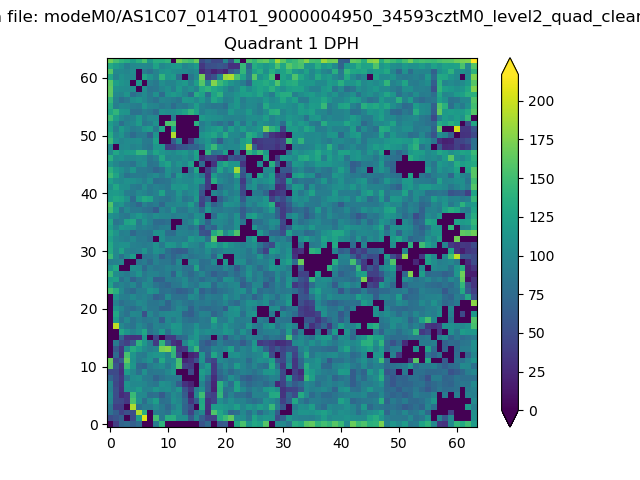 |
Quadrant B |
|---|---|---|---|
| Quadrant D | 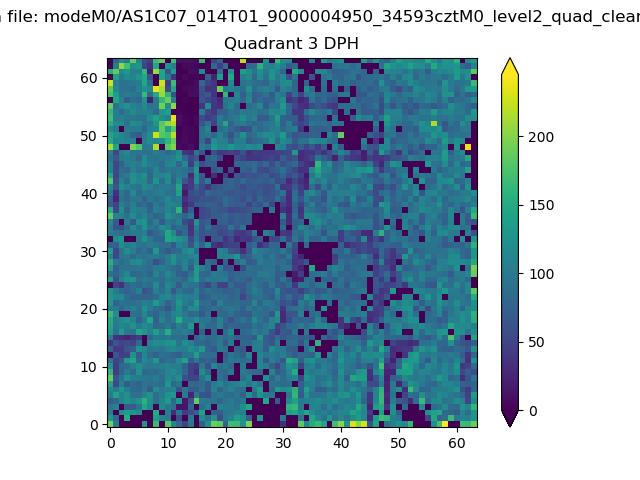 |
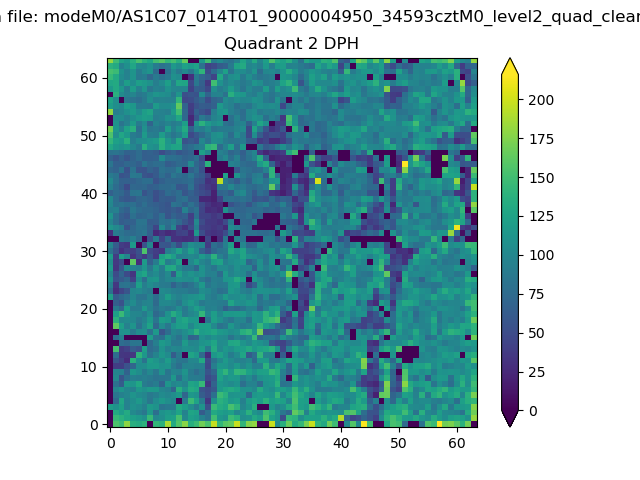 |
Quadrant C |
| Plot type | Count rate plots | Images |
|---|---|---|
| Comparison with Poisson distribution Blue bars denote a histogram of data divided into 1 sec bins. Red curve is a Poisson curve with rate = median count rate of data. |
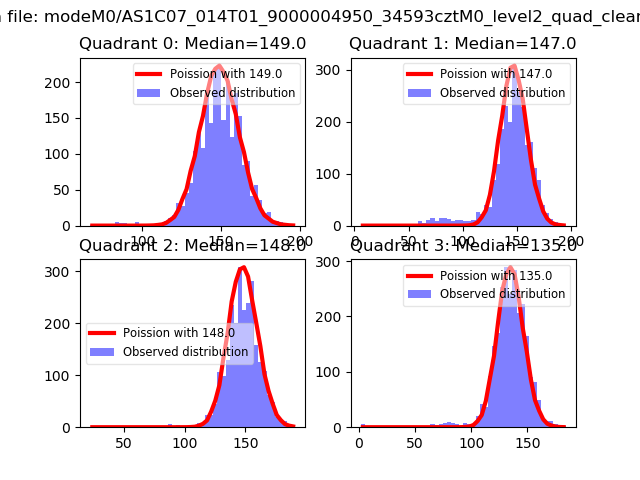 |
 |
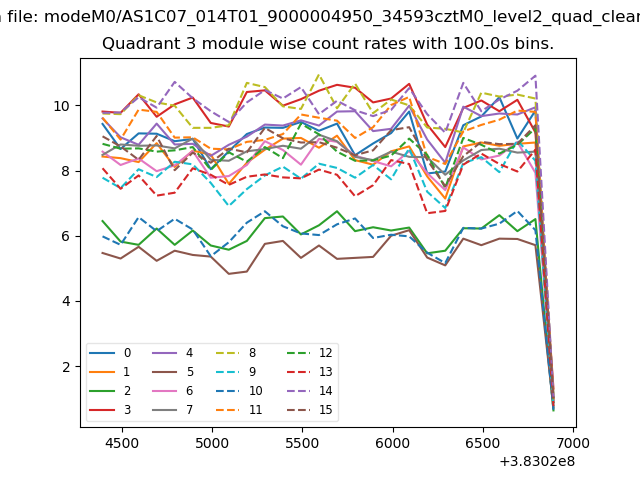
| Quadrant-wise count rates Data is divided into 100 sec bins |
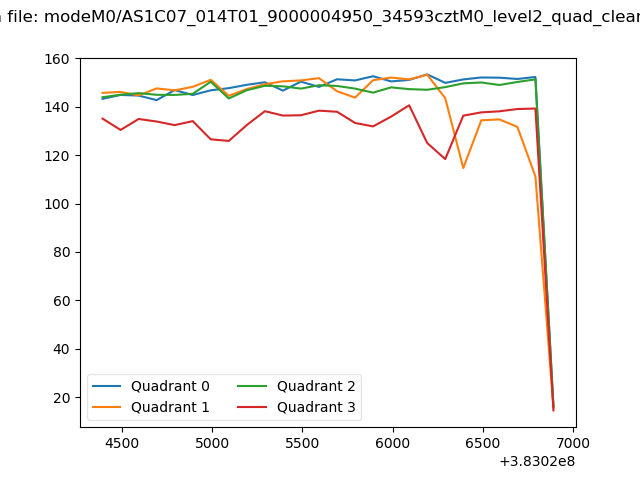 |
|
| Module-wise count rates for Quadrant A Data is divided into 100 sec bins |
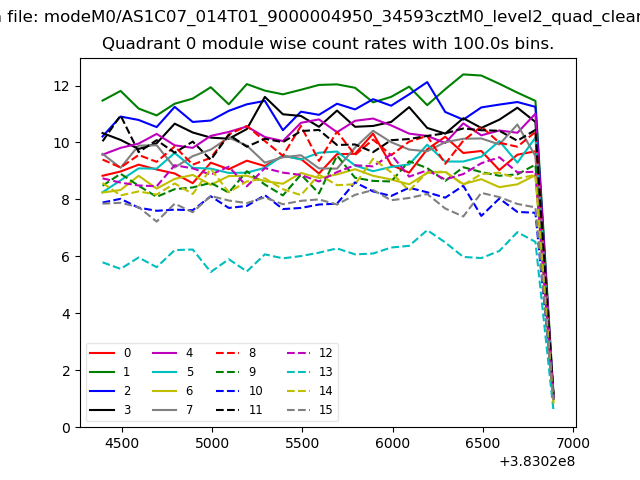 |
 |
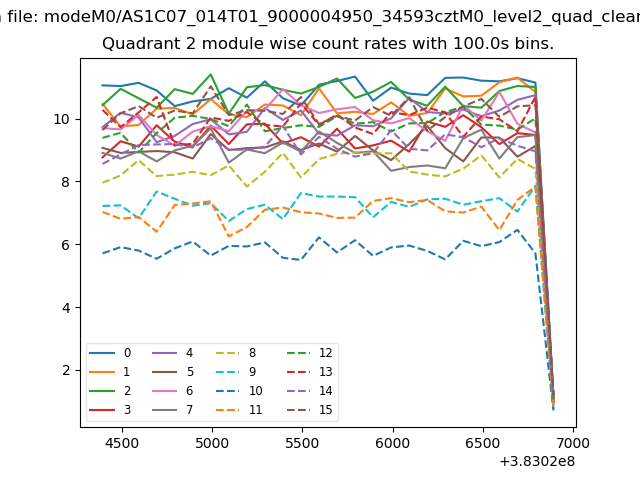
| Module-wise count rates for Quadrant B Data is divided into 100 sec bins |
 |
 |
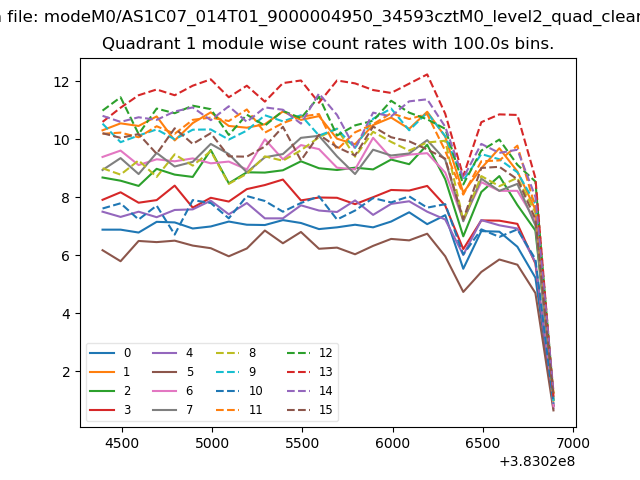
| Module-wise count rates for Quadrant C Data is divided into 100 sec bins |
 |
 |
| Module-wise count rates for Quadrant D Data is divided into 100 sec bins |
 |
 |
| Parameter | Plot |
|---|---|
| CZT HV Monitor | 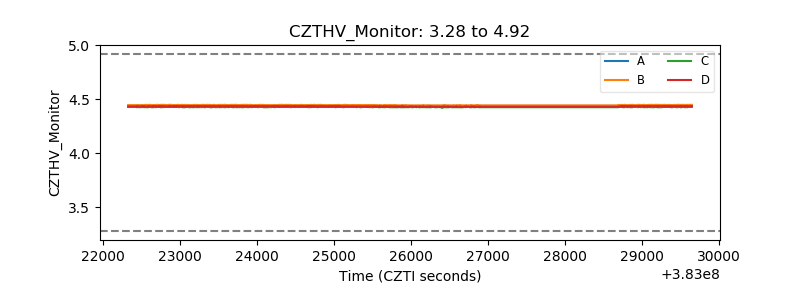 |
| D_VDD | 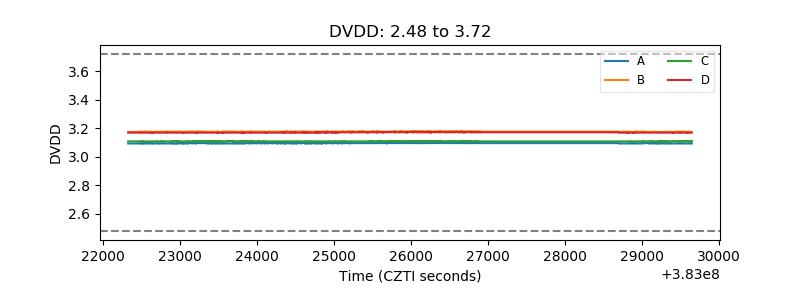 |
| Temperature 1 | 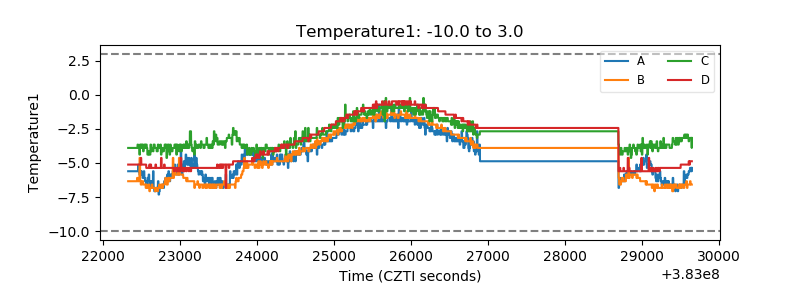 |
| Veto HV Monitor | 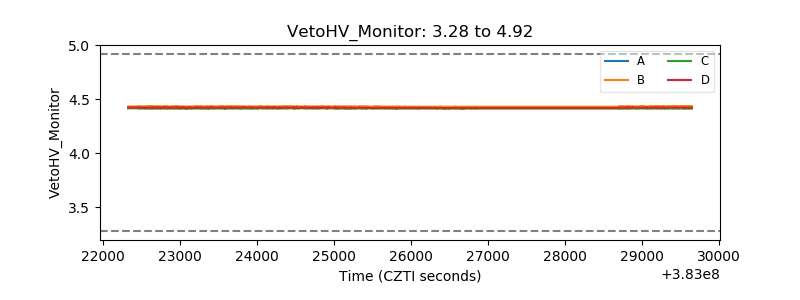 |
| Veto LLD | 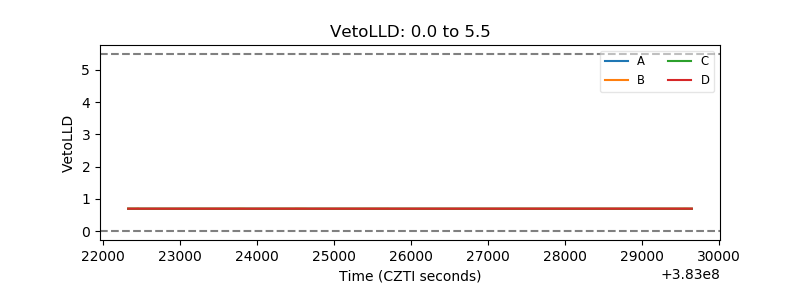 |
| Alpha Counter | 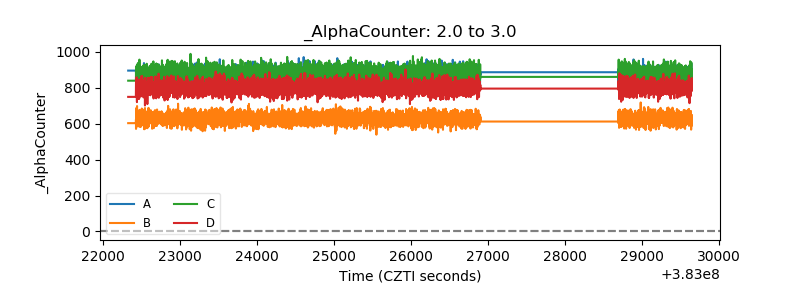 |
| _CPM_Rate | 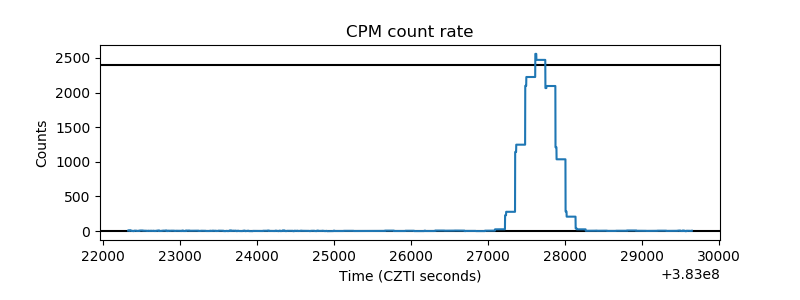 |
| CZT Counter | 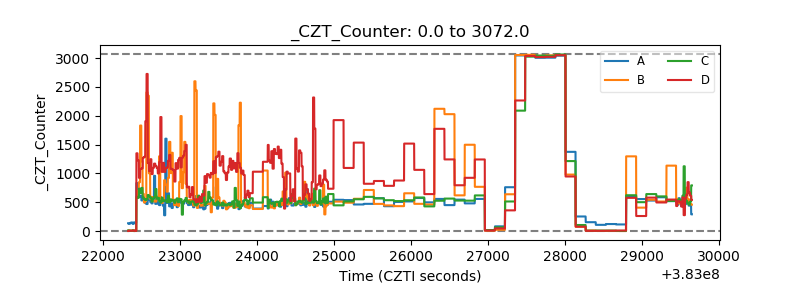 |
| +2.5 Volts monitor | 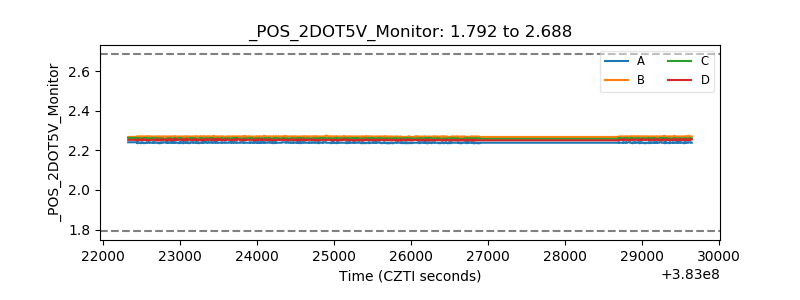 |
| +5 Volts monitor | 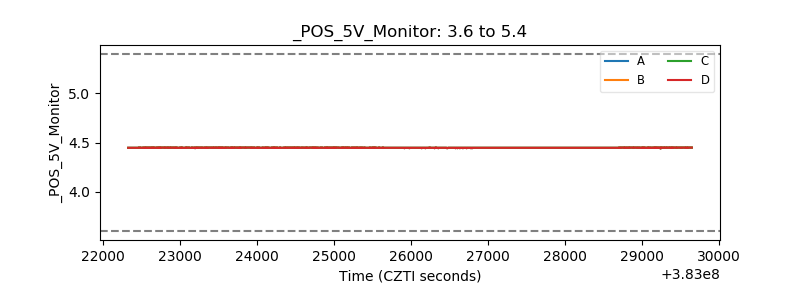 |
| _ROLL_ROT | 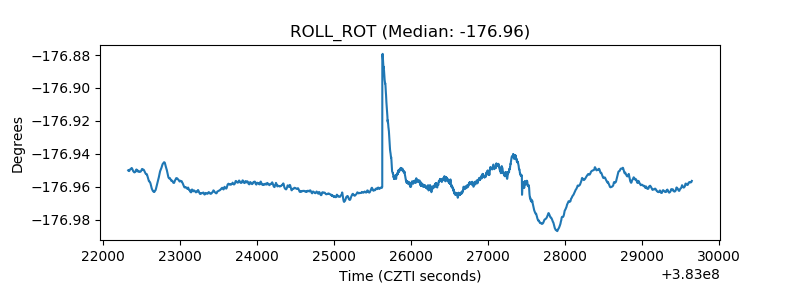 |
| _Roll_DEC | 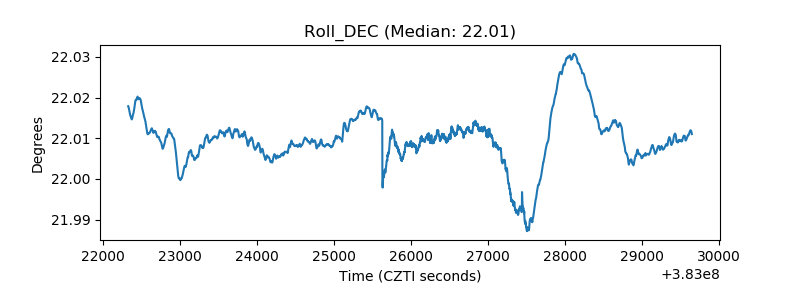 |
| _Roll_RA | 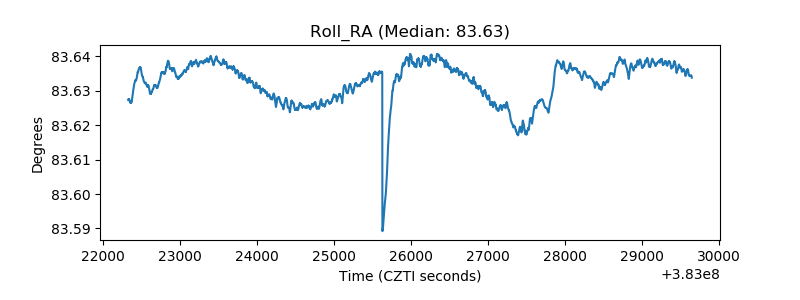 |
| Veto Counter | 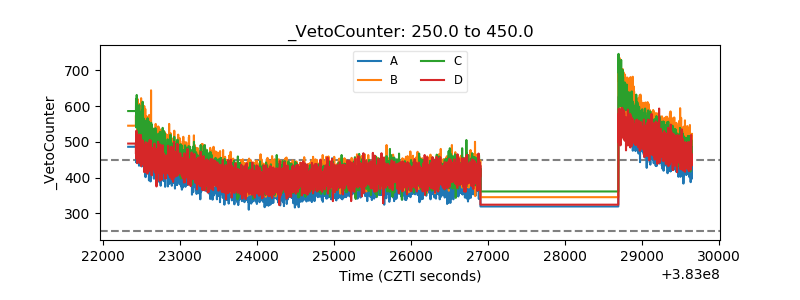 |