| Param | Original file | Final file |
|---|---|---|
| Filename | modeM0/AS1C07_014T01_9000004950_34590cztM0_level2.evt | modeM0/AS1C07_014T01_9000004950_34590cztM0_level2_quad_clean.evt |
| Size (bytes) | 1,167,580,800 | 133,614,720 |
| Size | 1.1 GB | 127.4 MB |
| Events in quadrant A | 5,640,695 | 841,087 |
| Events in quadrant B | 8,222,816 | 826,110 |
| Events in quadrant C | 6,266,297 | 837,905 |
| Events in quadrant D | 14,430,873 | 719,460 |
| Mode SS | |||
|---|---|---|---|
| Quadrant | BADHDUFLAG | Total packets | Discarded packets |
| A | 0 | 244 | 0 |
| B | 0 | 244 | 0 |
| C | 0 | 244 | 0 |
| D | 0 | 244 | 0 |
| Mode M9 | |||
|---|---|---|---|
| Quadrant | BADHDUFLAG | Total packets | Discarded packets |
| A | 0 | 27 | 0 |
| B | 0 | 27 | 0 |
| C | 0 | 27 | 0 |
| D | 0 | 27 | 0 |
| Mode M0 | |||
|---|---|---|---|
| Quadrant | BADHDUFLAG | Total packets | Discarded packets |
| A | 0 | 24412 | 3 |
| B | 0 | 32163 | 2 |
| C | 0 | 25594 | 2 |
| D | 0 | 51168 | 2 |
| Quadrant | Total seconds | Saturated seconds | Saturation percentage |
|---|---|---|---|
| A | 11867 | 16 | 0.134828% |
| B | 11867 | 695 | 5.856577% |
| C | 11867 | 25 | 0.210668% |
| D | 11867 | 1683 | 14.182186% |
Noise dominated data is calculated using 1-second bins in cleaned event files. If a bin has >2000 counts, and if more than 50% of those come from <1% of pixels, then it is considered to be noise-dominated and hence unusable.
| Quadrant | # 1 sec bins | Bins with >0 counts | Bins with >2000 counts | High rate bins dominated by noise | Noise dominated (total time) | Noise dominated (detector-on time) | Marked lightcurve |
|---|---|---|---|---|---|---|---|
| A | 14614 | 11869 | 0 | 0 | 0.00% | 0.00% | 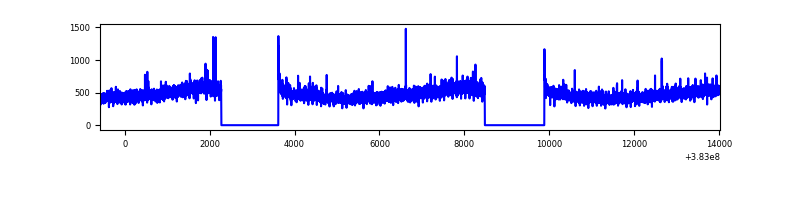 |
| B | 14614 | 11869 | 439 | 439 | 3.00% | 3.70% | 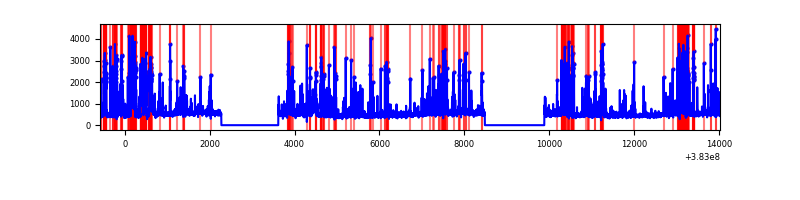 |
| C | 14614 | 11869 | 17 | 17 | 0.12% | 0.14% | 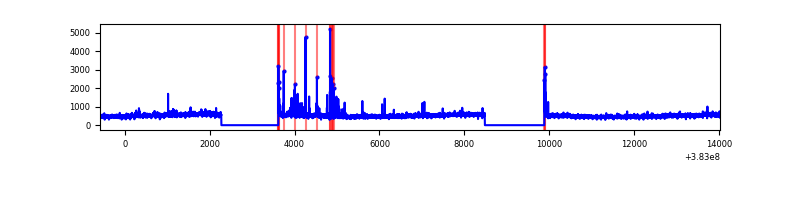 |
| D | 14614 | 11868 | 1377 | 1377 | 9.42% | 11.60% | 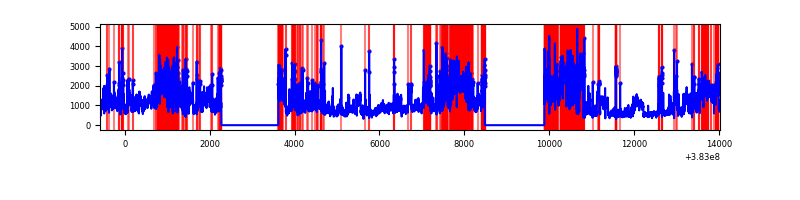 |
Top three noisy pixels from each quadrant. If the there are fewer than three noisy pixels in the level2.evt file, extra rows are filled as -1
| Pixel properties | Quadrant properties | ||||||
|---|---|---|---|---|---|---|---|
| Quadrant | DetID | PixID | Counts | Sigma | Mean | Median | Sigma |
| A | 10 | 83 | 56483 | 190.98 | 1431 | 1406 | 288.4 |
| A | 9 | 143 | 29011 | 95.72 | 1431 | 1406 | 288.4 |
| A | 13 | 254 | 21211 | 68.67 | 1431 | 1406 | 288.4 |
| B | 5 | 172 | 2206997 | 8151.4 | 1393 | 1353 | 270.6 |
| B | 0 | 189 | 268249 | 986.37 | 1393 | 1353 | 270.6 |
| B | 5 | 255 | 68005 | 246.33 | 1393 | 1353 | 270.6 |
| C | 15 | 214 | 488198 | 1503.05 | 1390 | 1402 | 323.9 |
| C | 0 | 207 | 167395 | 512.53 | 1390 | 1402 | 323.9 |
| C | 14 | 67 | 120000 | 366.19 | 1390 | 1402 | 323.9 |
| D | 8 | 195 | 5992607 | 16696.38 | 1308 | 1286 | 358.8 |
| D | 1 | 52 | 915268 | 2547.05 | 1308 | 1286 | 358.8 |
| D | 5 | 223 | 802730 | 2233.43 | 1308 | 1286 | 358.8 |
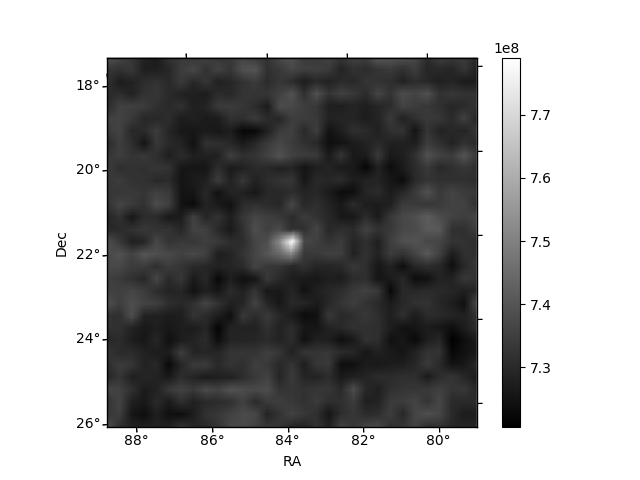
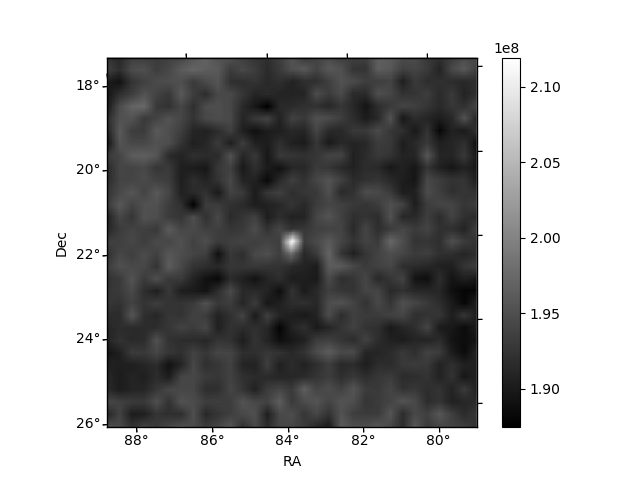
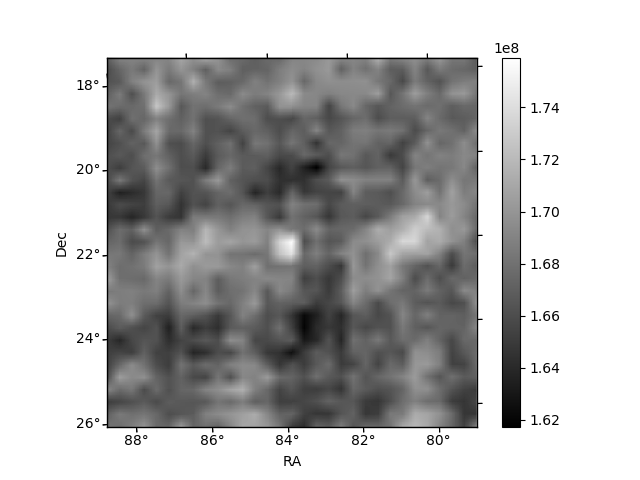
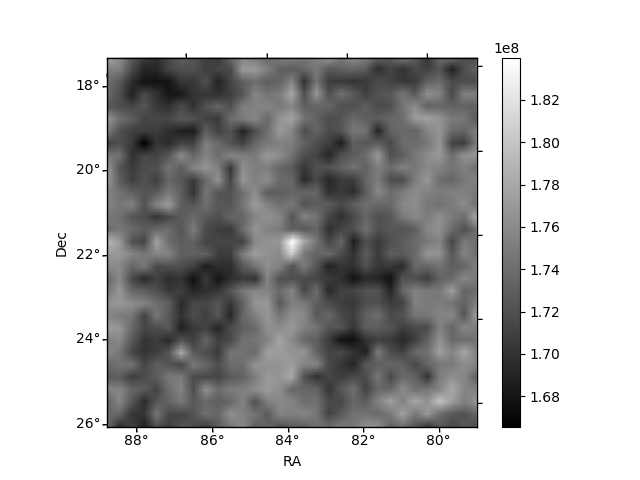
Histogram calculated using DETX and DETY for each event in the final _common_clean file
| Quadrant A | 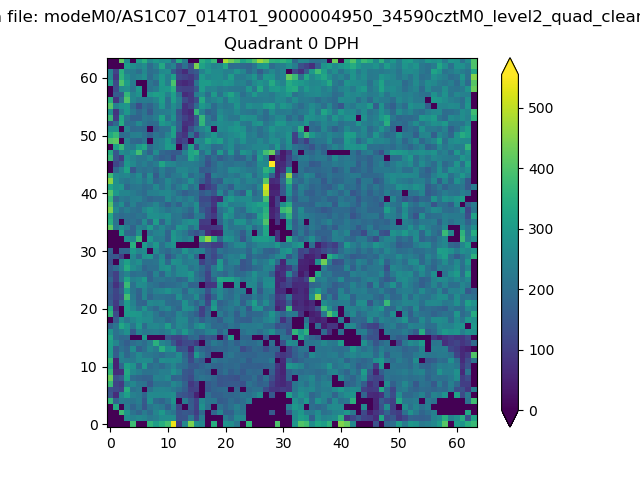 |
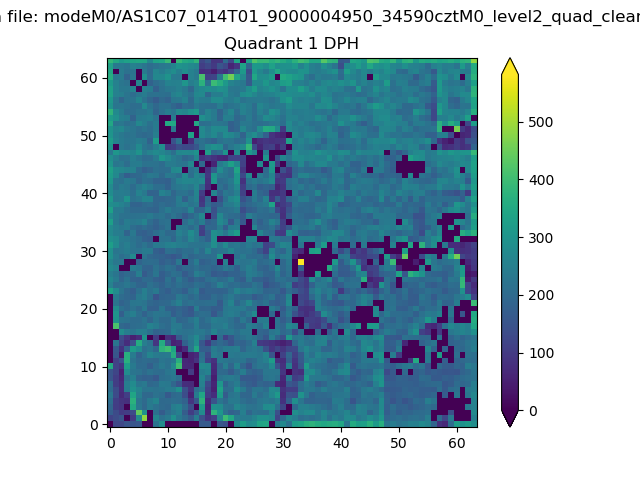 |
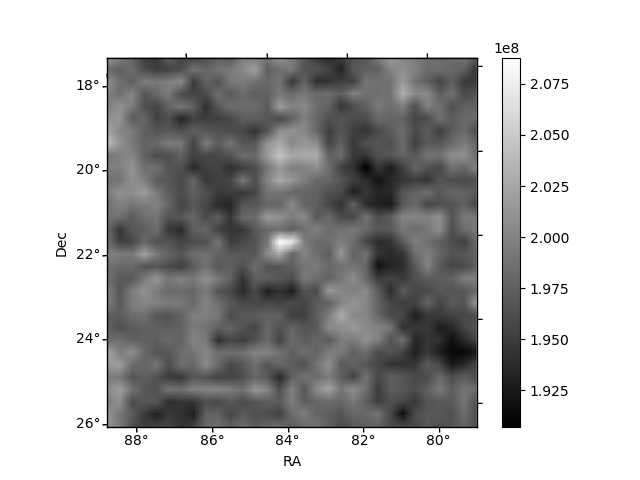
Quadrant B |
|---|---|---|---|
| Quadrant D | 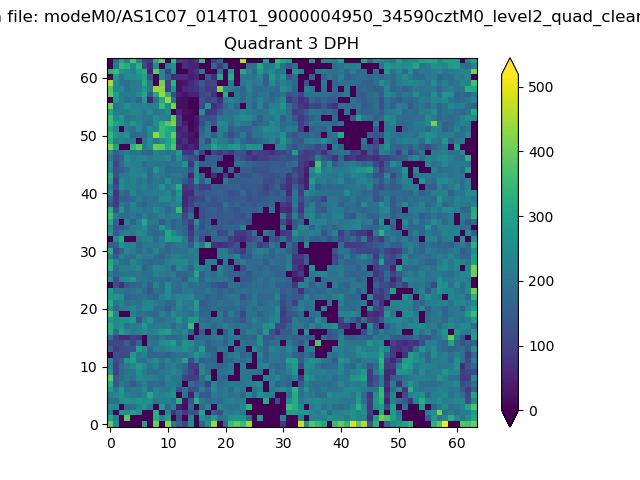 |
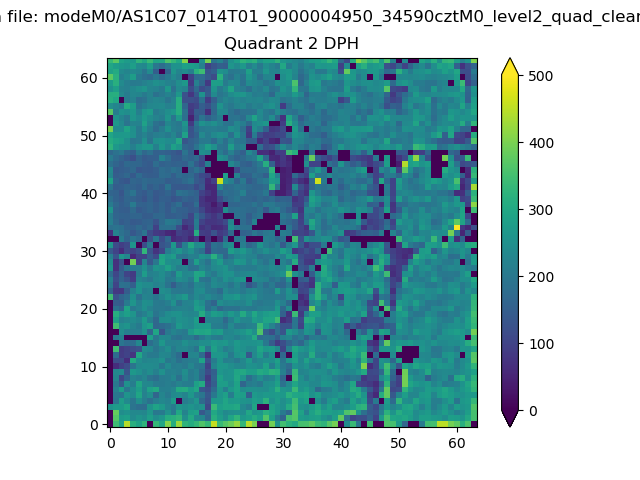 |
Quadrant C |
| Plot type | Count rate plots | Images |
|---|---|---|
| Comparison with Poisson distribution Blue bars denote a histogram of data divided into 1 sec bins. Red curve is a Poisson curve with rate = median count rate of data. |
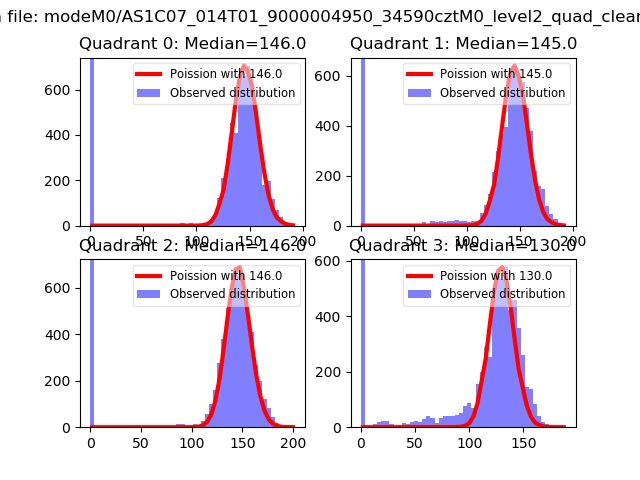 |
 |
| Quadrant-wise count rates Data is divided into 100 sec bins |
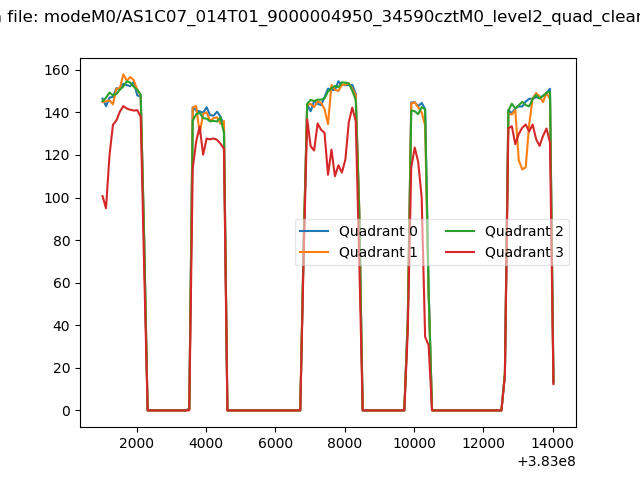 |
|
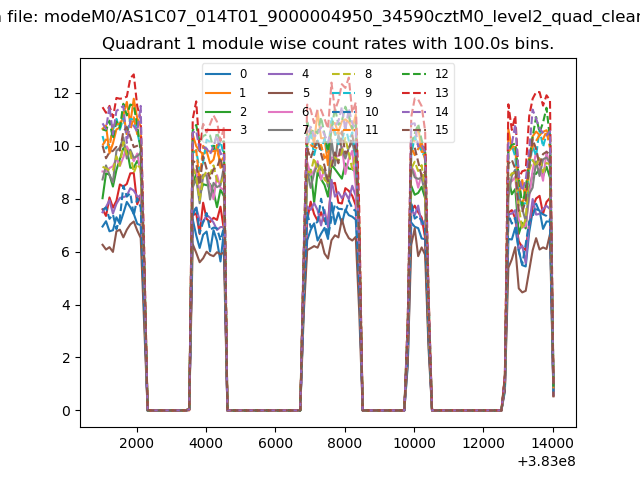
| Module-wise count rates for Quadrant A Data is divided into 100 sec bins |
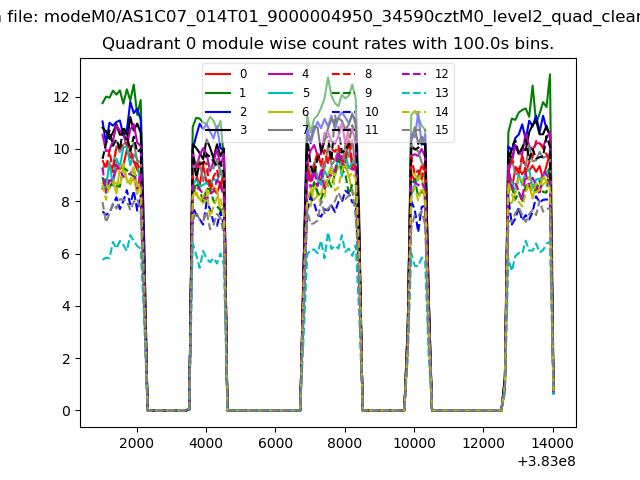 |
 |
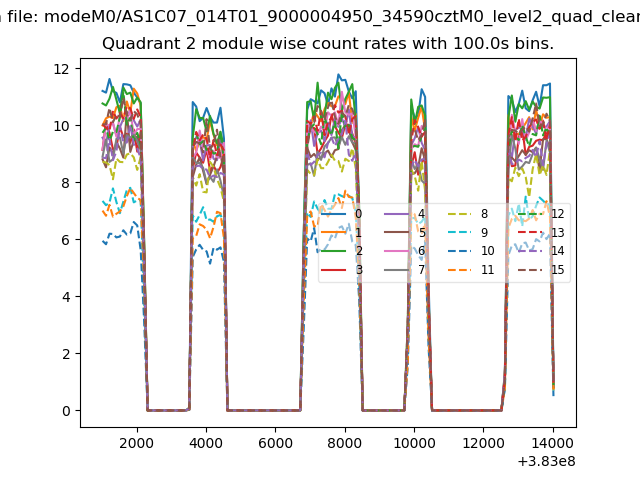
| Module-wise count rates for Quadrant B Data is divided into 100 sec bins |
 |
 |
| Module-wise count rates for Quadrant C Data is divided into 100 sec bins |
 |
 |
| Module-wise count rates for Quadrant D Data is divided into 100 sec bins |
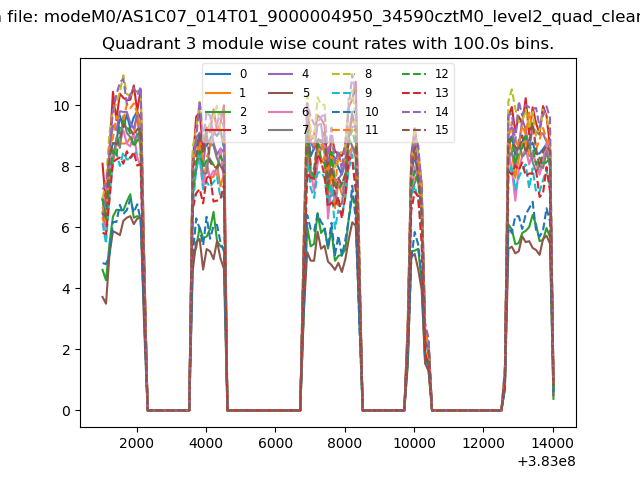 |
 |
| Parameter | Plot |
|---|---|
| CZT HV Monitor | 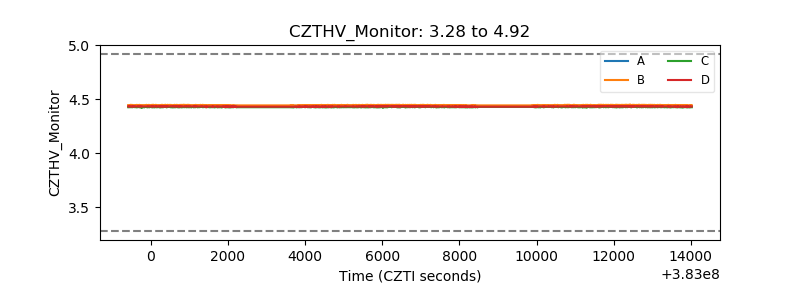 |
| D_VDD | 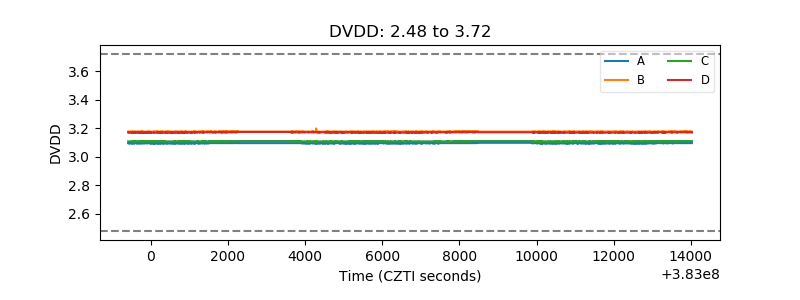 |
| Temperature 1 | 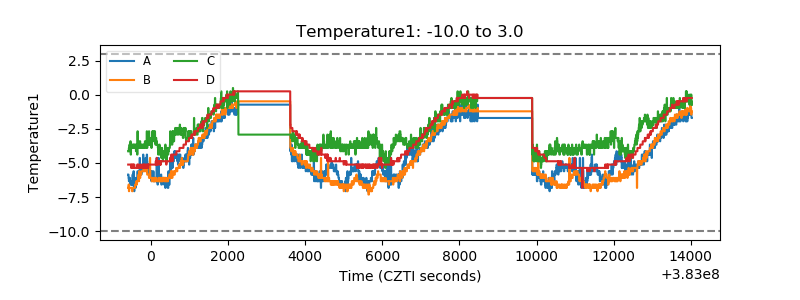 |
| Veto HV Monitor | 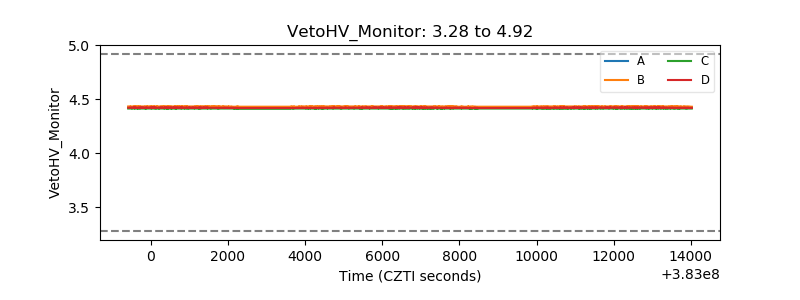 |
| Veto LLD | 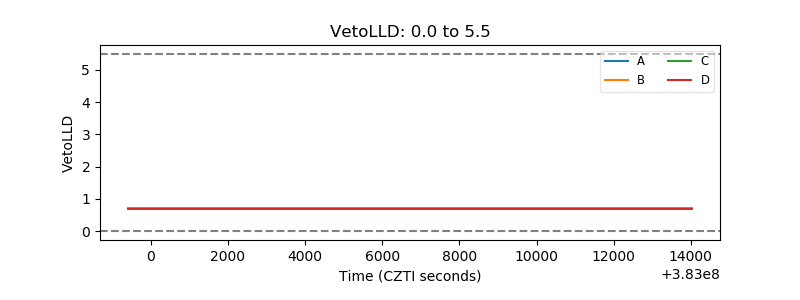 |
| Alpha Counter | 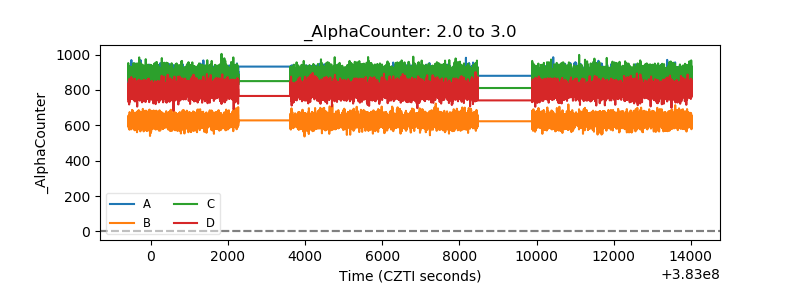 |
| _CPM_Rate | 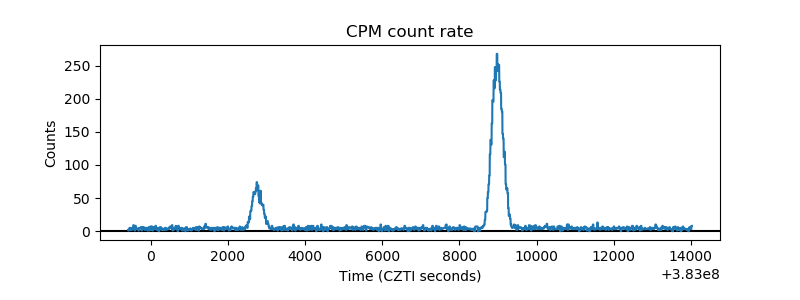 |
| CZT Counter | 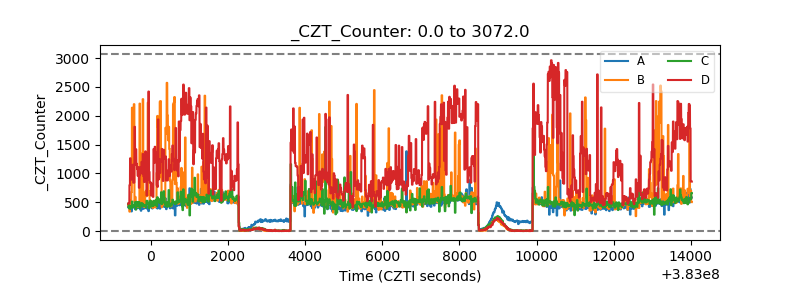 |
| +2.5 Volts monitor | 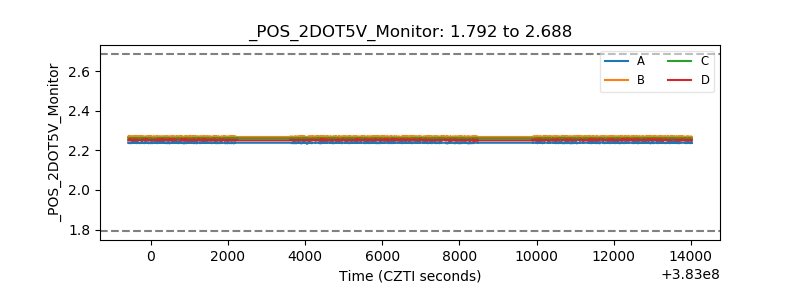 |
| +5 Volts monitor | 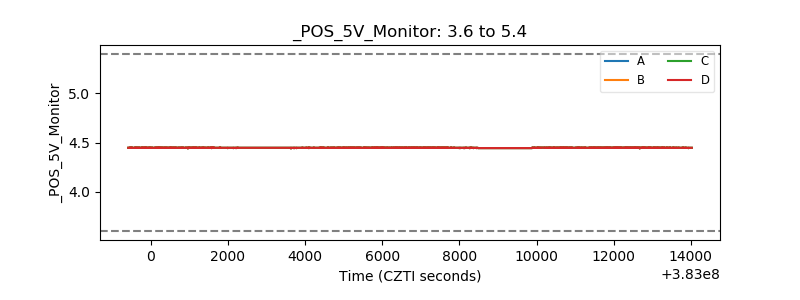 |
| _ROLL_ROT | 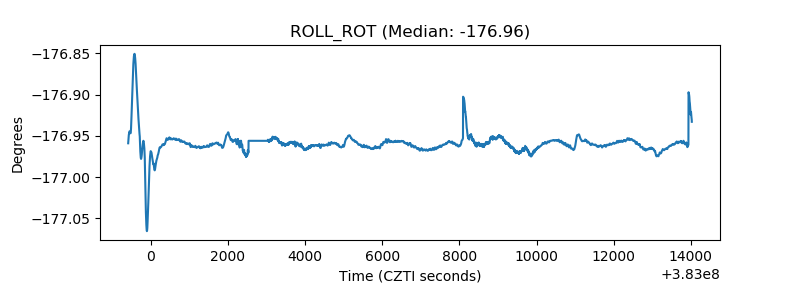 |
| _Roll_DEC | 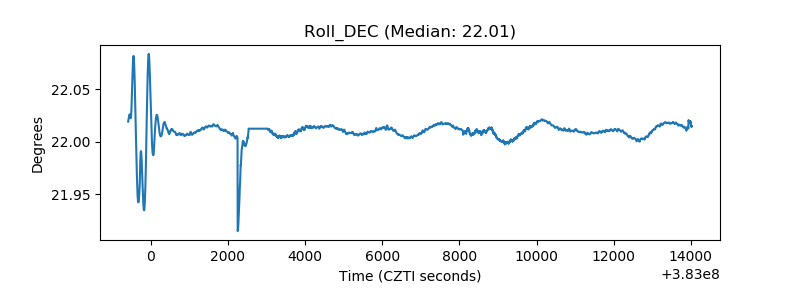 |
| _Roll_RA | 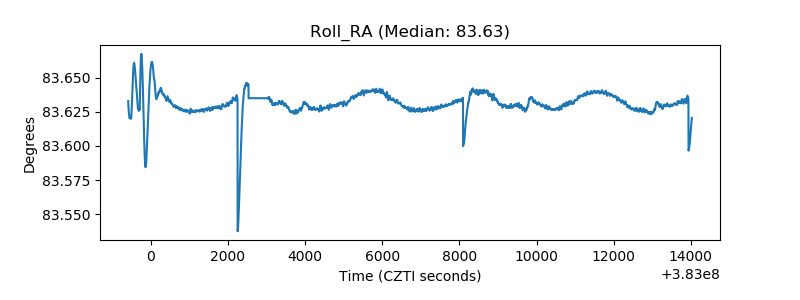 |
| Veto Counter | 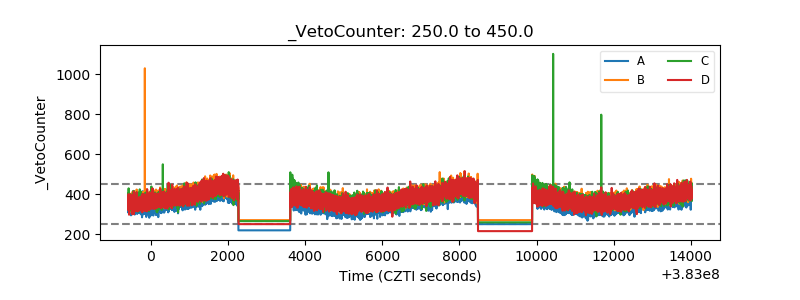 |