| Param | Original file | Final file |
|---|---|---|
| Filename | modeM0/AS1A09_038T44_9000004948_34590cztM0_level2.evt | modeM0/AS1A09_038T44_9000004948_34590cztM0_level2_quad_clean.evt |
| Size (bytes) | 611,798,400 | 108,264,960 |
| Size | 583.5 MB | 103.2 MB |
| Events in quadrant A | 2,736,235 | 748,235 |
| Events in quadrant B | 3,661,050 | 742,702 |
| Events in quadrant C | 3,103,677 | 734,465 |
| Events in quadrant D | 8,622,523 | 634,558 |
| Mode M0 | |||
|---|---|---|---|
| Quadrant | BADHDUFLAG | Total packets | Discarded packets |
| A | 0 | 12251 | 2 |
| B | 0 | 14762 | 2 |
| C | 0 | 12926 | 2 |
| D | 0 | 29853 | 2 |
| Mode M9 | |||
|---|---|---|---|
| Quadrant | BADHDUFLAG | Total packets | Discarded packets |
| A | 0 | 20 | 0 |
| B | 0 | 20 | 0 |
| C | 0 | 20 | 0 |
| D | 0 | 21 | 0 |
| Mode SS | |||
|---|---|---|---|
| Quadrant | BADHDUFLAG | Total packets | Discarded packets |
| A | 0 | 122 | 0 |
| B | 0 | 122 | 0 |
| C | 0 | 122 | 0 |
| D | 0 | 122 | 0 |
| Quadrant | Total seconds | Saturated seconds | Saturation percentage |
|---|---|---|---|
| A | 5991 | 18 | 0.300451% |
| B | 5991 | 185 | 3.087965% |
| C | 5991 | 39 | 0.650976% |
| D | 5991 | 1033 | 17.242530% |
Noise dominated data is calculated using 1-second bins in cleaned event files. If a bin has >2000 counts, and if more than 50% of those come from <1% of pixels, then it is considered to be noise-dominated and hence unusable.
| Quadrant | # 1 sec bins | Bins with >0 counts | Bins with >2000 counts | High rate bins dominated by noise | Noise dominated (total time) | Noise dominated (detector-on time) | Marked lightcurve |
|---|---|---|---|---|---|---|---|
| A | 7274 | 5992 | 6 | 6 | 0.08% | 0.10% | 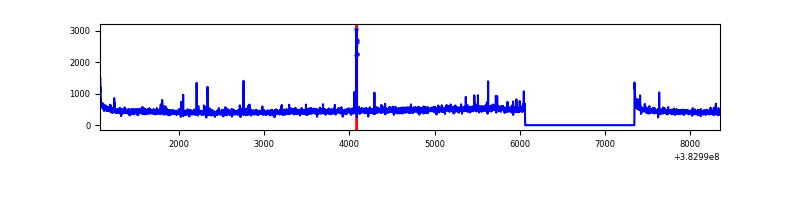 |
| B | 7274 | 5992 | 114 | 114 | 1.57% | 1.90% | 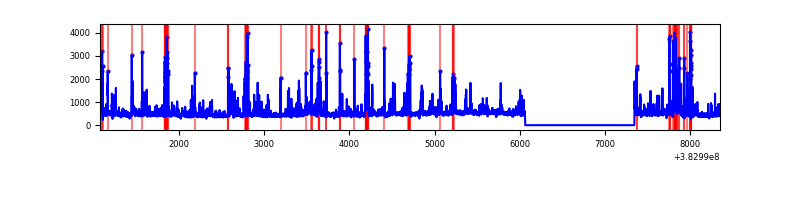 |
| C | 7273 | 5991 | 34 | 34 | 0.47% | 0.57% | 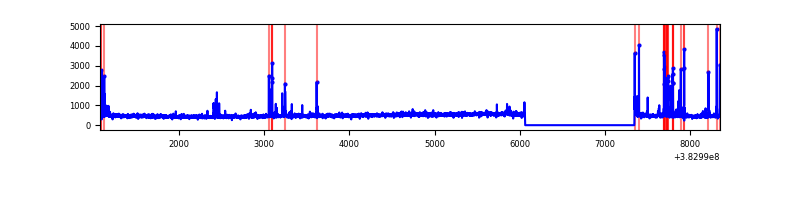 |
| D | 7274 | 5992 | 871 | 871 | 11.97% | 14.54% | 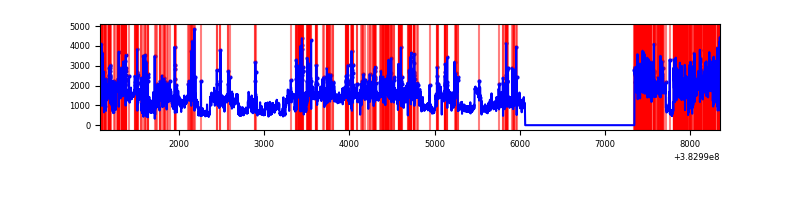 |
Top three noisy pixels from each quadrant. If the there are fewer than three noisy pixels in the level2.evt file, extra rows are filled as -1
| Pixel properties | Quadrant properties | ||||||
|---|---|---|---|---|---|---|---|
| Quadrant | DetID | PixID | Counts | Sigma | Mean | Median | Sigma |
| A | 10 | 83 | 48401 | 346.32 | 679 | 665 | 137.8 |
| A | 9 | 143 | 42710 | 305.03 | 679 | 665 | 137.8 |
| A | 13 | 6 | 11469 | 78.38 | 679 | 665 | 137.8 |
| B | 5 | 172 | 497856 | 3894.68 | 670 | 654 | 127.7 |
| B | 0 | 189 | 246432 | 1925.23 | 670 | 654 | 127.7 |
| B | 0 | 190 | 71731 | 556.76 | 670 | 654 | 127.7 |
| C | 15 | 214 | 252554 | 1637.96 | 656 | 661 | 153.8 |
| C | 0 | 207 | 139691 | 904.06 | 656 | 661 | 153.8 |
| C | 12 | 250 | 61255 | 394.02 | 656 | 661 | 153.8 |
| D | 8 | 195 | 4176176 | 26328.48 | 610 | 594 | 158.6 |
| D | 5 | 223 | 525377 | 3308.94 | 610 | 594 | 158.6 |
| D | 1 | 47 | 513258 | 3232.52 | 610 | 594 | 158.6 |
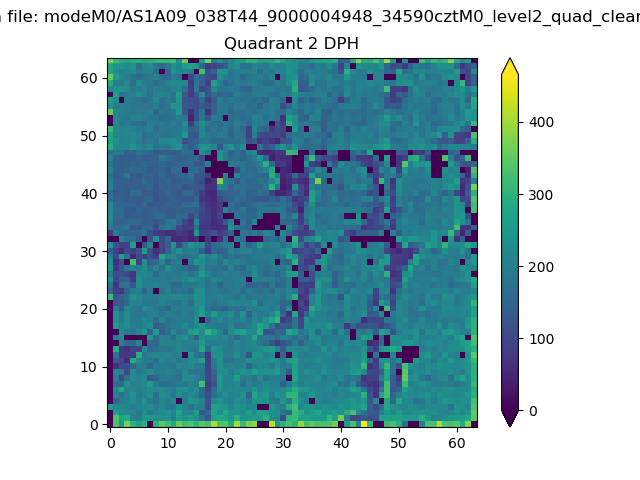
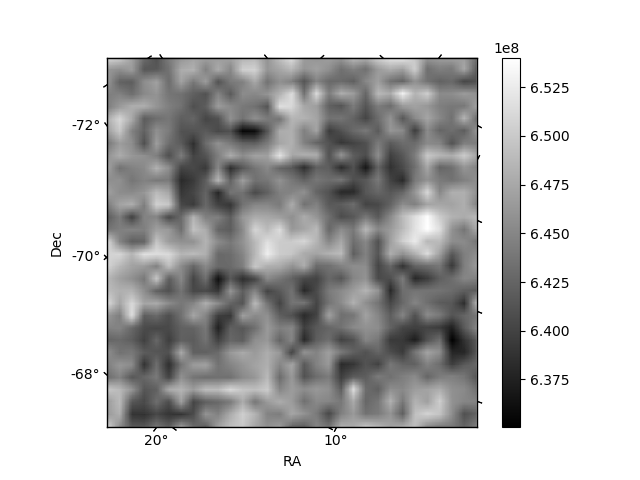
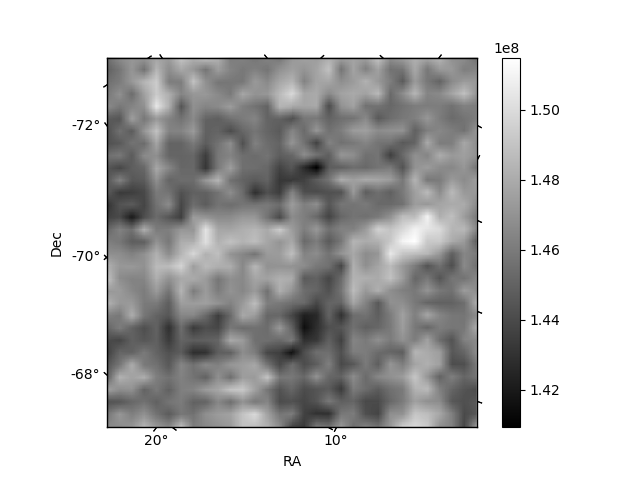
Histogram calculated using DETX and DETY for each event in the final _common_clean file
| Quadrant A | 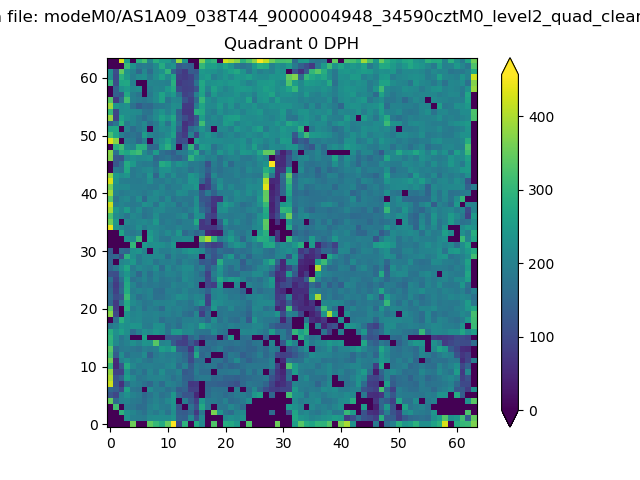 |
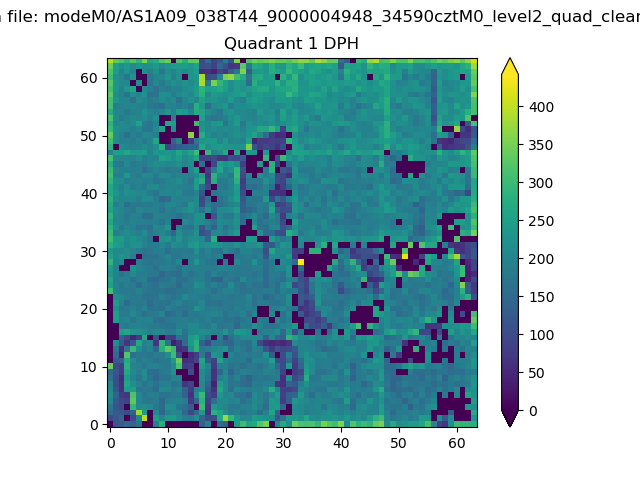 |
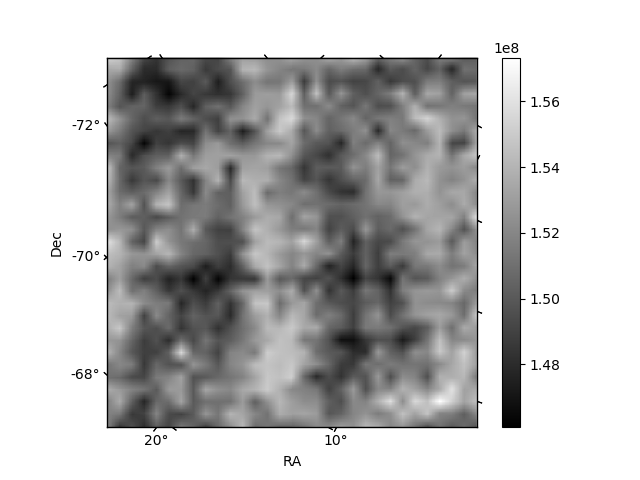
Quadrant B |
|---|---|---|---|
| Quadrant D | 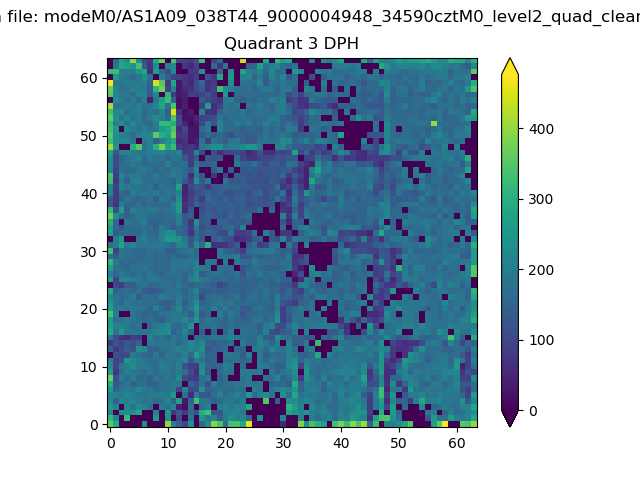 |
 |
Quadrant C |
| Plot type | Count rate plots | Images |
|---|---|---|
| Comparison with Poisson distribution Blue bars denote a histogram of data divided into 1 sec bins. Red curve is a Poisson curve with rate = median count rate of data. |
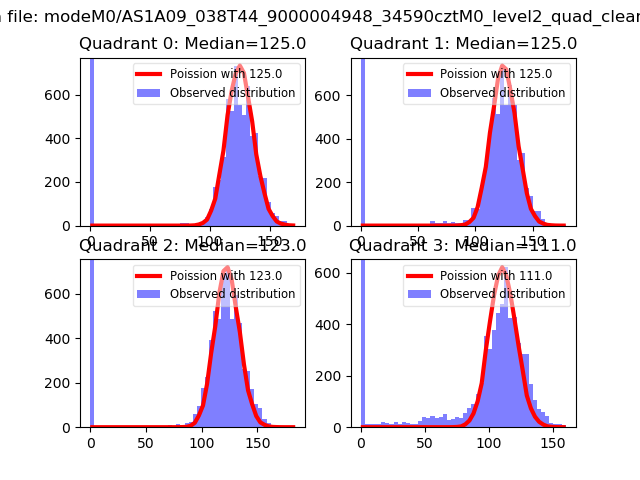 |
 |
| Quadrant-wise count rates Data is divided into 100 sec bins |
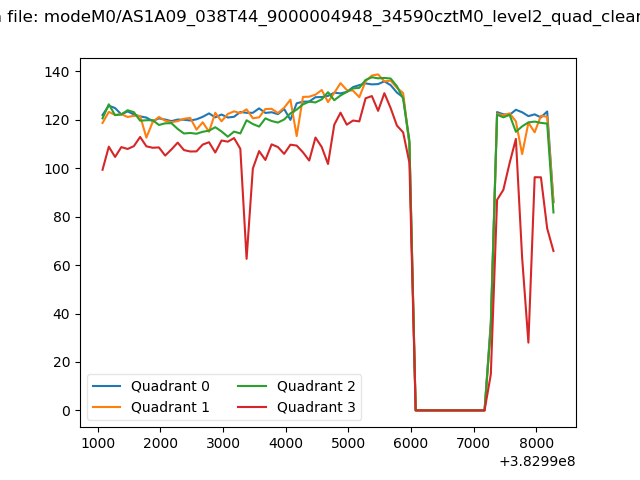 |
|
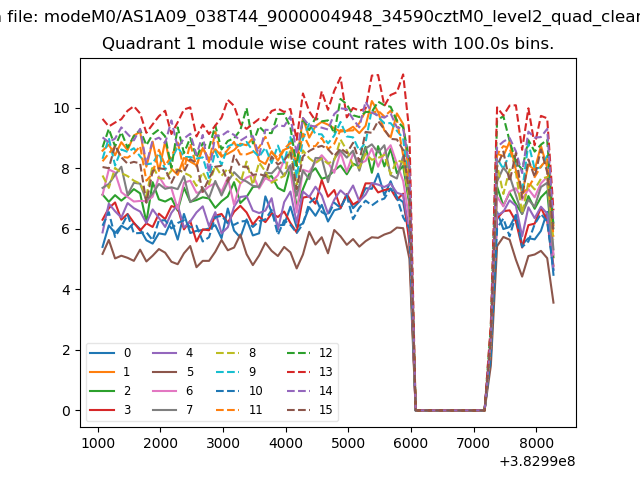
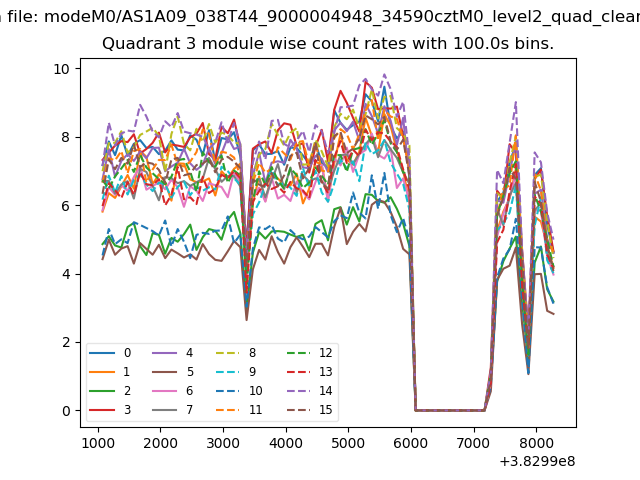
| Module-wise count rates for Quadrant A Data is divided into 100 sec bins |
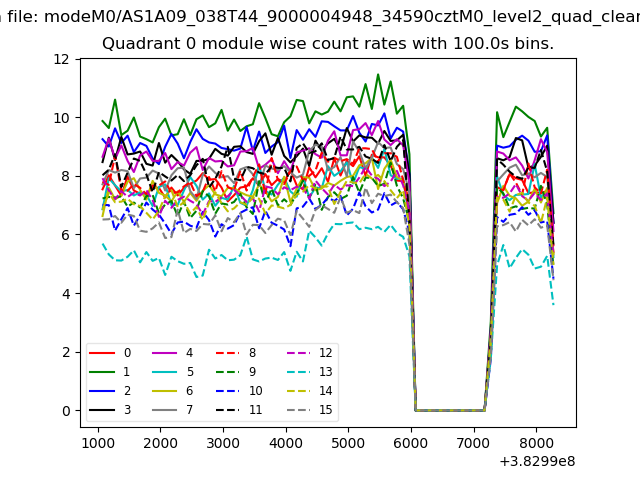 |
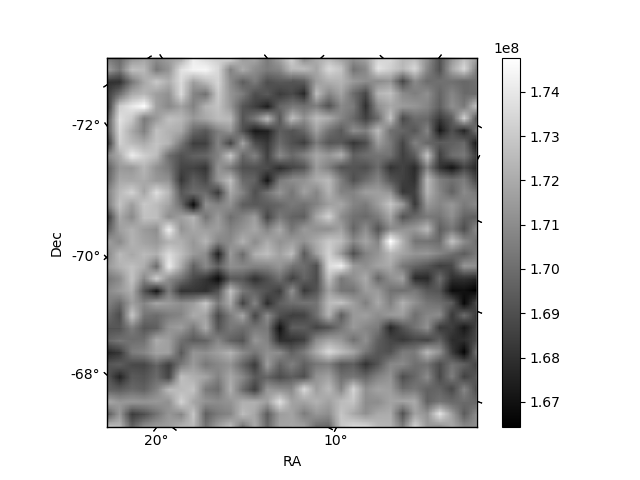 |
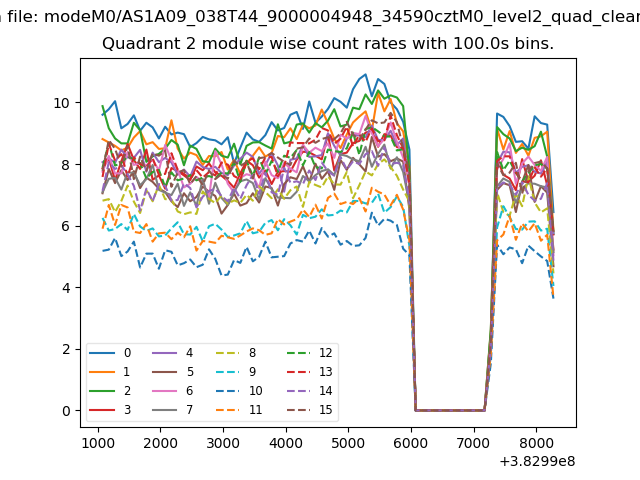
| Module-wise count rates for Quadrant B Data is divided into 100 sec bins |
 |
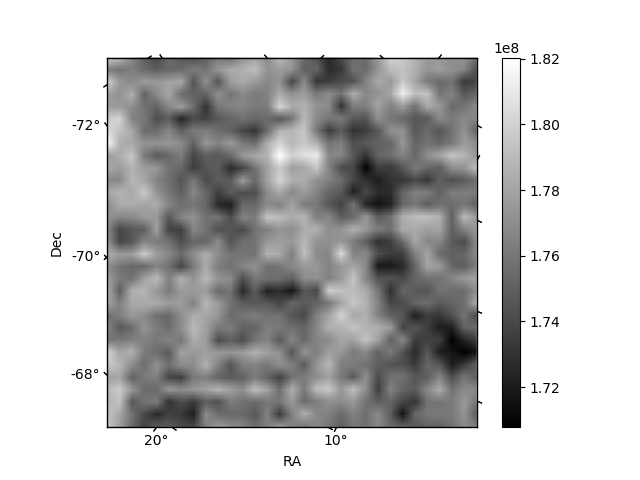 |
| Module-wise count rates for Quadrant C Data is divided into 100 sec bins |
 |
 |
| Module-wise count rates for Quadrant D Data is divided into 100 sec bins |
 |
 |
| Parameter | Plot |
|---|---|
| CZT HV Monitor | 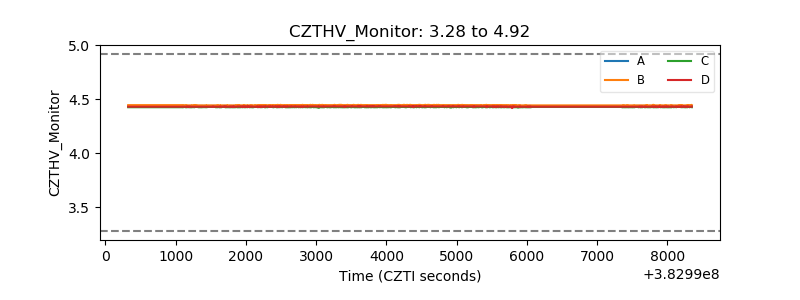 |
| D_VDD | 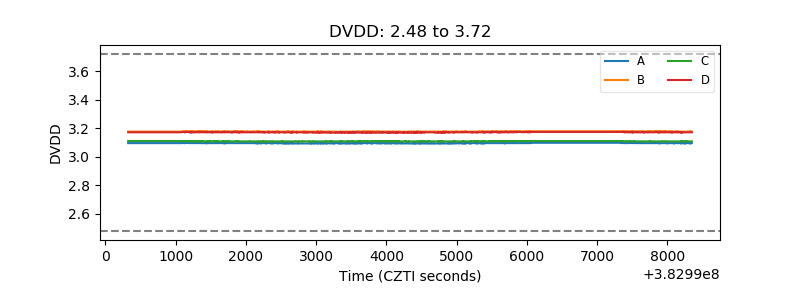 |
| Temperature 1 | 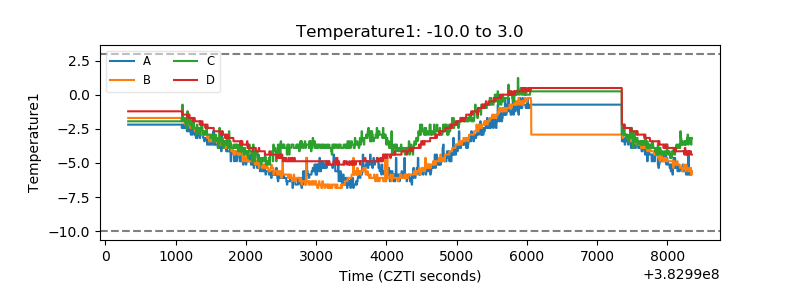 |
| Veto HV Monitor |  |
| Veto LLD | 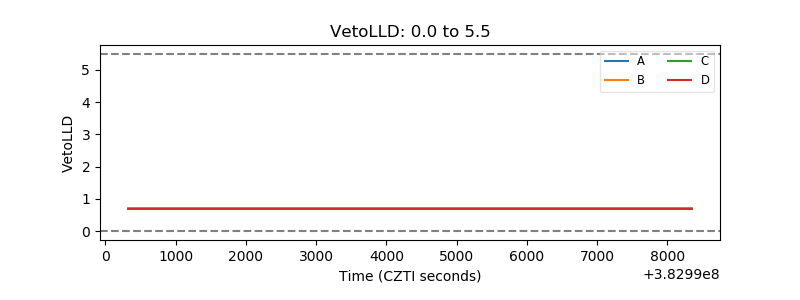 |
| Alpha Counter | 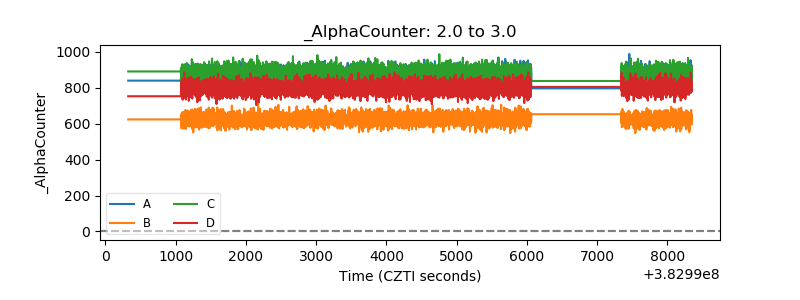 |
| _CPM_Rate | 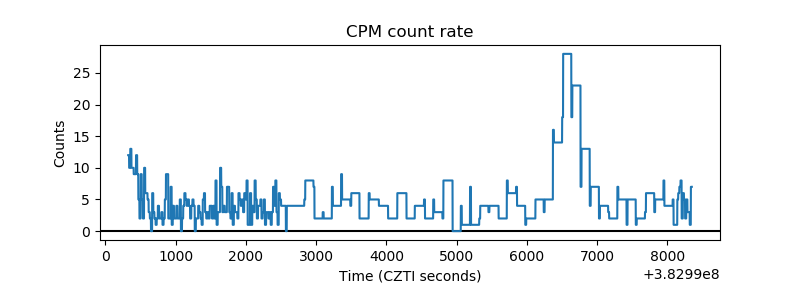 |
| CZT Counter | 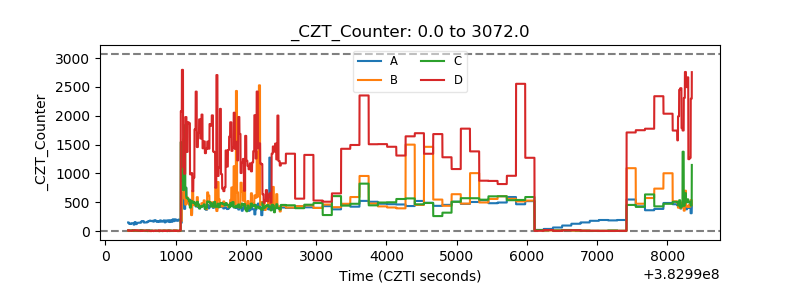 |
| +2.5 Volts monitor | 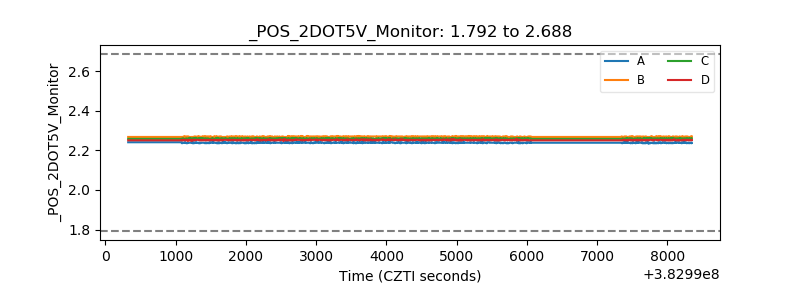 |
| +5 Volts monitor | 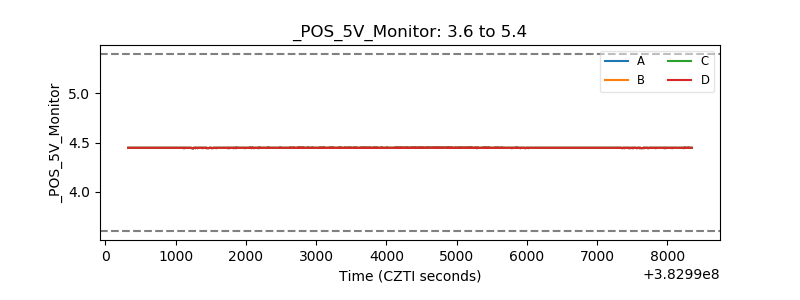 |
| _ROLL_ROT | 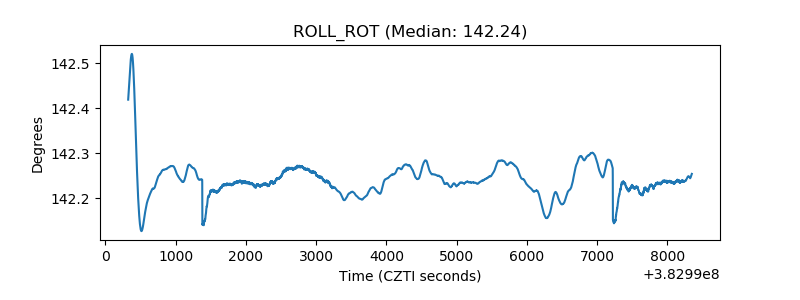 |
| _Roll_DEC | 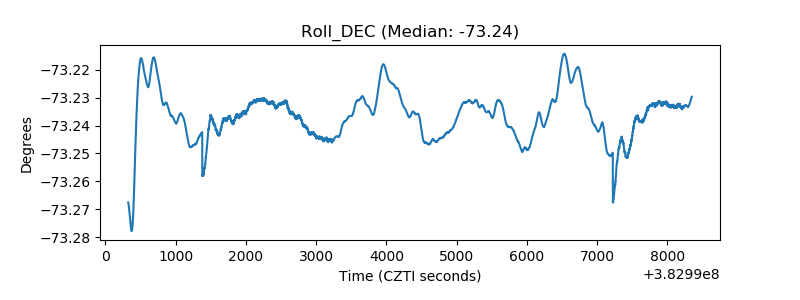 |
| _Roll_RA | 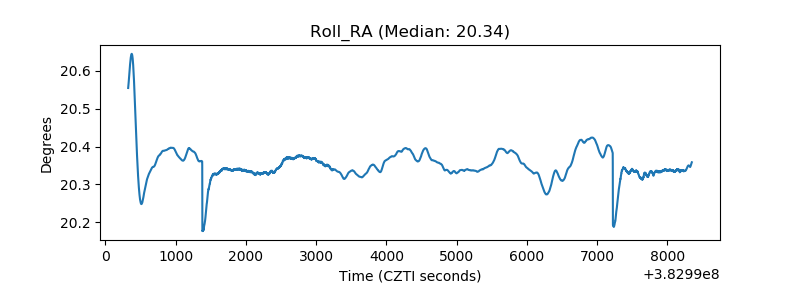 |
| Veto Counter | 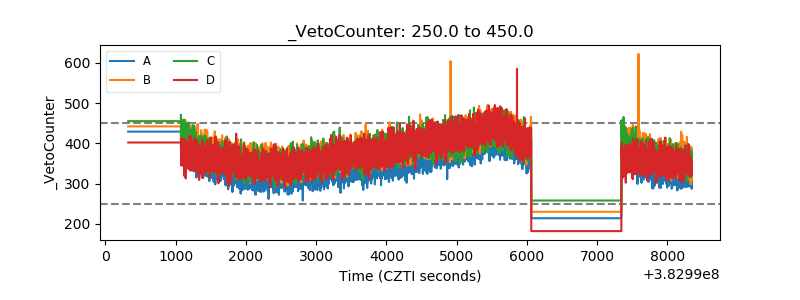 |