| Param | Original file | Final file |
|---|---|---|
| Filename | modeM0/AS1A09_038T44_9000004948_34586cztM0_level2.evt | modeM0/AS1A09_038T44_9000004948_34586cztM0_level2_quad_clean.evt |
| Size (bytes) | 94,544,640 | 16,873,920 |
| Size | 90.2 MB | 16.1 MB |
| Events in quadrant A | 422,521 | 113,707 |
| Events in quadrant B | 553,986 | 112,049 |
| Events in quadrant C | 455,165 | 113,188 |
| Events in quadrant D | 1,365,842 | 99,595 |
| Mode M0 | |||
|---|---|---|---|
| Quadrant | BADHDUFLAG | Total packets | Discarded packets |
| A | 0 | 1919 | 2 |
| B | 0 | 2254 | 1 |
| C | 0 | 1964 | 1 |
| D | 0 | 4723 | 1 |
| Mode M9 | |||
|---|---|---|---|
| Quadrant | BADHDUFLAG | Total packets | Discarded packets |
| A | 0 | 8 | 0 |
| B | 0 | 8 | 0 |
| C | 0 | 8 | 0 |
| D | 0 | 8 | 0 |
| Mode SS | |||
|---|---|---|---|
| Quadrant | BADHDUFLAG | Total packets | Discarded packets |
| A | 0 | 18 | 0 |
| B | 0 | 18 | 0 |
| C | 0 | 18 | 0 |
| D | 0 | 18 | 0 |
| Quadrant | Total seconds | Saturated seconds | Saturation percentage |
|---|---|---|---|
| A | 928 | 1 | 0.107759% |
| B | 928 | 24 | 2.586207% |
| C | 928 | 6 | 0.646552% |
| D | 928 | 113 | 12.176724% |
Noise dominated data is calculated using 1-second bins in cleaned event files. If a bin has >2000 counts, and if more than 50% of those come from <1% of pixels, then it is considered to be noise-dominated and hence unusable.
| Quadrant | # 1 sec bins | Bins with >0 counts | Bins with >2000 counts | High rate bins dominated by noise | Noise dominated (total time) | Noise dominated (detector-on time) | Marked lightcurve |
|---|---|---|---|---|---|---|---|
| A | 928 | 928 | 0 | 0 | 0.00% | 0.00% | 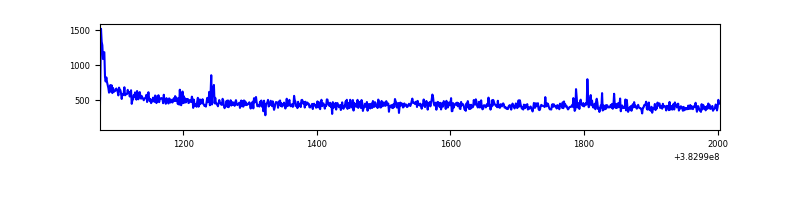 |
| B | 928 | 928 | 18 | 18 | 1.94% | 1.94% | 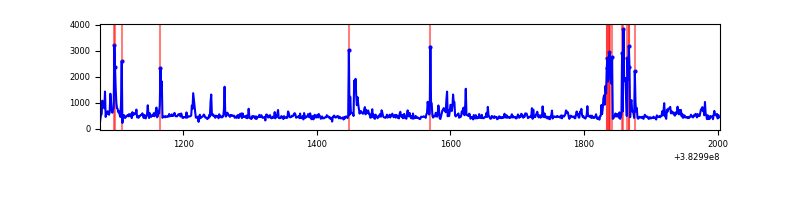 |
| C | 928 | 928 | 5 | 5 | 0.54% | 0.54% | 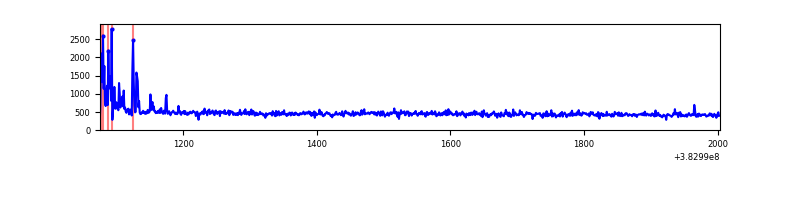 |
| D | 928 | 928 | 135 | 135 | 14.55% | 14.55% | 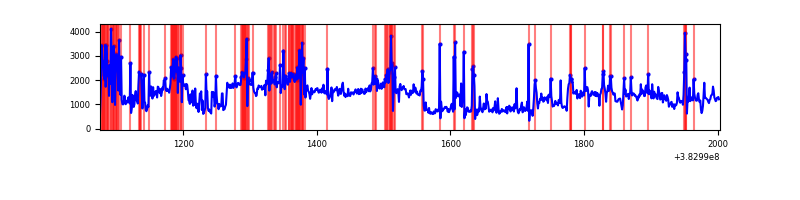 |
Top three noisy pixels from each quadrant. If the there are fewer than three noisy pixels in the level2.evt file, extra rows are filled as -1
| Pixel properties | Quadrant properties | ||||||
|---|---|---|---|---|---|---|---|
| Quadrant | DetID | PixID | Counts | Sigma | Mean | Median | Sigma |
| A | 10 | 83 | 20609 | 908.64 | 101 | 99 | 22.6 |
| A | 9 | 143 | 5149 | 223.73 | 101 | 99 | 22.6 |
| A | 10 | 67 | 1732 | 72.35 | 101 | 99 | 22.6 |
| B | 5 | 172 | 67183 | 3111.84 | 100 | 97 | 21.6 |
| B | 0 | 189 | 35490 | 1641.74 | 100 | 97 | 21.6 |
| B | 0 | 245 | 30194 | 1396.08 | 100 | 97 | 21.6 |
| C | 15 | 214 | 43066 | 1799.12 | 95 | 95 | 23.9 |
| C | 0 | 10 | 31657 | 1321.45 | 95 | 95 | 23.9 |
| C | 0 | 207 | 2128 | 85.12 | 95 | 95 | 23.9 |
| D | 8 | 195 | 697470 | 28991.73 | 90 | 88 | 24.1 |
| D | 13 | 249 | 92961 | 3860.94 | 90 | 88 | 24.1 |
| D | 10 | 118 | 61809 | 2565.88 | 90 | 88 | 24.1 |
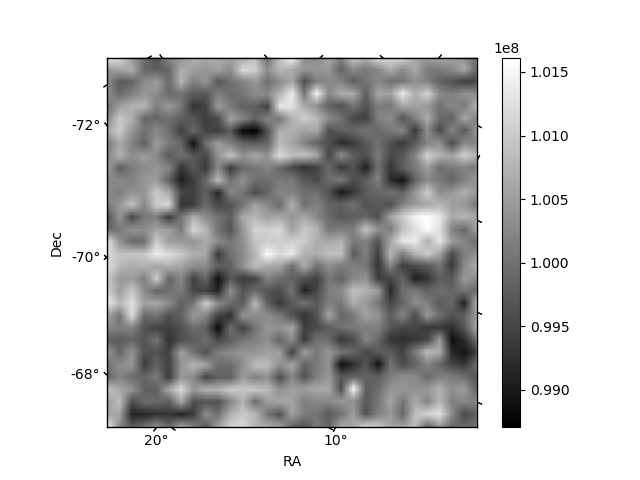
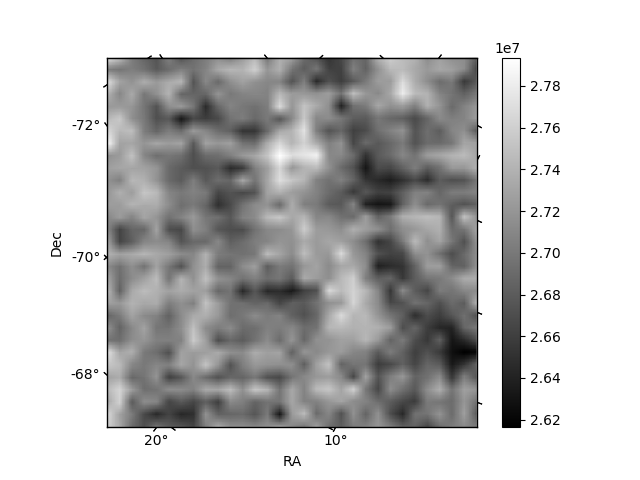
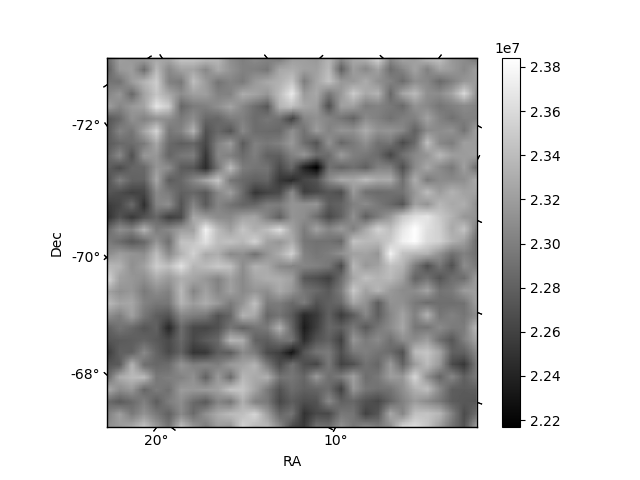
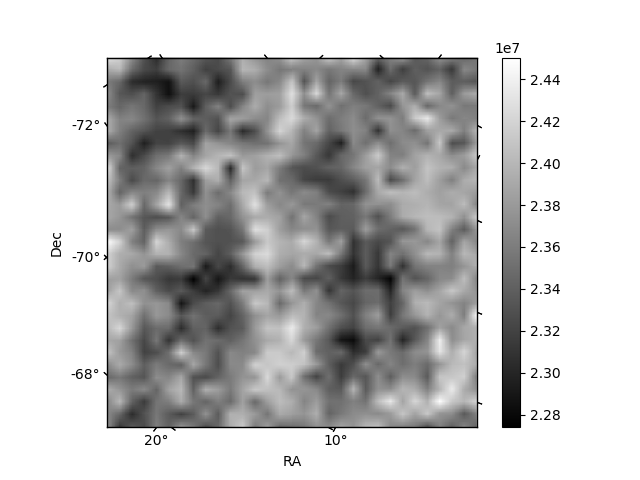
Histogram calculated using DETX and DETY for each event in the final _common_clean file
| Quadrant A | 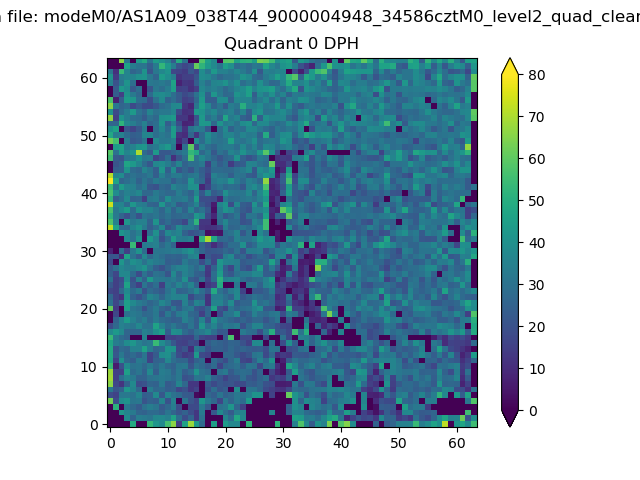 |
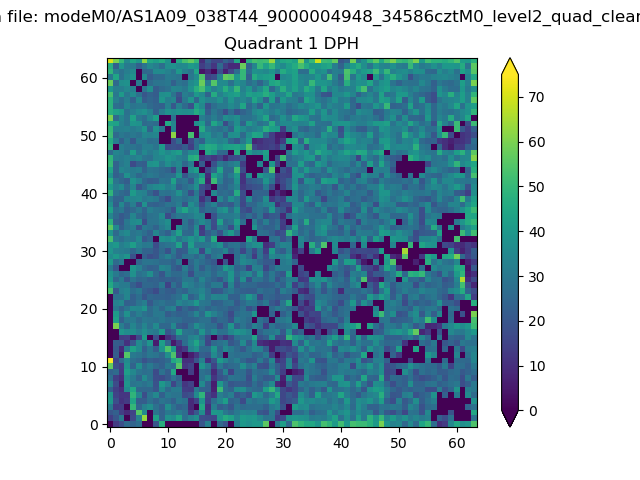 |
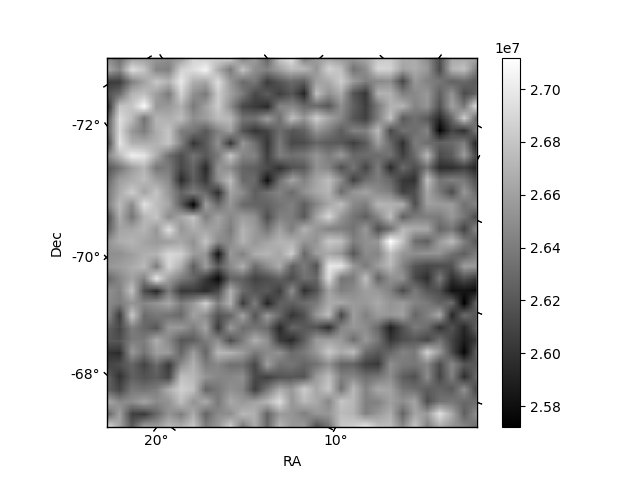
Quadrant B |
|---|---|---|---|
| Quadrant D |  |
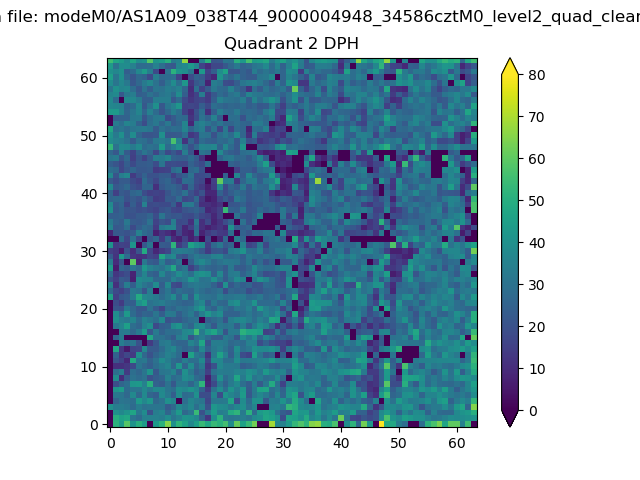 |
Quadrant C |
| Plot type | Count rate plots | Images |
|---|---|---|
| Comparison with Poisson distribution Blue bars denote a histogram of data divided into 1 sec bins. Red curve is a Poisson curve with rate = median count rate of data. |
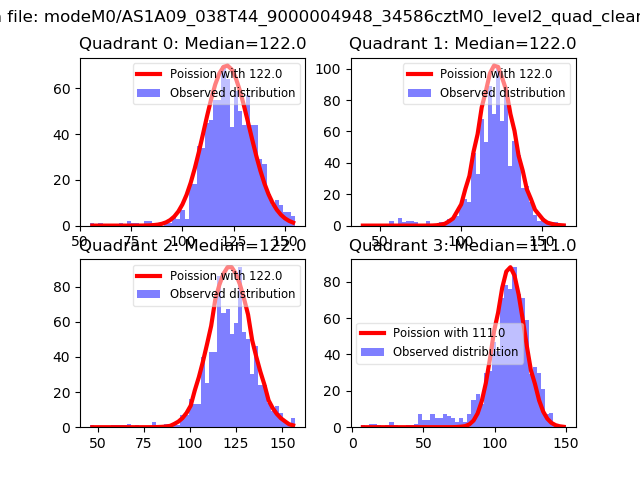 |
 |
| Quadrant-wise count rates Data is divided into 100 sec bins |
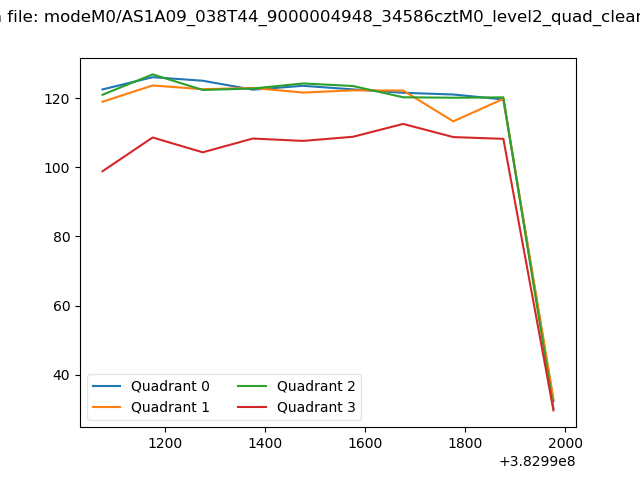 |
|
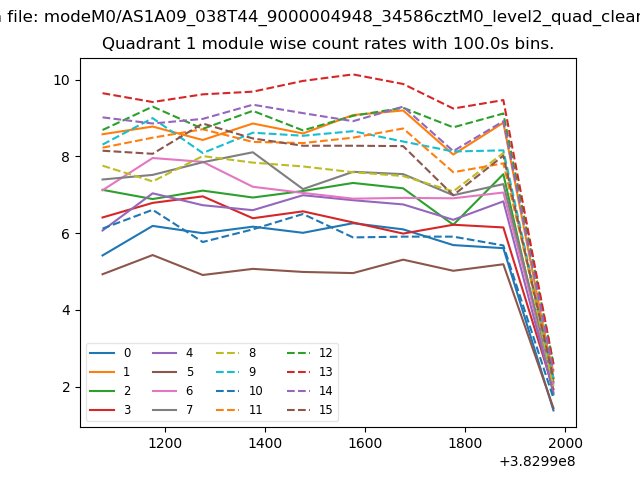
| Module-wise count rates for Quadrant A Data is divided into 100 sec bins |
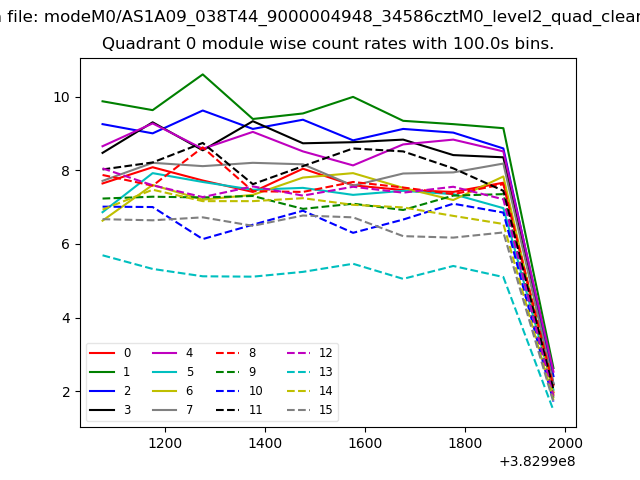 |
 |
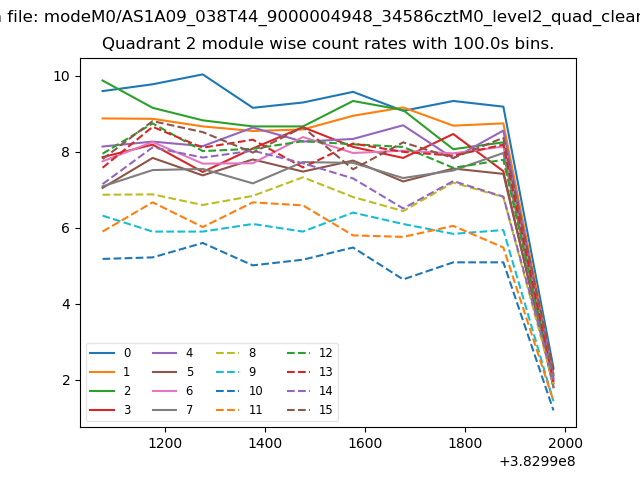
| Module-wise count rates for Quadrant B Data is divided into 100 sec bins |
 |
 |
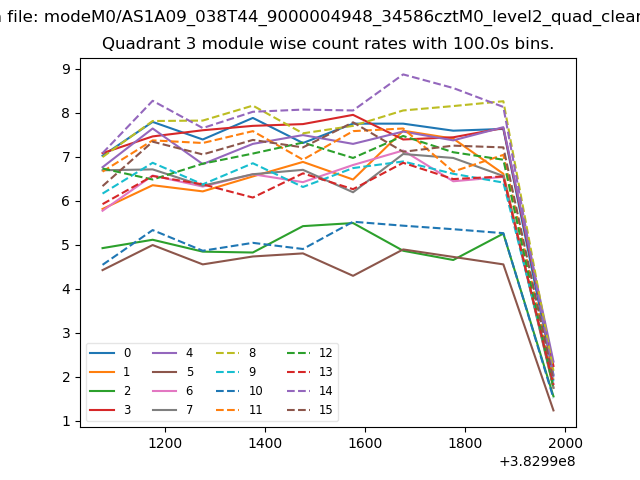
| Module-wise count rates for Quadrant C Data is divided into 100 sec bins |
 |
 |
| Module-wise count rates for Quadrant D Data is divided into 100 sec bins |
 |
 |
| Parameter | Plot |
|---|---|
| CZT HV Monitor | 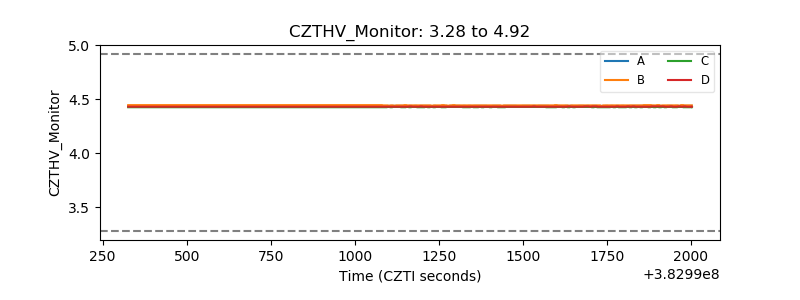 |
| D_VDD | 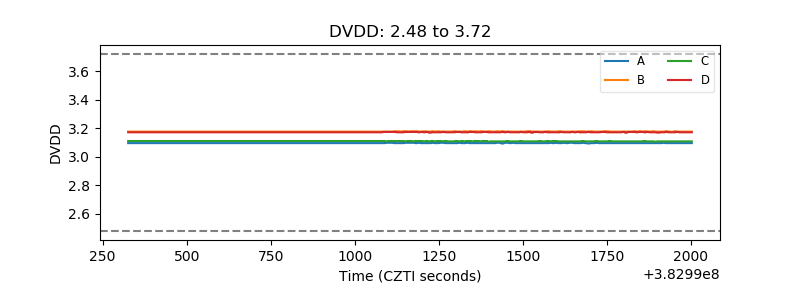 |
| Temperature 1 | 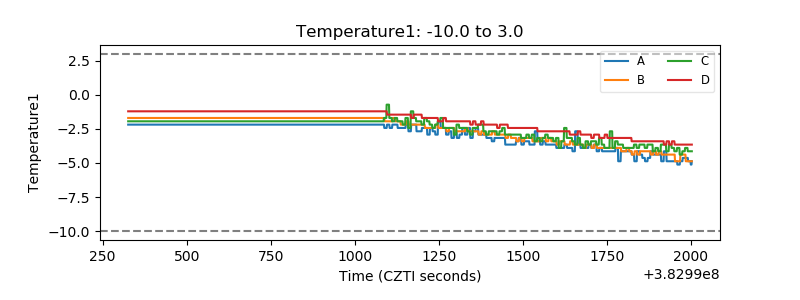 |
| Veto HV Monitor | 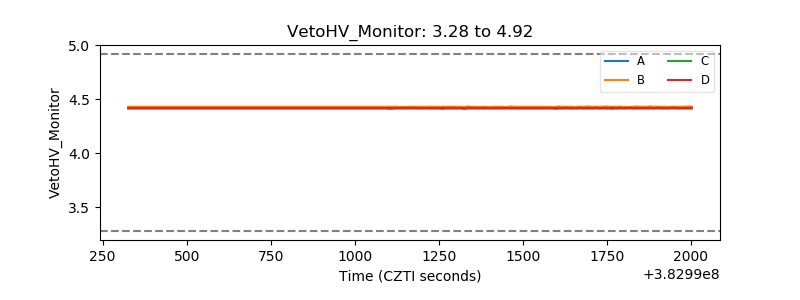 |
| Veto LLD | 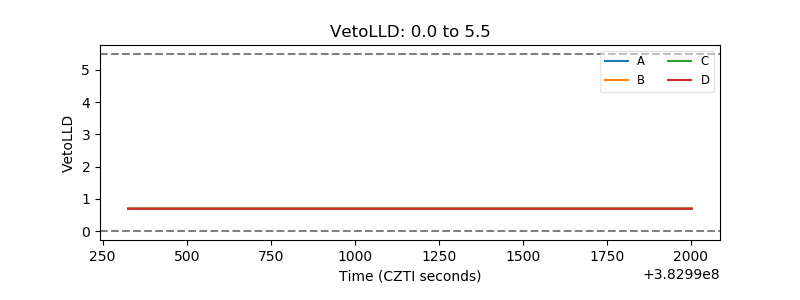 |
| Alpha Counter | 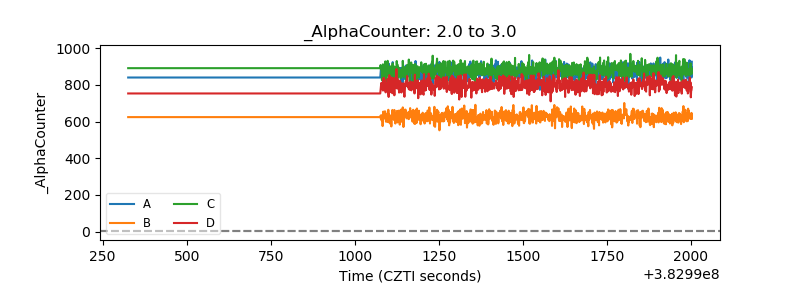 |
| _CPM_Rate | 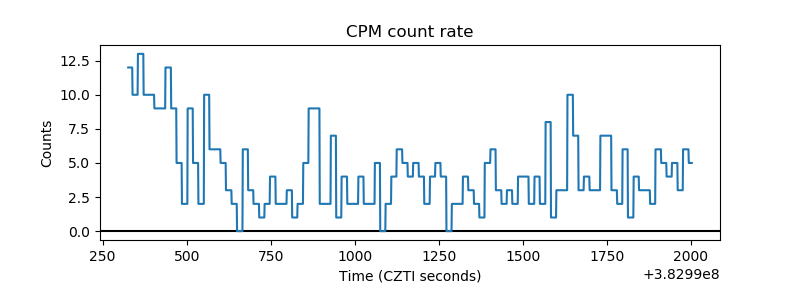 |
| CZT Counter | 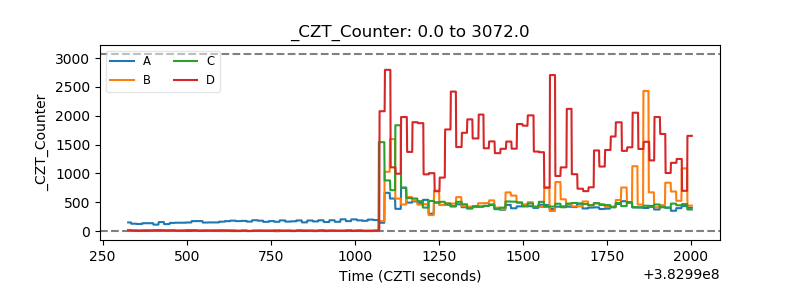 |
| +2.5 Volts monitor | 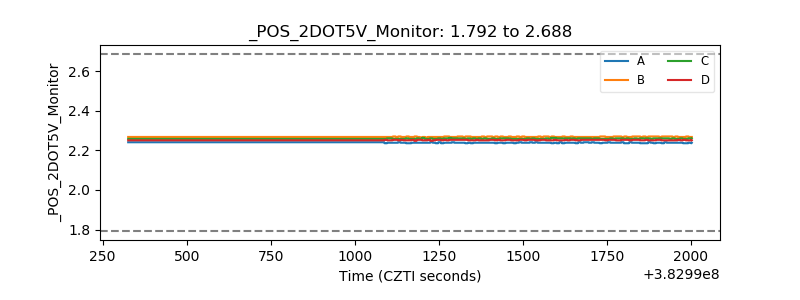 |
| +5 Volts monitor | 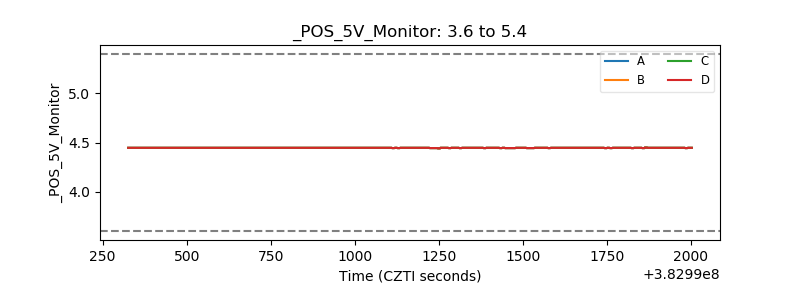 |
| _ROLL_ROT | 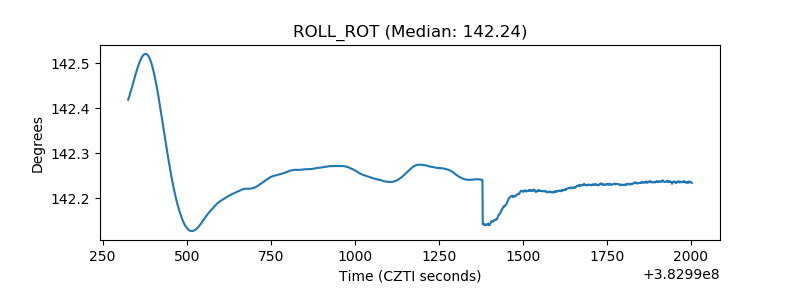 |
| _Roll_DEC | 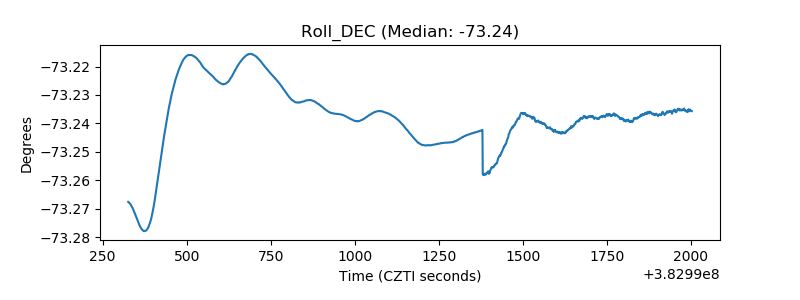 |
| _Roll_RA | 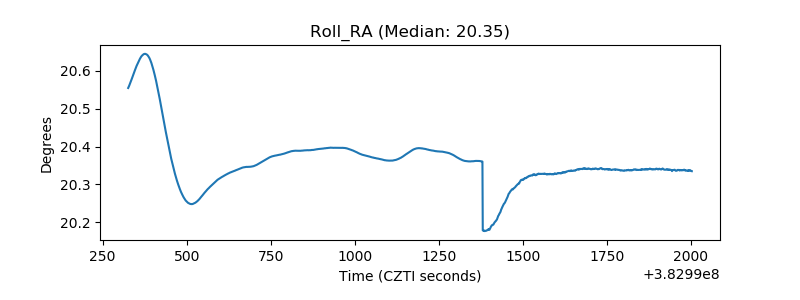 |
| Veto Counter | 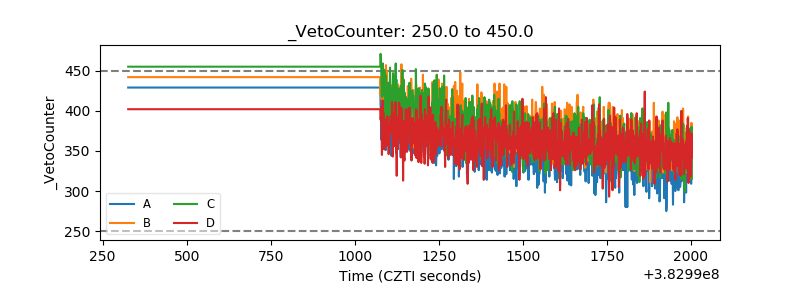 |