| Param | Original file | Final file |
|---|---|---|
| Filename | modeM0/AS1A09_038T43_9000004946_34586cztM0_level2.evt | modeM0/AS1A09_038T43_9000004946_34586cztM0_level2_quad_clean.evt |
| Size (bytes) | 483,350,400 | 90,483,840 |
| Size | 461.0 MB | 86.3 MB |
| Events in quadrant A | 2,245,523 | 621,785 |
| Events in quadrant B | 3,238,214 | 609,981 |
| Events in quadrant C | 2,500,643 | 610,731 |
| Events in quadrant D | 6,322,177 | 553,930 |
| Mode M0 | |||
|---|---|---|---|
| Quadrant | BADHDUFLAG | Total packets | Discarded packets |
| A | 0 | 9962 | 1 |
| B | 0 | 12809 | 1 |
| C | 0 | 10511 | 1 |
| D | 0 | 22299 | 1 |
| Mode SS | |||
|---|---|---|---|
| Quadrant | BADHDUFLAG | Total packets | Discarded packets |
| A | 0 | 100 | 0 |
| B | 0 | 100 | 0 |
| C | 0 | 100 | 0 |
| D | 0 | 100 | 0 |
| Mode M9 | |||
|---|---|---|---|
| Quadrant | BADHDUFLAG | Total packets | Discarded packets |
| A | 0 | 3 | 0 |
| B | 0 | 3 | 0 |
| C | 0 | 3 | 0 |
| D | 0 | 3 | 0 |
| Quadrant | Total seconds | Saturated seconds | Saturation percentage |
|---|---|---|---|
| A | 4897 | 6 | 0.122524% |
| B | 4897 | 297 | 6.064938% |
| C | 4897 | 18 | 0.367572% |
| D | 4898 | 396 | 8.084933% |
Noise dominated data is calculated using 1-second bins in cleaned event files. If a bin has >2000 counts, and if more than 50% of those come from <1% of pixels, then it is considered to be noise-dominated and hence unusable.
| Quadrant | # 1 sec bins | Bins with >0 counts | Bins with >2000 counts | High rate bins dominated by noise | Noise dominated (total time) | Noise dominated (detector-on time) | Marked lightcurve |
|---|---|---|---|---|---|---|---|
| A | 4897 | 4897 | 2 | 2 | 0.04% | 0.04% | 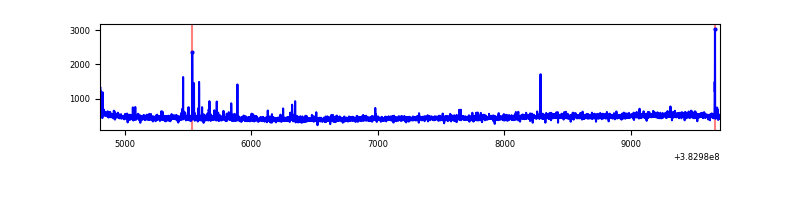 |
| B | 4897 | 4897 | 209 | 209 | 4.27% | 4.27% | 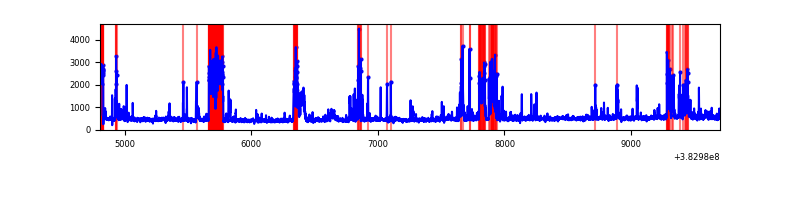 |
| C | 4897 | 4897 | 14 | 14 | 0.29% | 0.29% |  |
| D | 4898 | 4898 | 539 | 539 | 11.00% | 11.00% | 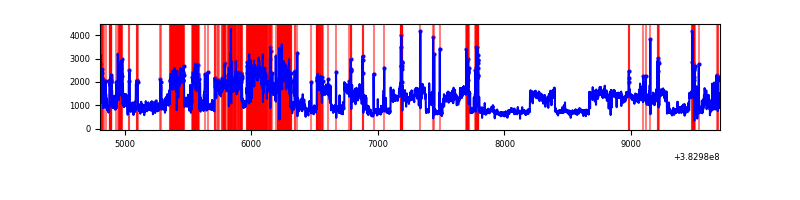 |
Top three noisy pixels from each quadrant. If the there are fewer than three noisy pixels in the level2.evt file, extra rows are filled as -1
| Pixel properties | Quadrant properties | ||||||
|---|---|---|---|---|---|---|---|
| Quadrant | DetID | PixID | Counts | Sigma | Mean | Median | Sigma |
| A | 9 | 143 | 37342 | 328.81 | 557 | 545 | 111.9 |
| A | 10 | 83 | 27415 | 240.11 | 557 | 545 | 111.9 |
| A | 13 | 6 | 13611 | 116.76 | 557 | 545 | 111.9 |
| B | 5 | 172 | 659262 | 6279.55 | 543 | 527 | 104.9 |
| B | 5 | 255 | 327033 | 3112.5 | 543 | 527 | 104.9 |
| B | 0 | 189 | 34287 | 321.83 | 543 | 527 | 104.9 |
| C | 15 | 214 | 202072 | 1597.18 | 542 | 546 | 126.2 |
| C | 14 | 67 | 93528 | 736.92 | 542 | 546 | 126.2 |
| C | 0 | 10 | 60353 | 474.0 | 542 | 546 | 126.2 |
| D | 8 | 195 | 3500058 | 24702.42 | 523 | 511 | 141.7 |
| D | 13 | 249 | 209516 | 1475.31 | 523 | 511 | 141.7 |
| D | 1 | 52 | 124899 | 878.02 | 523 | 511 | 141.7 |
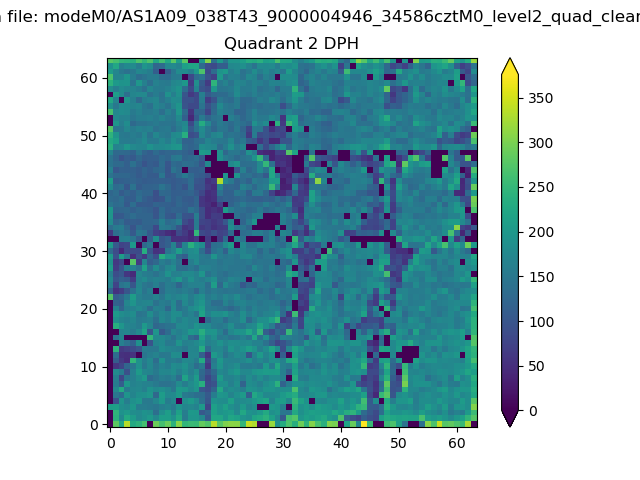
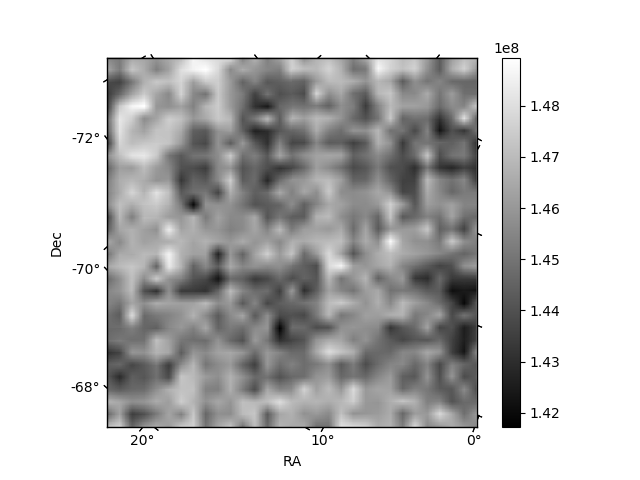
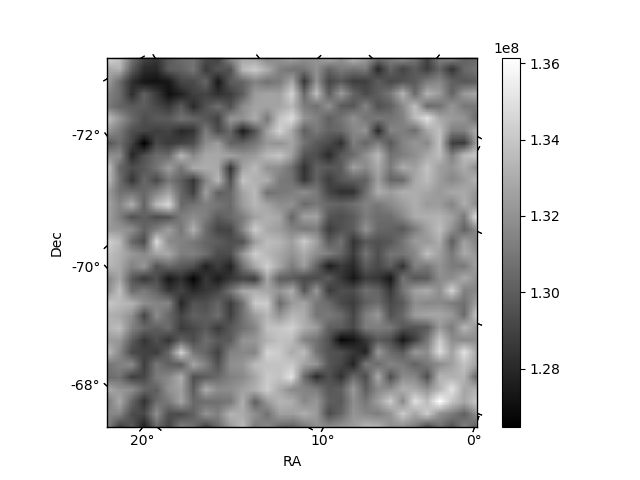
Histogram calculated using DETX and DETY for each event in the final _common_clean file
| Quadrant A | 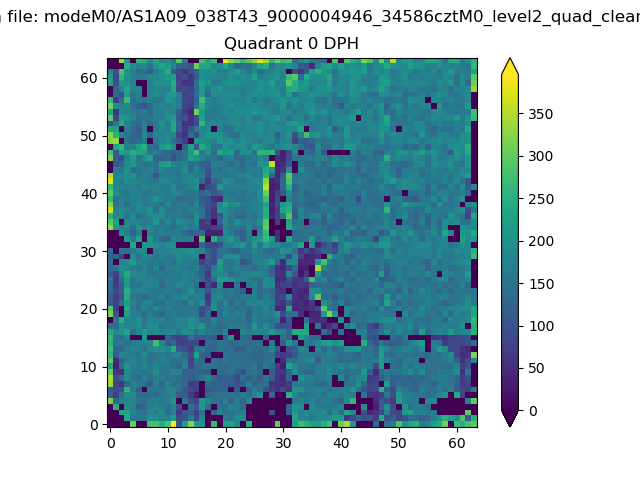 |
 |
Quadrant B |
|---|---|---|---|
| Quadrant D | 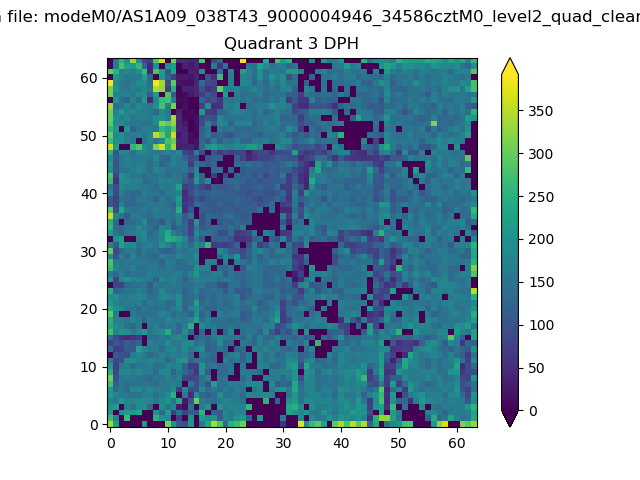 |
 |
Quadrant C |
| Plot type | Count rate plots | Images |
|---|---|---|
| Comparison with Poisson distribution Blue bars denote a histogram of data divided into 1 sec bins. Red curve is a Poisson curve with rate = median count rate of data. |
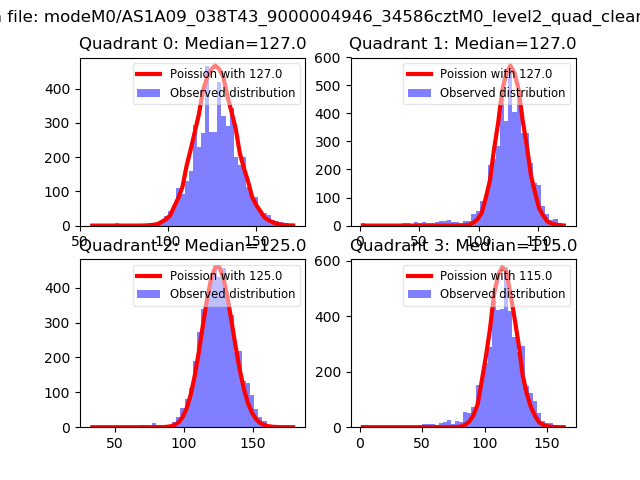 |
 |
| Quadrant-wise count rates Data is divided into 100 sec bins |
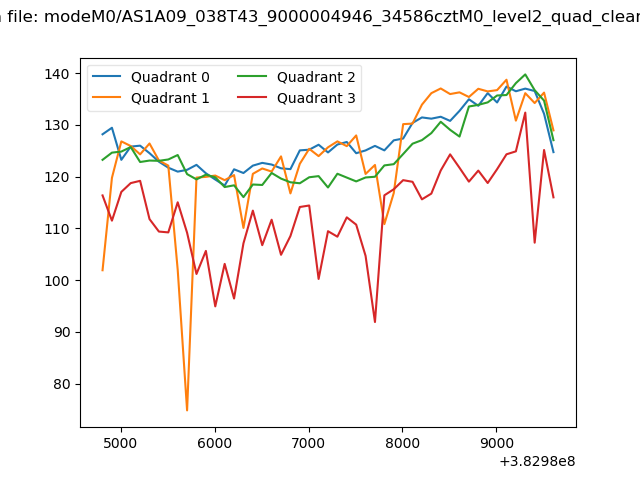 |
|
| Module-wise count rates for Quadrant A Data is divided into 100 sec bins |
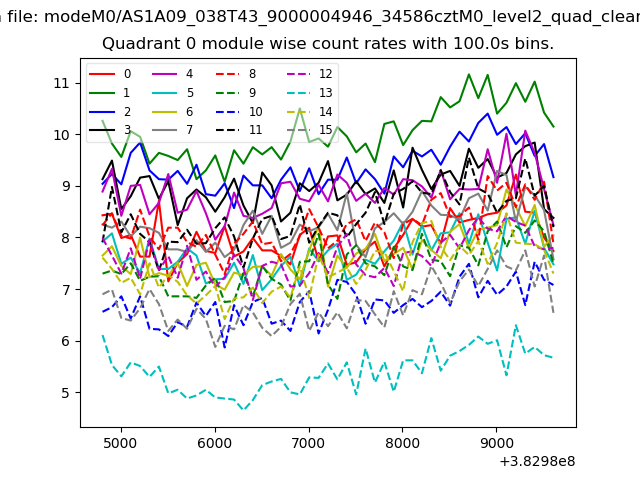 |
 |
| Module-wise count rates for Quadrant B Data is divided into 100 sec bins |
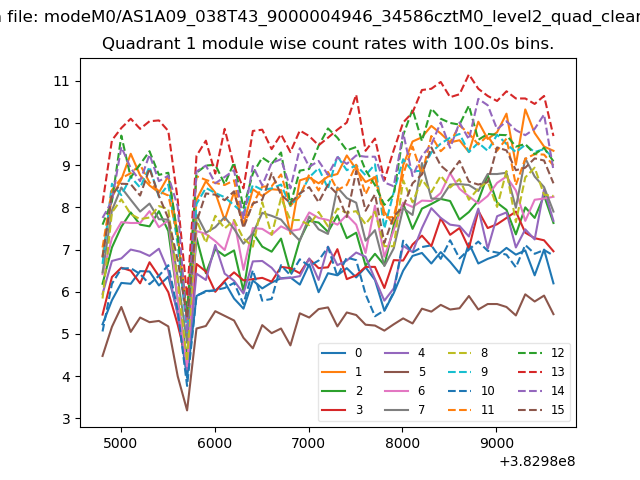 |
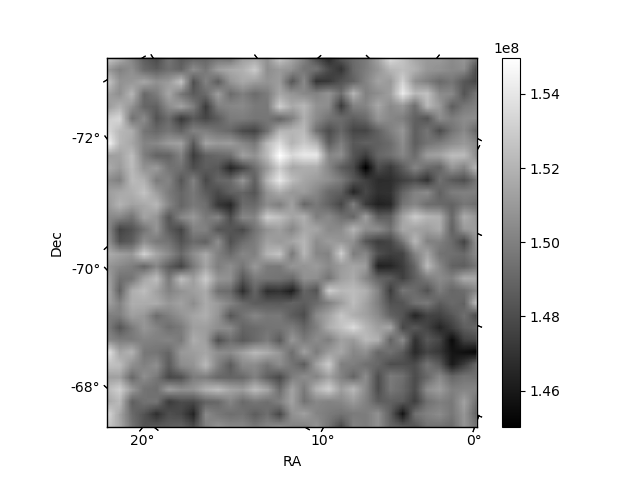 |
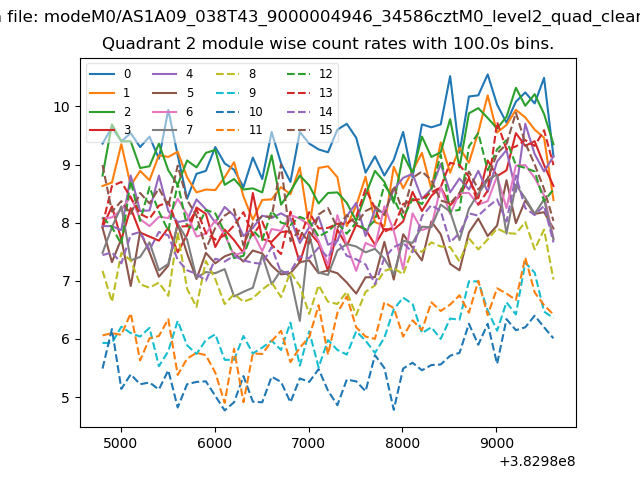
| Module-wise count rates for Quadrant C Data is divided into 100 sec bins |
 |
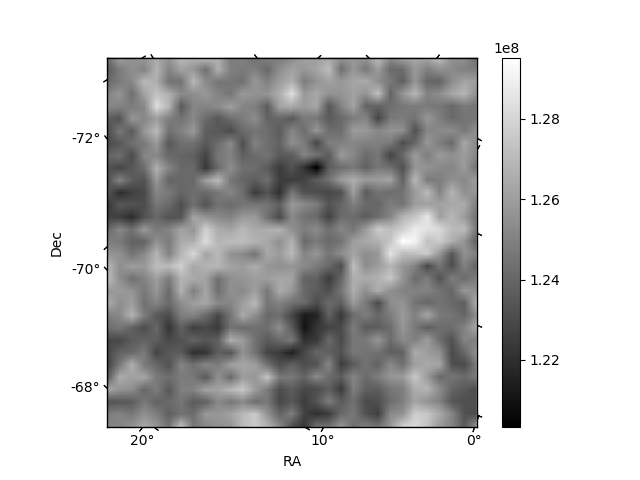 |
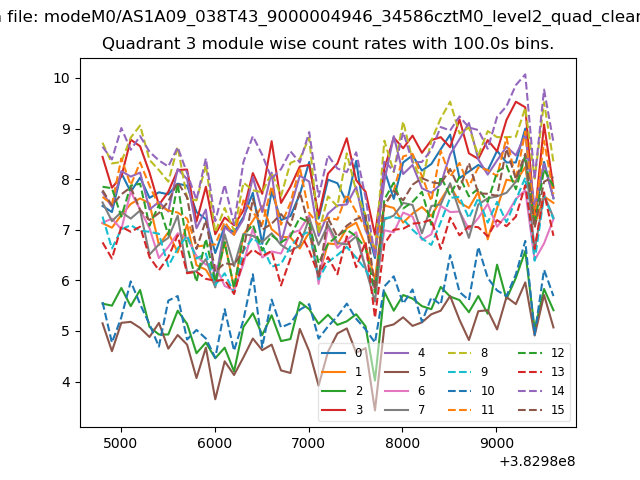
| Module-wise count rates for Quadrant D Data is divided into 100 sec bins |
 |
 |
| Parameter | Plot |
|---|---|
| CZT HV Monitor | 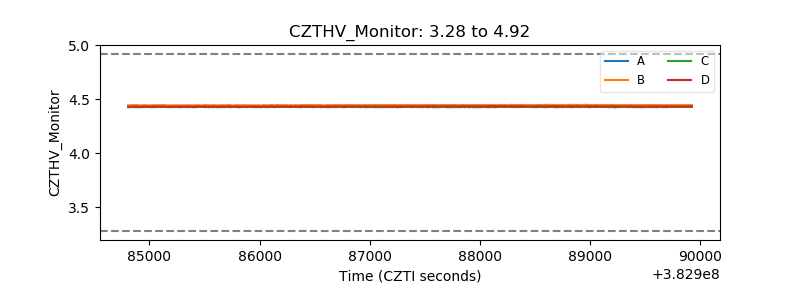 |
| D_VDD | 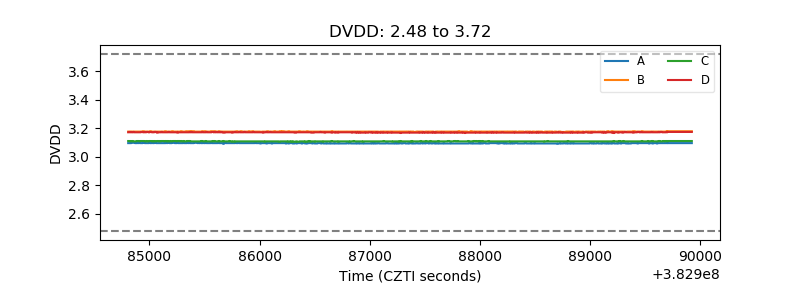 |
| Temperature 1 | 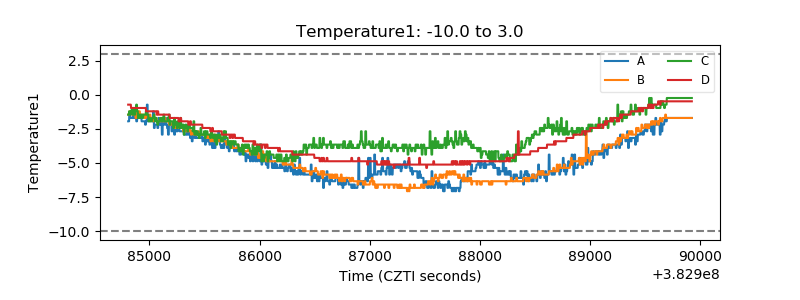 |
| Veto HV Monitor | 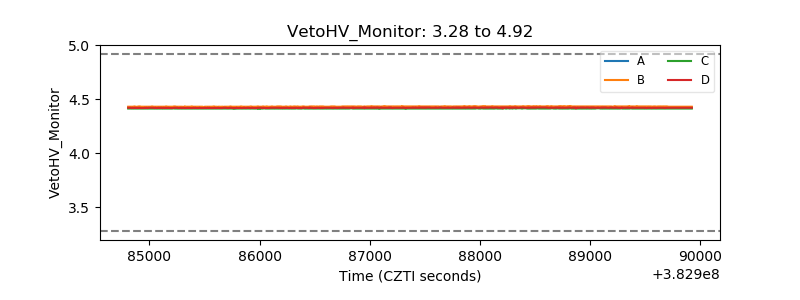 |
| Veto LLD | 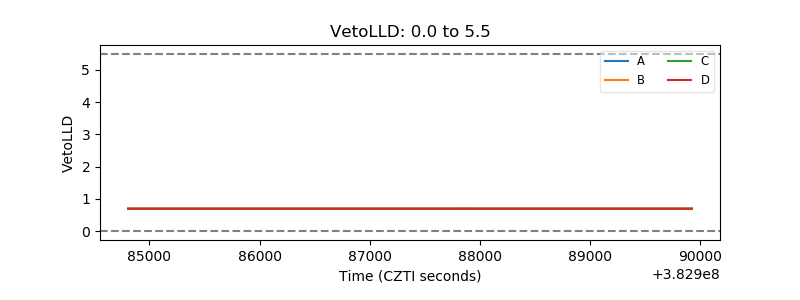 |
| Alpha Counter | 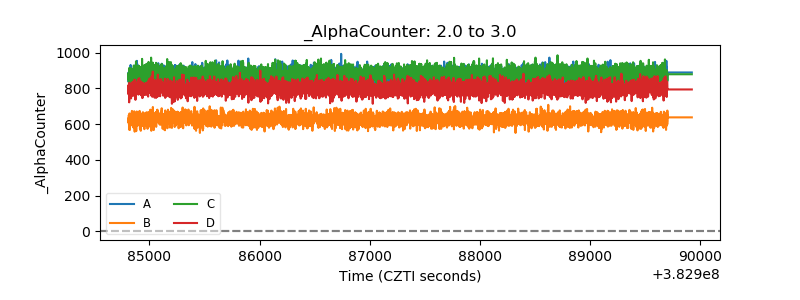 |
| _CPM_Rate | 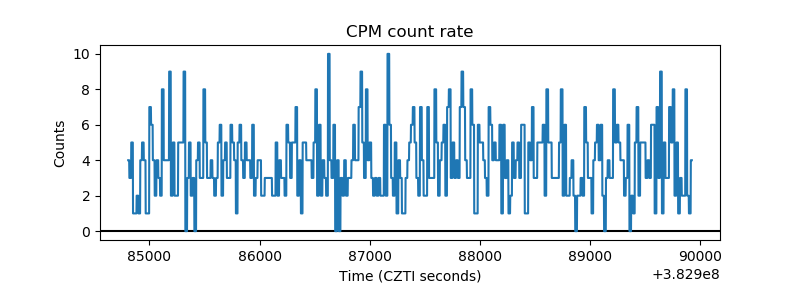 |
| CZT Counter | 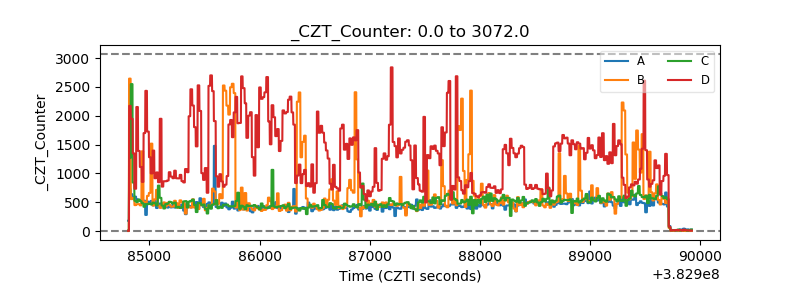 |
| +2.5 Volts monitor | 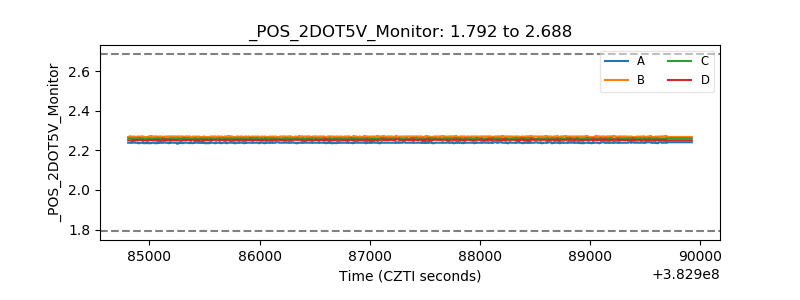 |
| +5 Volts monitor | 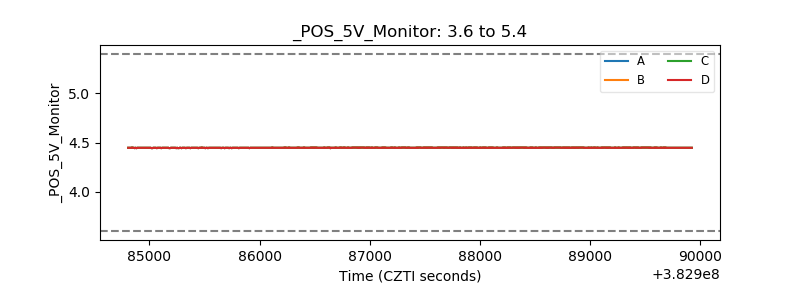 |
| _ROLL_ROT | 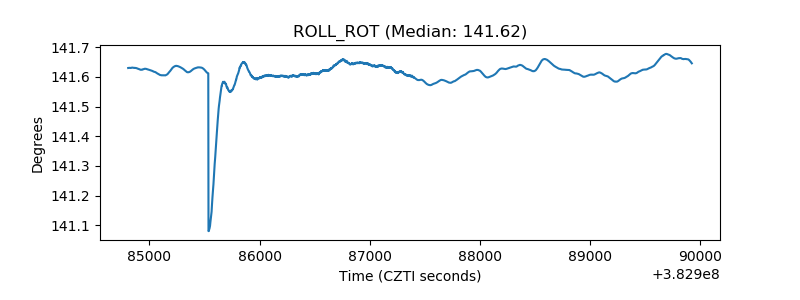 |
| _Roll_DEC | 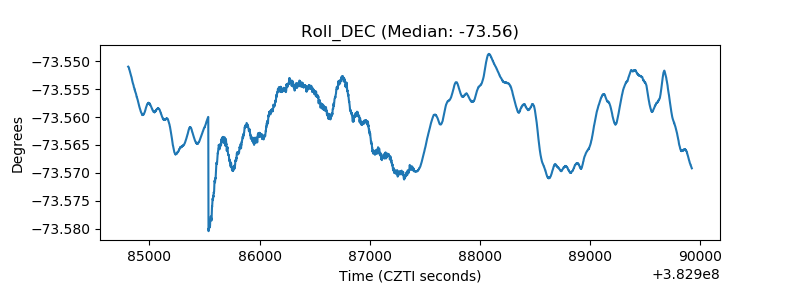 |
| _Roll_RA | 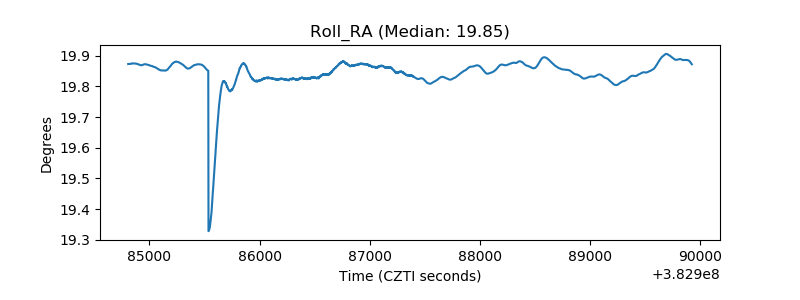 |
| Veto Counter | 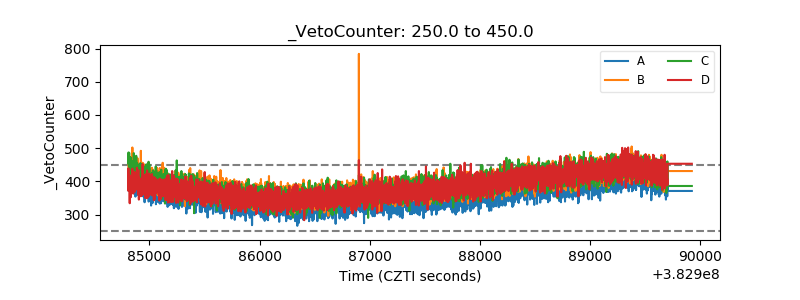 |