| Param | Original file | Final file |
|---|---|---|
| Filename | modeM0/AS1A05_176T05_9000004944_34584cztM0_level2.evt | modeM0/AS1A05_176T05_9000004944_34584cztM0_level2_quad_clean.evt |
| Size (bytes) | 557,602,560 | 56,298,240 |
| Size | 531.8 MB | 53.7 MB |
| Events in quadrant A | 2,558,240 | 349,124 |
| Events in quadrant B | 2,849,084 | 352,054 |
| Events in quadrant C | 2,851,351 | 353,271 |
| Events in quadrant D | 8,276,266 | 285,148 |
| Mode SS | |||
|---|---|---|---|
| Quadrant | BADHDUFLAG | Total packets | Discarded packets |
| A | 0 | 104 | 0 |
| B | 0 | 104 | 0 |
| C | 0 | 104 | 0 |
| D | 0 | 104 | 0 |
| Mode M9 | |||
|---|---|---|---|
| Quadrant | BADHDUFLAG | Total packets | Discarded packets |
| A | 0 | 31 | 0 |
| B | 0 | 31 | 0 |
| C | 0 | 31 | 0 |
| D | 0 | 32 | 0 |
| Mode M0 | |||
|---|---|---|---|
| Quadrant | BADHDUFLAG | Total packets | Discarded packets |
| A | 0 | 10794 | 3 |
| B | 0 | 11554 | 2 |
| C | 0 | 11377 | 2 |
| D | 0 | 28304 | 2 |
| Quadrant | Total seconds | Saturated seconds | Saturation percentage |
|---|---|---|---|
| A | 5211 | 11 | 0.211092% |
| B | 5211 | 35 | 0.671656% |
| C | 5211 | 43 | 0.825178% |
| D | 5211 | 1375 | 26.386490% |
Noise dominated data is calculated using 1-second bins in cleaned event files. If a bin has >2000 counts, and if more than 50% of those come from <1% of pixels, then it is considered to be noise-dominated and hence unusable.
| Quadrant | # 1 sec bins | Bins with >0 counts | Bins with >2000 counts | High rate bins dominated by noise | Noise dominated (total time) | Noise dominated (detector-on time) | Marked lightcurve |
|---|---|---|---|---|---|---|---|
| A | 7154 | 5212 | 3 | 3 | 0.04% | 0.06% | 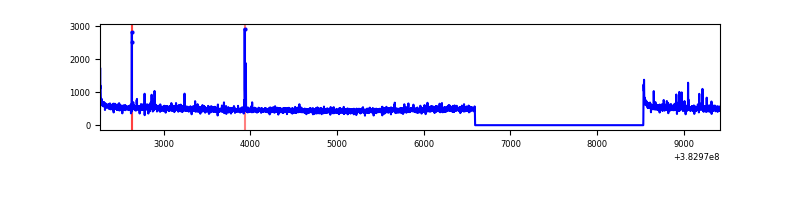 |
| B | 7154 | 5212 | 21 | 21 | 0.29% | 0.40% | 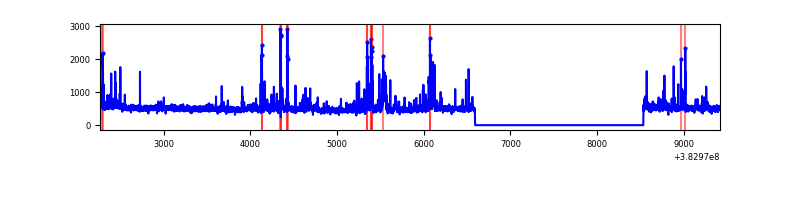 |
| C | 7154 | 5212 | 28 | 28 | 0.39% | 0.54% | 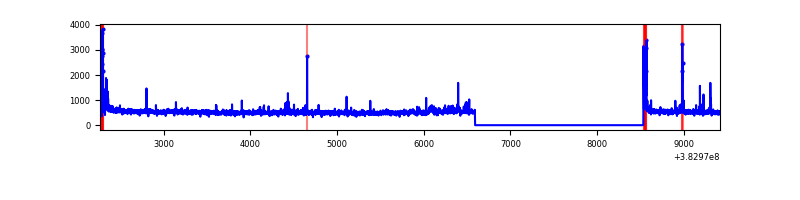 |
| D | 7154 | 5212 | 1397 | 1397 | 19.53% | 26.80% | 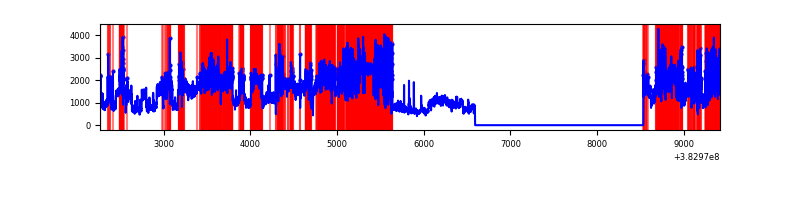 |
Top three noisy pixels from each quadrant. If the there are fewer than three noisy pixels in the level2.evt file, extra rows are filled as -1
| Pixel properties | Quadrant properties | ||||||
|---|---|---|---|---|---|---|---|
| Quadrant | DetID | PixID | Counts | Sigma | Mean | Median | Sigma |
| A | 10 | 83 | 44386 | 343.58 | 633 | 621 | 127.4 |
| A | 9 | 143 | 23969 | 183.3 | 633 | 621 | 127.4 |
| A | 15 | 174 | 18002 | 136.45 | 633 | 621 | 127.4 |
| B | 5 | 172 | 148913 | 1222.59 | 627 | 611 | 121.3 |
| B | 0 | 189 | 114809 | 941.44 | 627 | 611 | 121.3 |
| B | 0 | 190 | 52588 | 428.5 | 627 | 611 | 121.3 |
| C | 15 | 214 | 222517 | 1537.72 | 616 | 621 | 144.3 |
| C | 0 | 10 | 121919 | 840.59 | 616 | 621 | 144.3 |
| C | 14 | 67 | 50405 | 345.0 | 616 | 621 | 144.3 |
| D | 8 | 195 | 3778752 | 27233.3 | 561 | 545 | 138.7 |
| D | 5 | 223 | 1039442 | 7488.37 | 561 | 545 | 138.7 |
| D | 1 | 52 | 582415 | 4194.12 | 561 | 545 | 138.7 |
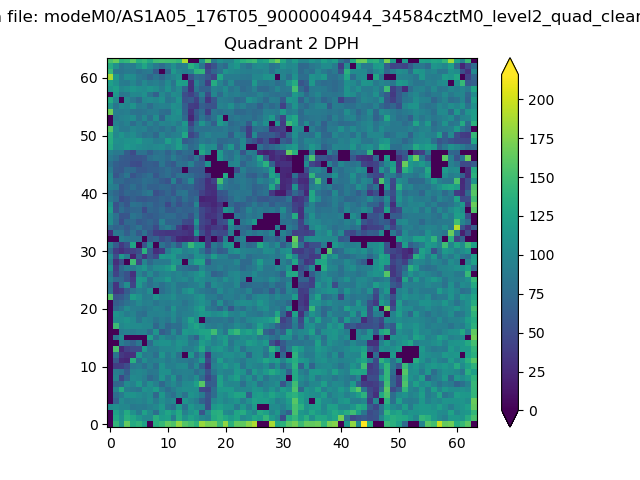
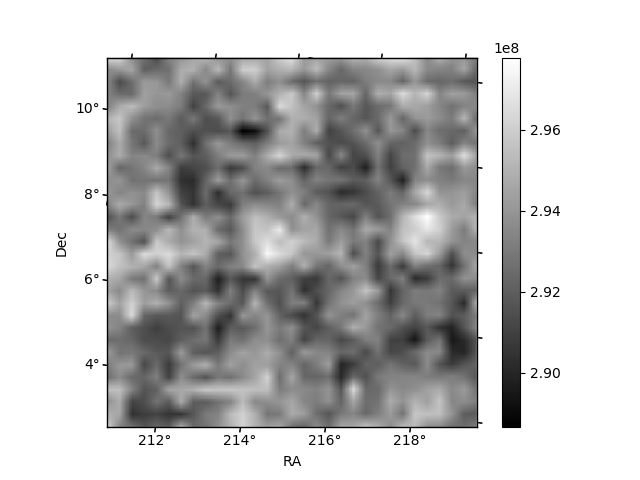
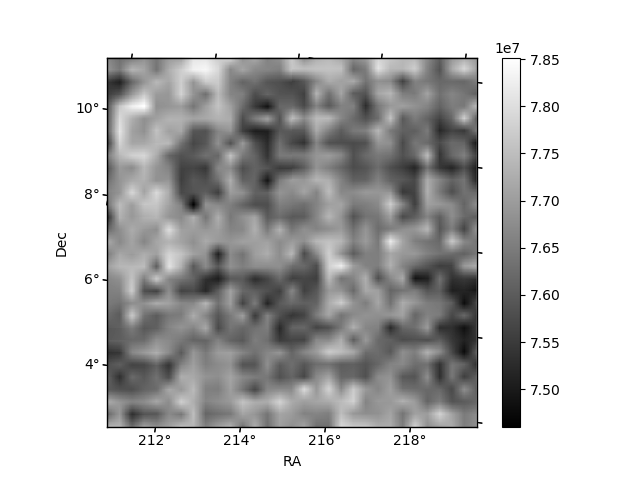
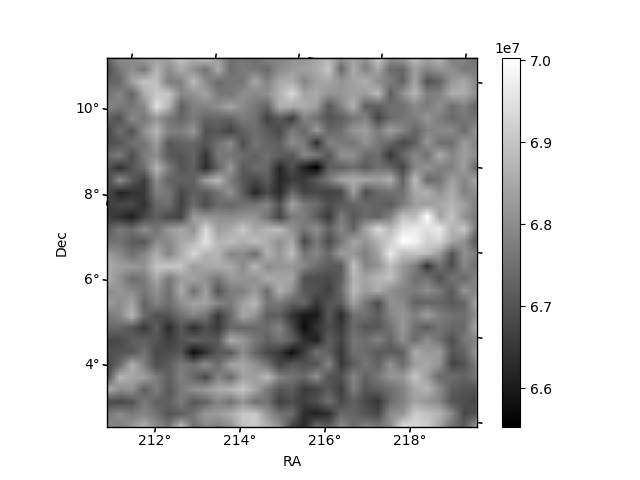
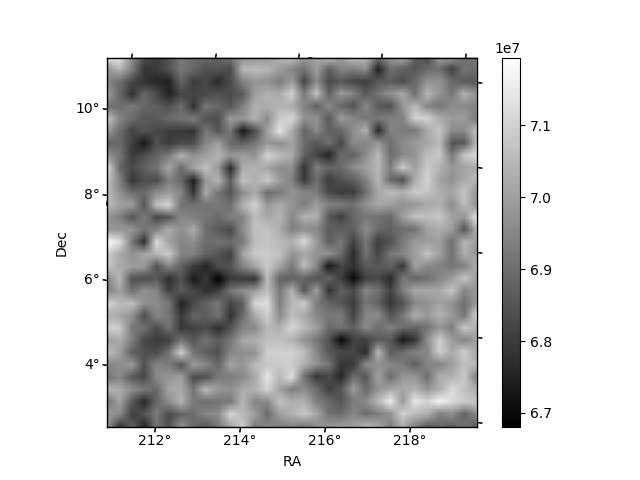
Histogram calculated using DETX and DETY for each event in the final _common_clean file
| Quadrant A | 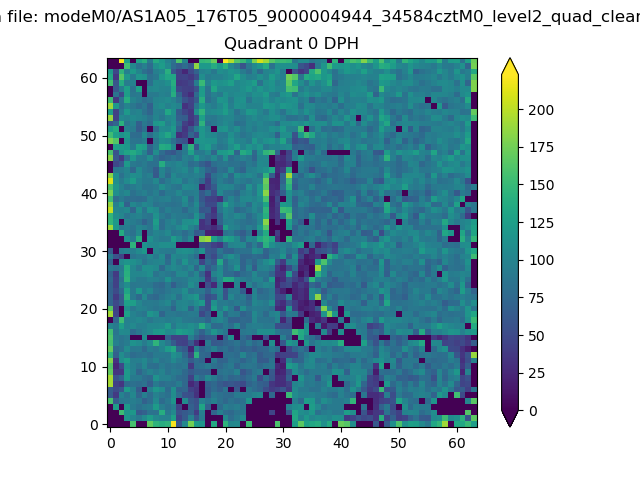 |
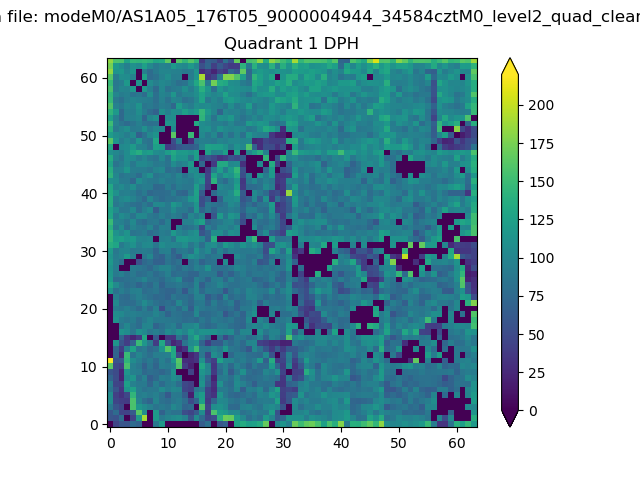 |
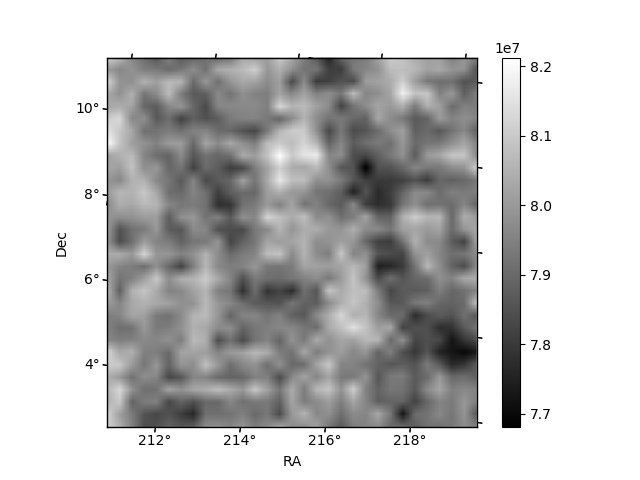
Quadrant B |
|---|---|---|---|
| Quadrant D | 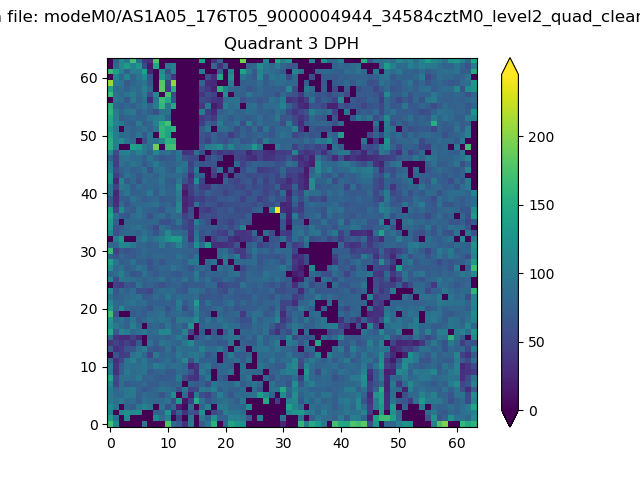 |
 |
Quadrant C |
| Plot type | Count rate plots | Images |
|---|---|---|
| Comparison with Poisson distribution Blue bars denote a histogram of data divided into 1 sec bins. Red curve is a Poisson curve with rate = median count rate of data. |
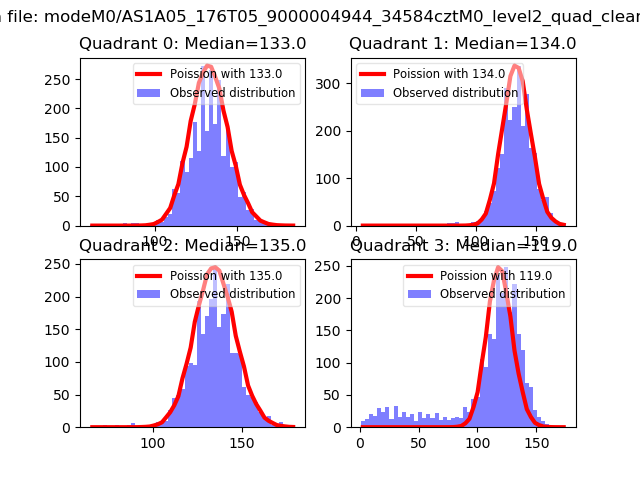 |
 |
| Quadrant-wise count rates Data is divided into 100 sec bins |
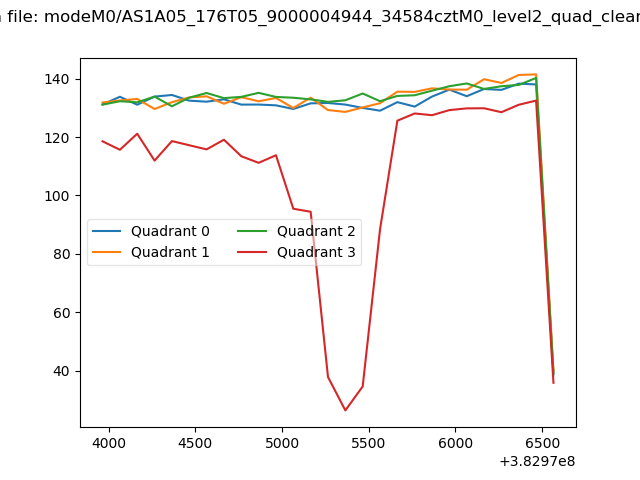 |
|
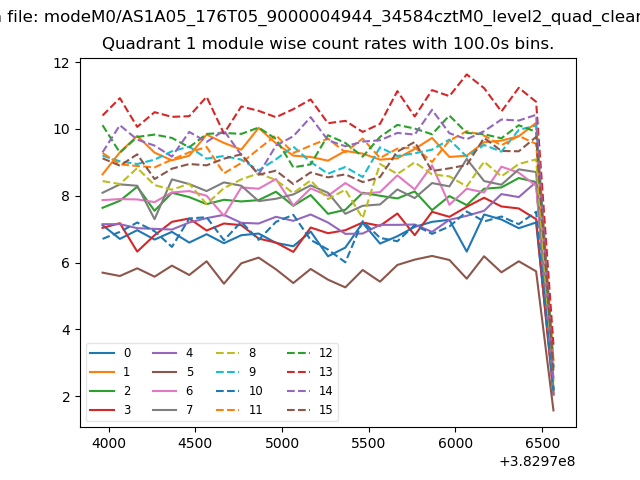
| Module-wise count rates for Quadrant A Data is divided into 100 sec bins |
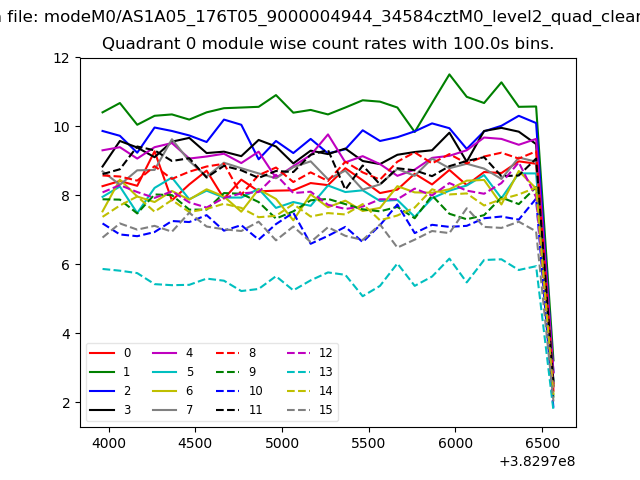 |
 |
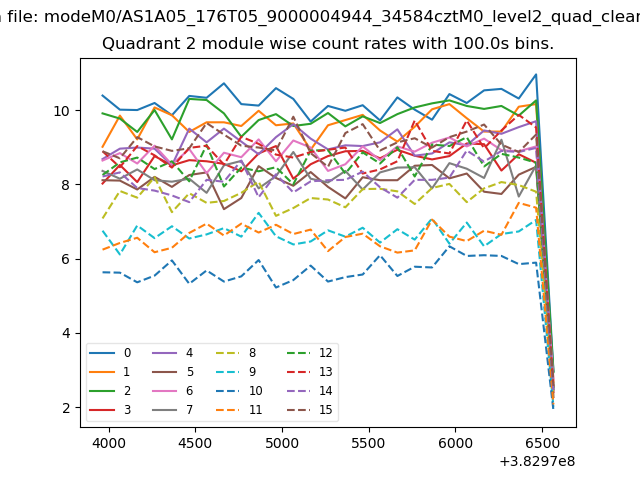
| Module-wise count rates for Quadrant B Data is divided into 100 sec bins |
 |
 |
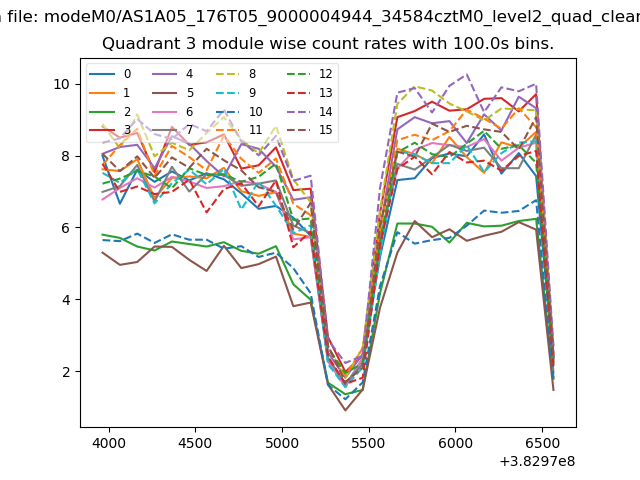
| Module-wise count rates for Quadrant C Data is divided into 100 sec bins |
 |
 |
| Module-wise count rates for Quadrant D Data is divided into 100 sec bins |
 |
 |
| Parameter | Plot |
|---|---|
| CZT HV Monitor | 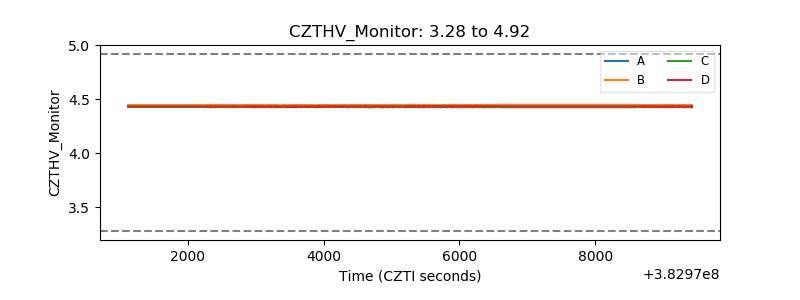 |
| D_VDD | 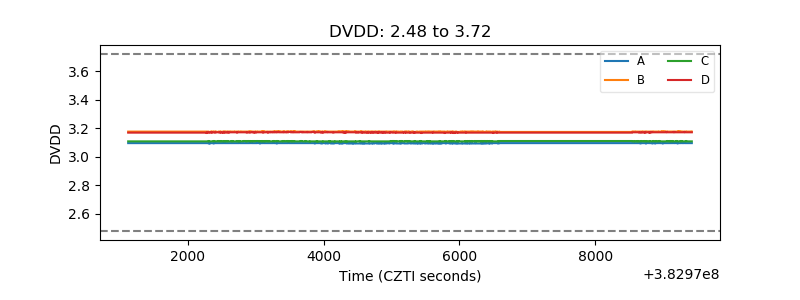 |
| Temperature 1 | 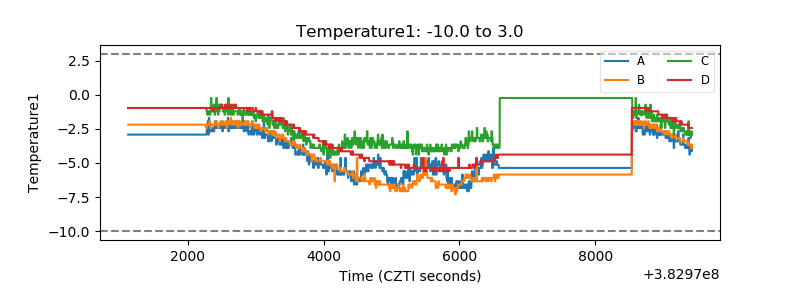 |
| Veto HV Monitor | 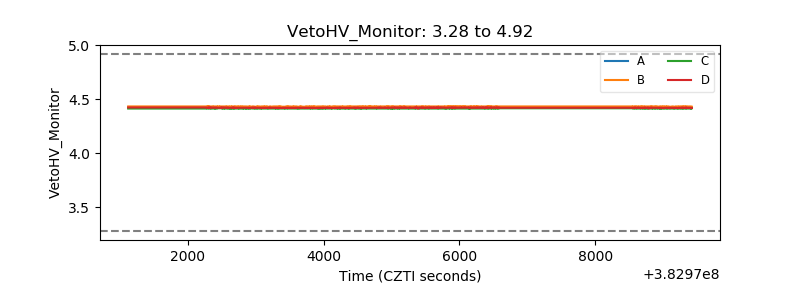 |
| Veto LLD | 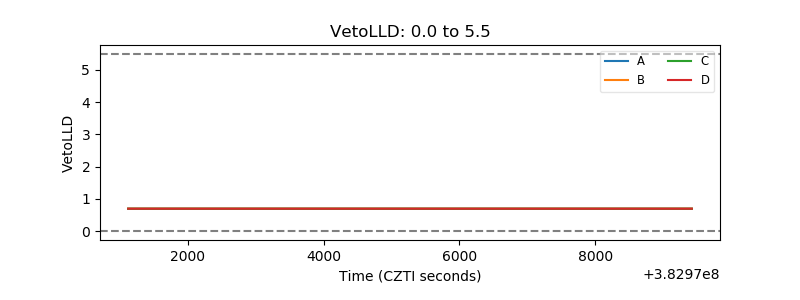 |
| Alpha Counter | 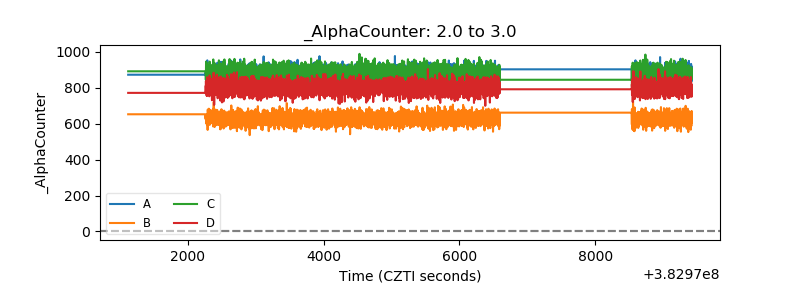 |
| _CPM_Rate | 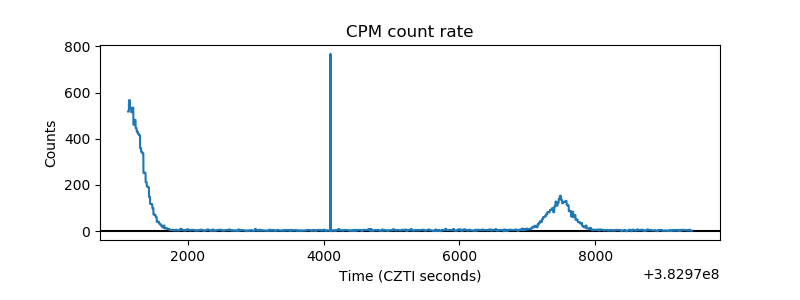 |
| CZT Counter | 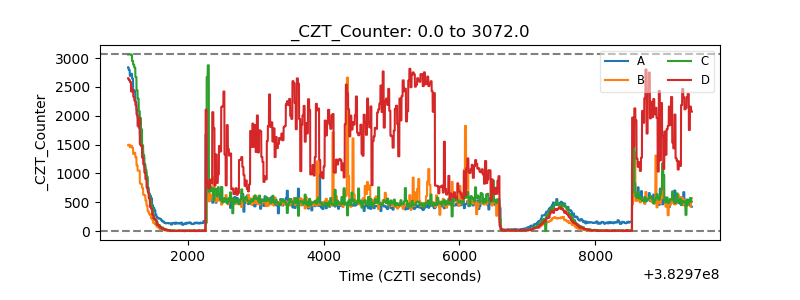 |
| +2.5 Volts monitor | 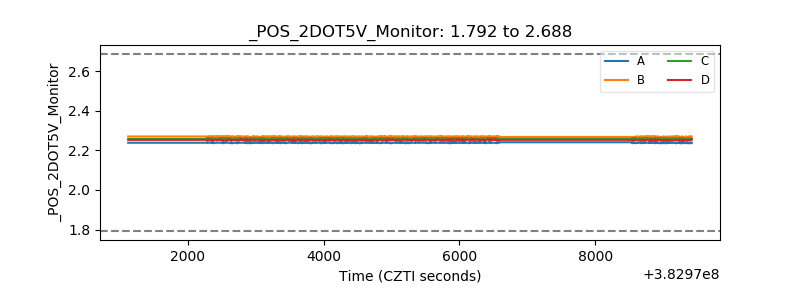 |
| +5 Volts monitor | 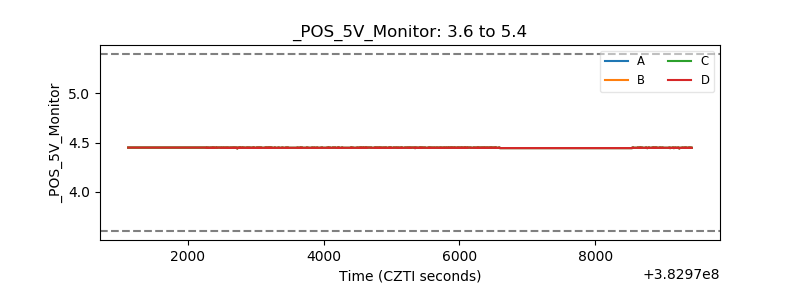 |
| _ROLL_ROT | 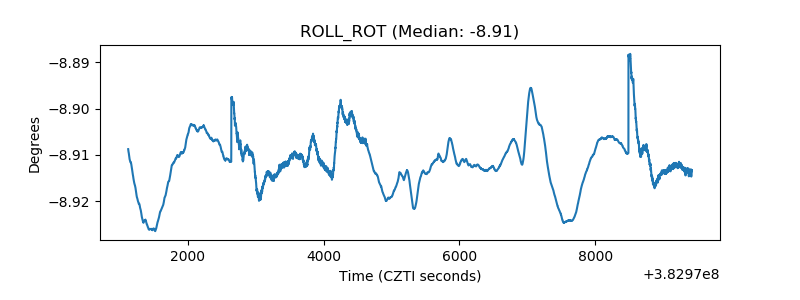 |
| _Roll_DEC | 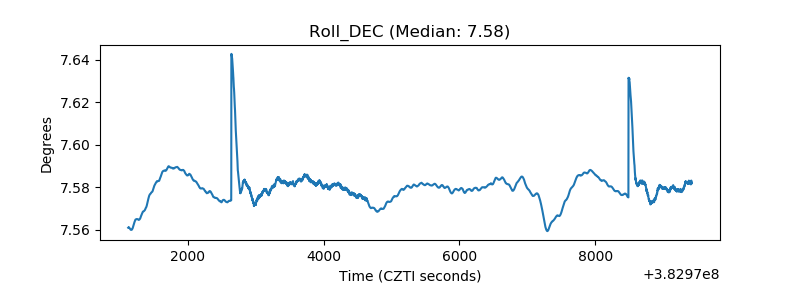 |
| _Roll_RA | 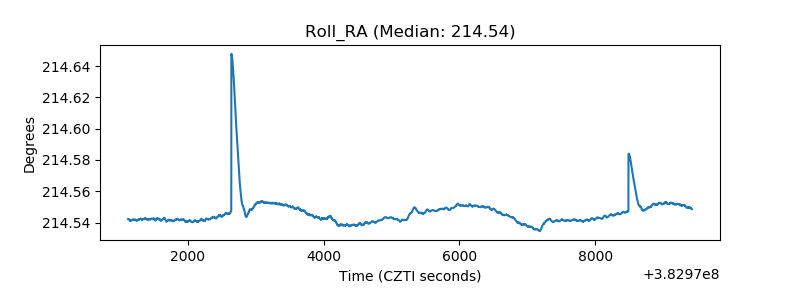 |
| Veto Counter | 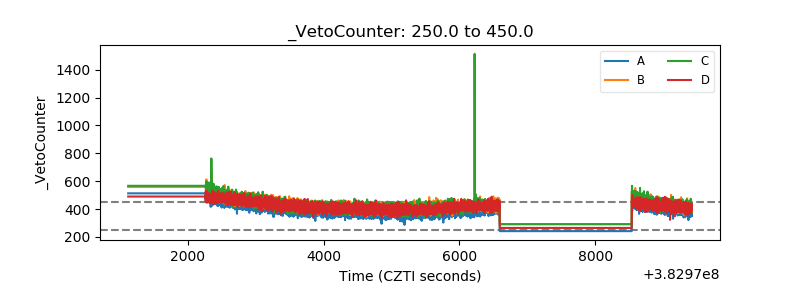 |