| Param | Original file | Final file |
|---|---|---|
| Filename | modeM0/AS1A05_176T05_9000004944_34583cztM0_level2.evt | modeM0/AS1A05_176T05_9000004944_34583cztM0_level2_quad_clean.evt |
| Size (bytes) | 222,592,320 | 26,608,320 |
| Size | 212.3 MB | 25.4 MB |
| Events in quadrant A | 1,126,822 | 164,053 |
| Events in quadrant B | 1,399,400 | 161,020 |
| Events in quadrant C | 1,300,402 | 165,051 |
| Events in quadrant D | 2,761,316 | 153,613 |
| Mode SS | |||
|---|---|---|---|
| Quadrant | BADHDUFLAG | Total packets | Discarded packets |
| A | 0 | 46 | 0 |
| B | 0 | 46 | 0 |
| C | 0 | 46 | 0 |
| D | 0 | 46 | 0 |
| Mode M9 | |||
|---|---|---|---|
| Quadrant | BADHDUFLAG | Total packets | Discarded packets |
| A | 0 | 21 | 0 |
| B | 0 | 21 | 0 |
| C | 0 | 21 | 0 |
| D | 0 | 21 | 0 |
| Mode M0 | |||
|---|---|---|---|
| Quadrant | BADHDUFLAG | Total packets | Discarded packets |
| A | 0 | 4641 | 2 |
| B | 0 | 5449 | 1 |
| C | 0 | 5099 | 1 |
| D | 0 | 9796 | 1 |
| Quadrant | Total seconds | Saturated seconds | Saturation percentage |
|---|---|---|---|
| A | 2235 | 6 | 0.268456% |
| B | 2235 | 64 | 2.863535% |
| C | 2235 | 23 | 1.029083% |
| D | 2235 | 168 | 7.516779% |
Noise dominated data is calculated using 1-second bins in cleaned event files. If a bin has >2000 counts, and if more than 50% of those come from <1% of pixels, then it is considered to be noise-dominated and hence unusable.
| Quadrant | # 1 sec bins | Bins with >0 counts | Bins with >2000 counts | High rate bins dominated by noise | Noise dominated (total time) | Noise dominated (detector-on time) | Marked lightcurve |
|---|---|---|---|---|---|---|---|
| A | 4358 | 2236 | 2 | 2 | 0.05% | 0.09% | 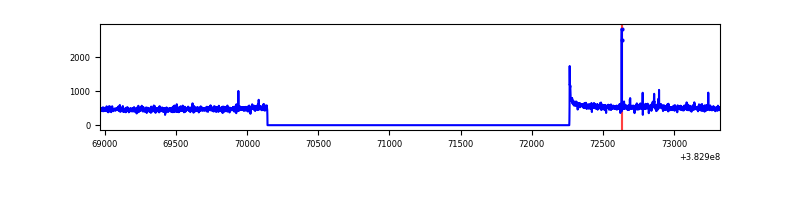 |
| B | 4358 | 2236 | 38 | 38 | 0.87% | 1.70% | 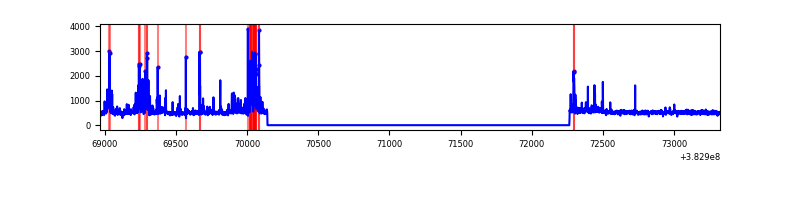 |
| C | 4358 | 2236 | 19 | 19 | 0.44% | 0.85% | 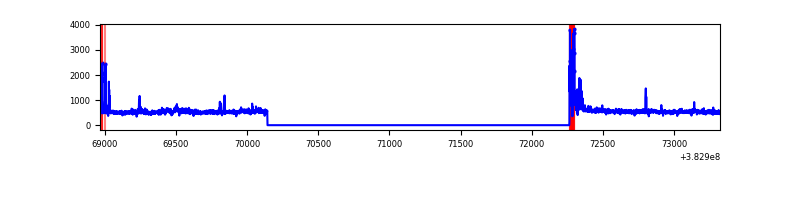 |
| D | 4358 | 2236 | 139 | 139 | 3.19% | 6.22% | 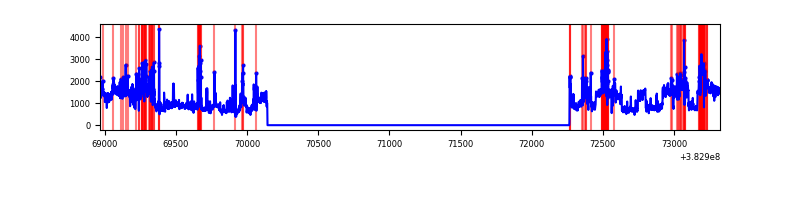 |
Top three noisy pixels from each quadrant. If the there are fewer than three noisy pixels in the level2.evt file, extra rows are filled as -1
| Pixel properties | Quadrant properties | ||||||
|---|---|---|---|---|---|---|---|
| Quadrant | DetID | PixID | Counts | Sigma | Mean | Median | Sigma |
| A | 10 | 83 | 21185 | 363.41 | 281 | 275 | 57.5 |
| A | 9 | 143 | 9139 | 154.06 | 281 | 275 | 57.5 |
| A | 15 | 174 | 5592 | 92.41 | 281 | 275 | 57.5 |
| B | 5 | 172 | 230679 | 4202.35 | 275 | 268 | 54.8 |
| B | 0 | 189 | 35467 | 641.98 | 275 | 268 | 54.8 |
| B | 5 | 255 | 14011 | 250.65 | 275 | 268 | 54.8 |
| C | 15 | 214 | 95978 | 1470.12 | 273 | 275 | 65.1 |
| C | 0 | 10 | 77301 | 1183.22 | 273 | 275 | 65.1 |
| C | 0 | 207 | 32349 | 492.7 | 273 | 275 | 65.1 |
| D | 8 | 195 | 1164442 | 17411.22 | 267 | 259 | 66.9 |
| D | 1 | 52 | 199269 | 2976.34 | 267 | 259 | 66.9 |
| D | 2 | 250 | 97981 | 1461.5 | 267 | 259 | 66.9 |
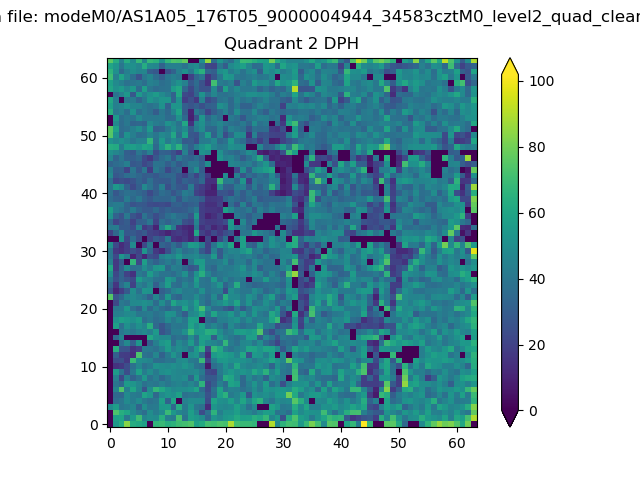
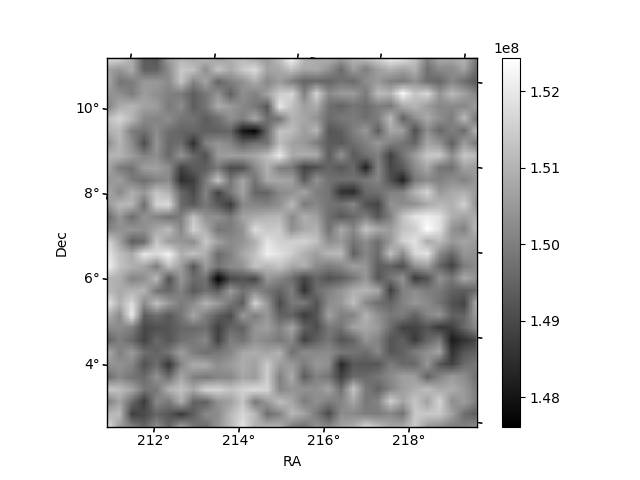
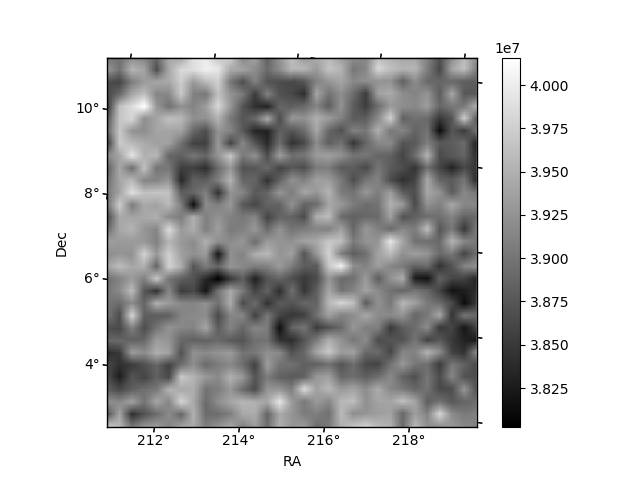
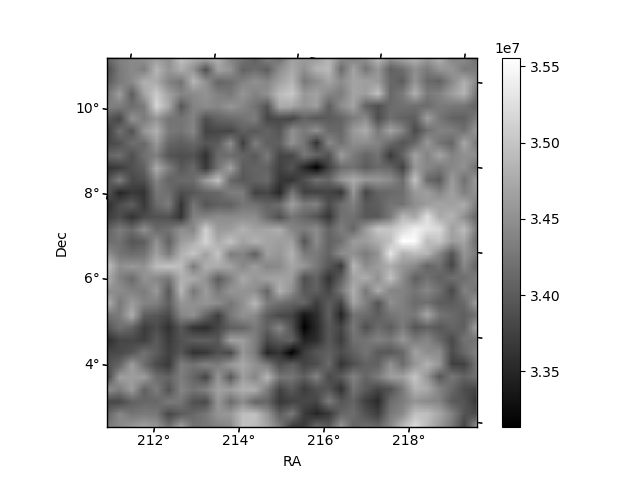
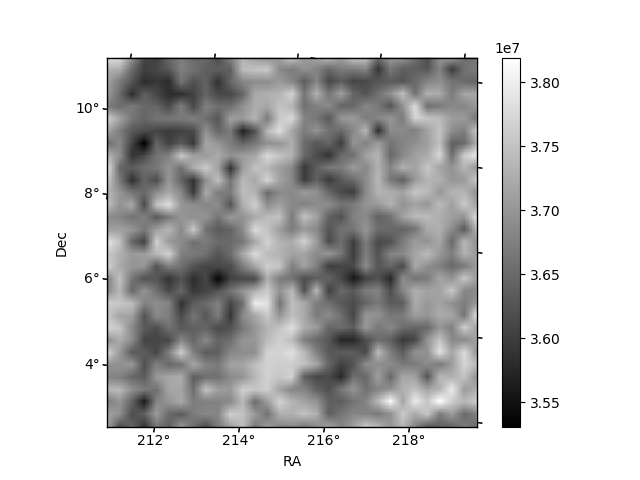
Histogram calculated using DETX and DETY for each event in the final _common_clean file
| Quadrant A | 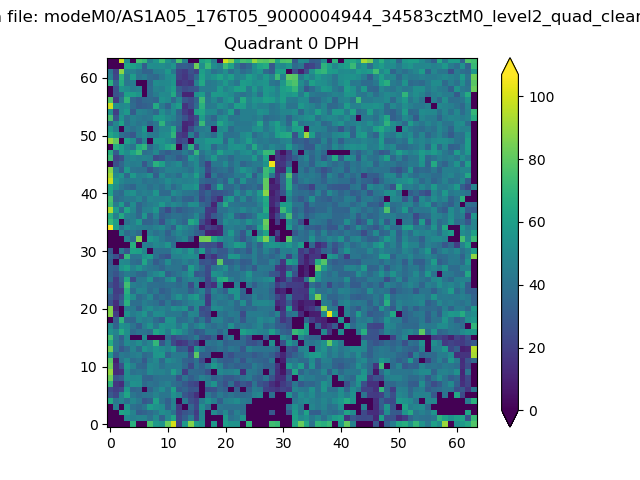 |
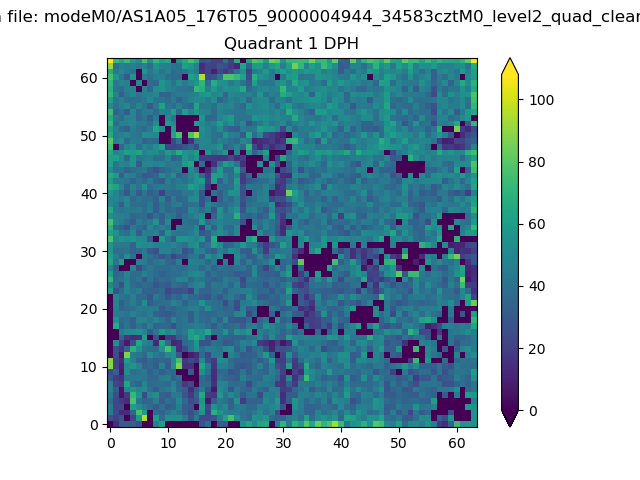 |
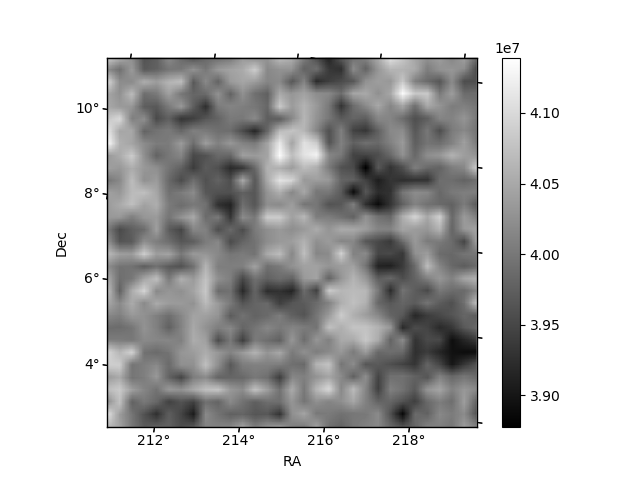
Quadrant B |
|---|---|---|---|
| Quadrant D | 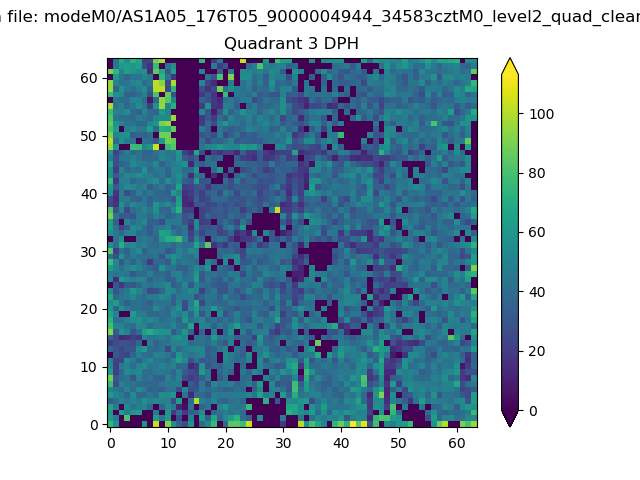 |
 |
Quadrant C |
| Plot type | Count rate plots | Images |
|---|---|---|
| Comparison with Poisson distribution Blue bars denote a histogram of data divided into 1 sec bins. Red curve is a Poisson curve with rate = median count rate of data. |
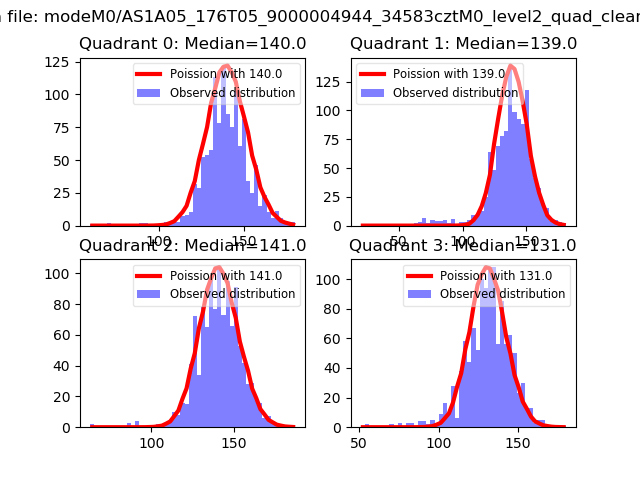 |
 |
| Quadrant-wise count rates Data is divided into 100 sec bins |
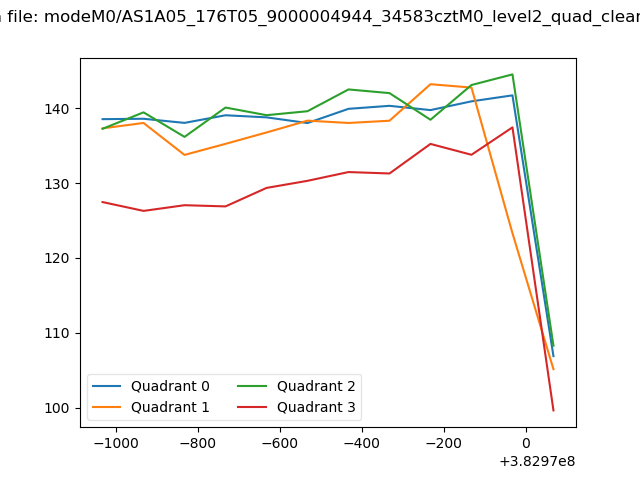 |
|
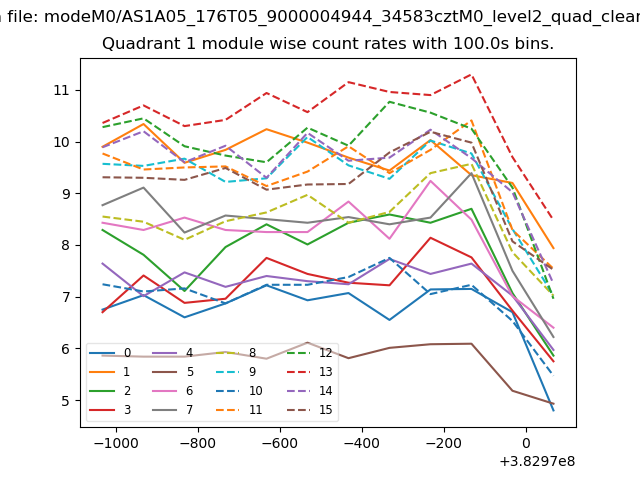
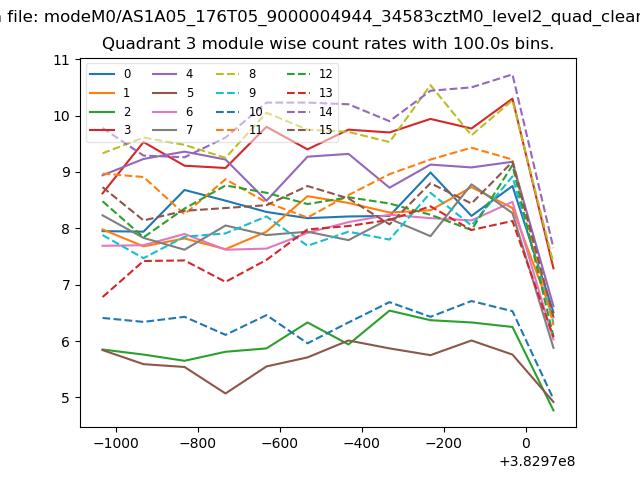
| Module-wise count rates for Quadrant A Data is divided into 100 sec bins |
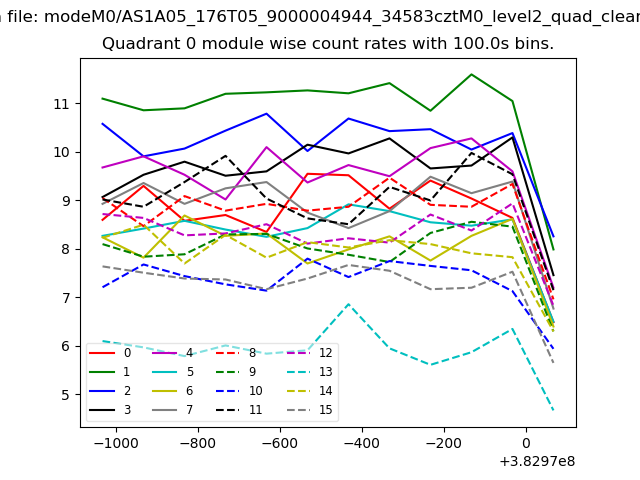 |
 |
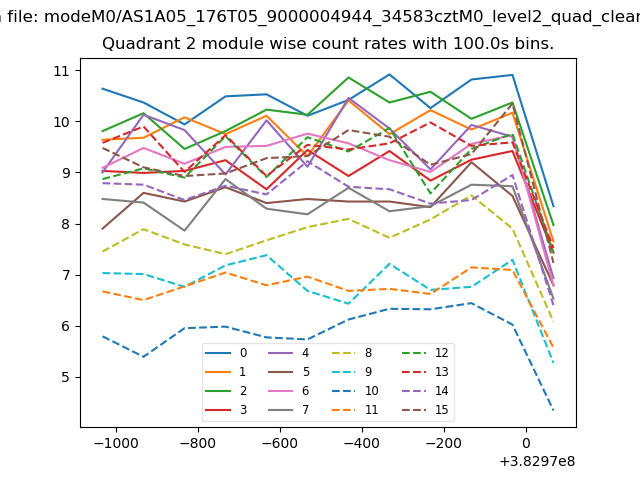
| Module-wise count rates for Quadrant B Data is divided into 100 sec bins |
 |
 |
| Module-wise count rates for Quadrant C Data is divided into 100 sec bins |
 |
 |
| Module-wise count rates for Quadrant D Data is divided into 100 sec bins |
 |
 |
| Parameter | Plot |
|---|---|
| CZT HV Monitor |  |
| D_VDD | 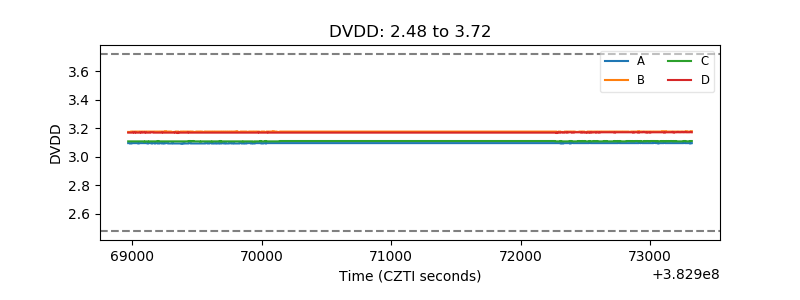 |
| Temperature 1 | 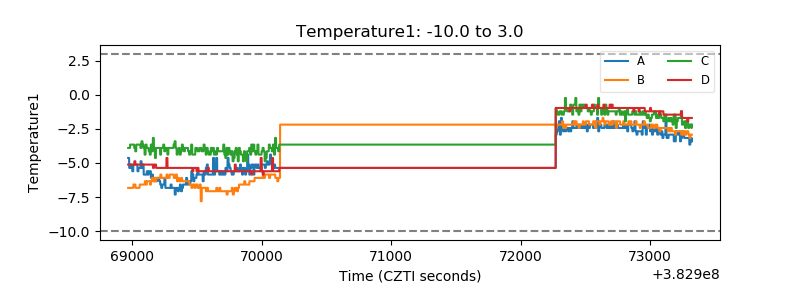 |
| Veto HV Monitor | 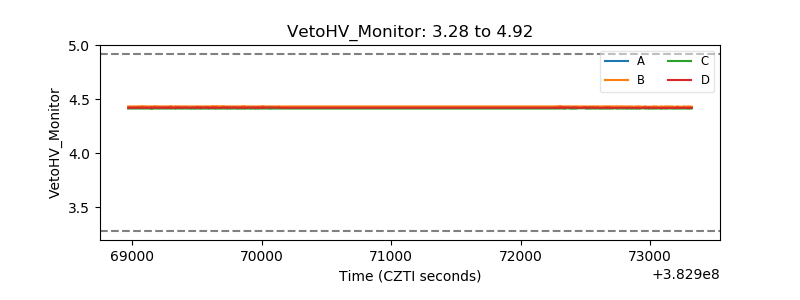 |
| Veto LLD | 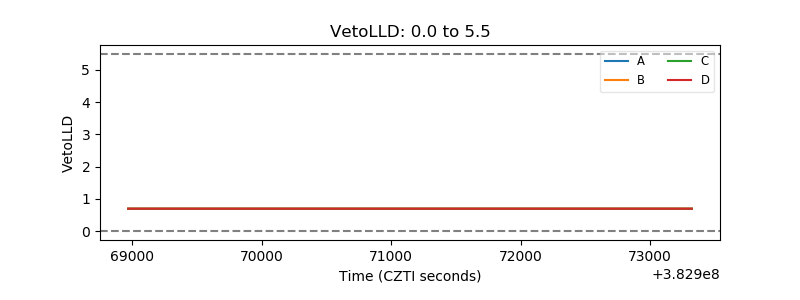 |
| Alpha Counter | 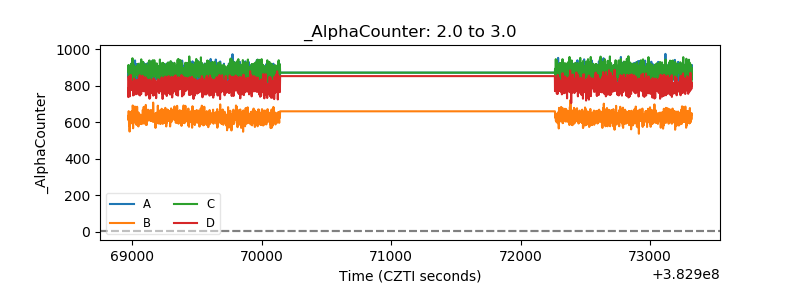 |
| _CPM_Rate | 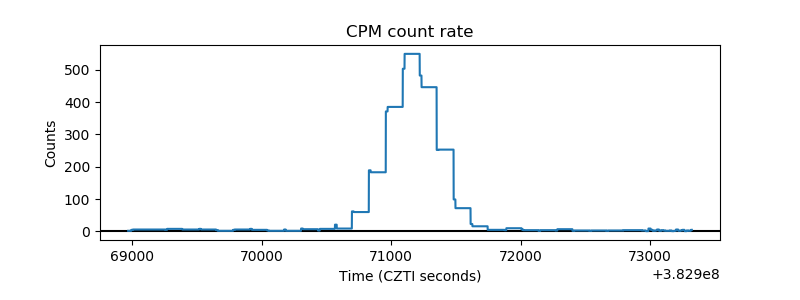 |
| CZT Counter | 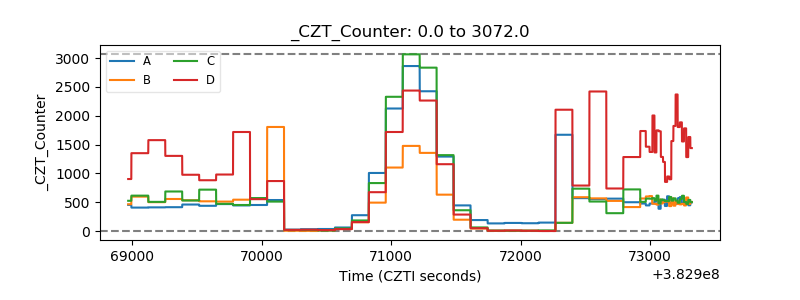 |
| +2.5 Volts monitor | 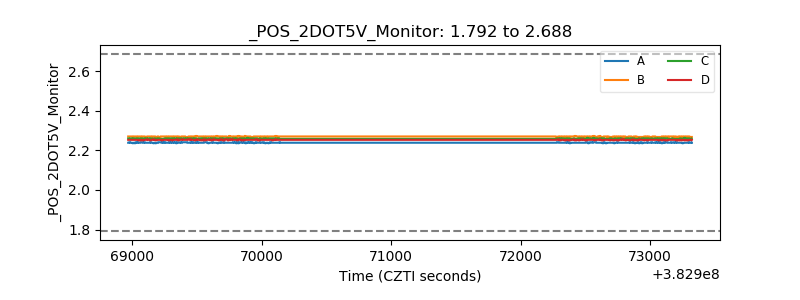 |
| +5 Volts monitor | 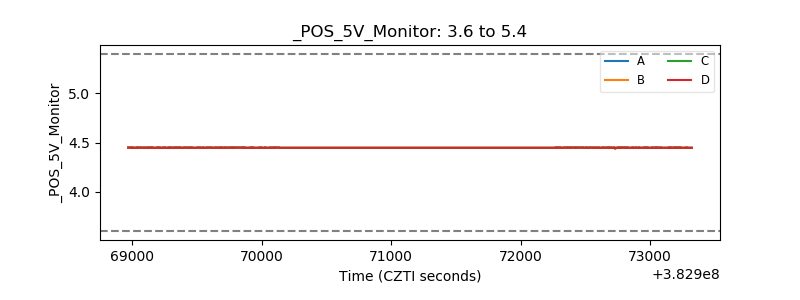 |
| _ROLL_ROT | 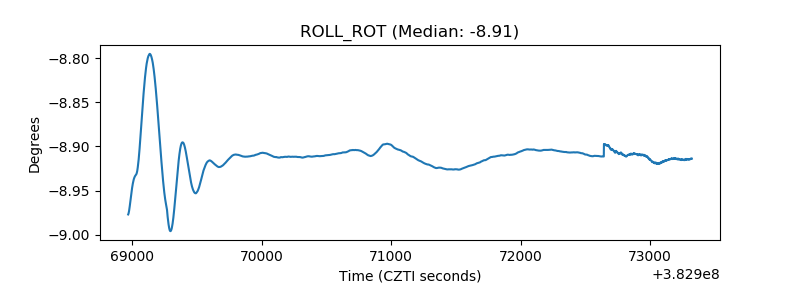 |
| _Roll_DEC | 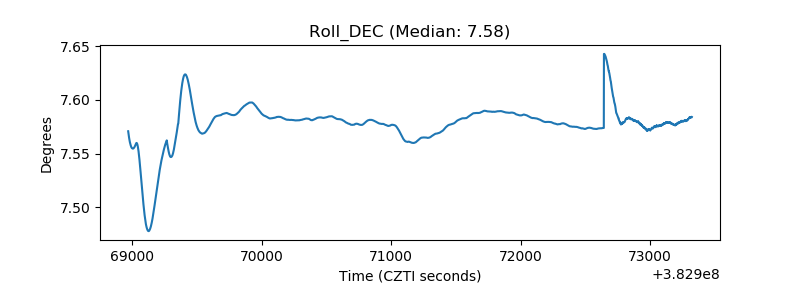 |
| _Roll_RA | 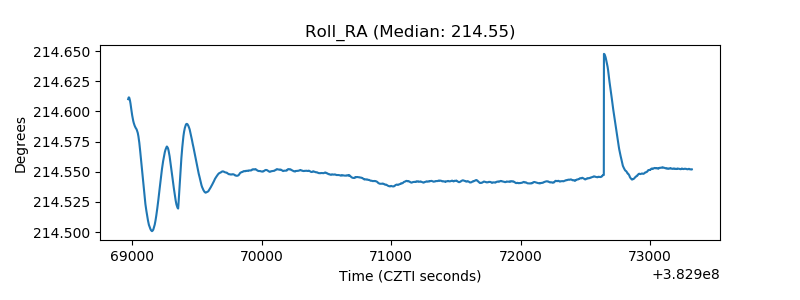 |
| Veto Counter | 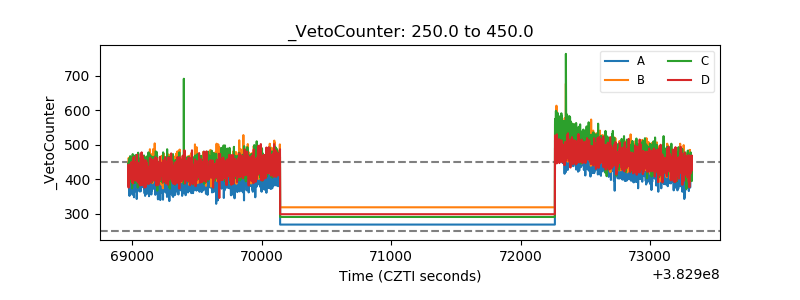 |