| Param | Original file | Final file |
|---|---|---|
| Filename | modeM0/AS1A05_176T03_9000004942_34583cztM0_level2.evt | modeM0/AS1A05_176T03_9000004942_34583cztM0_level2_quad_clean.evt |
| Size (bytes) | 271,486,080 | 18,210,240 |
| Size | 258.9 MB | 17.4 MB |
| Events in quadrant A | 1,250,485 | 99,168 |
| Events in quadrant B | 1,540,590 | 98,308 |
| Events in quadrant C | 1,616,881 | 87,279 |
| Events in quadrant D | 3,648,003 | 91,216 |
| Mode SS | |||
|---|---|---|---|
| Quadrant | BADHDUFLAG | Total packets | Discarded packets |
| A | 0 | 48 | 0 |
| B | 0 | 48 | 0 |
| C | 0 | 48 | 0 |
| D | 0 | 48 | 0 |
| Mode M9 | |||
|---|---|---|---|
| Quadrant | BADHDUFLAG | Total packets | Discarded packets |
| A | 0 | 13 | 0 |
| B | 0 | 13 | 0 |
| C | 0 | 13 | 0 |
| D | 0 | 14 | 0 |
| Mode M0 | |||
|---|---|---|---|
| Quadrant | BADHDUFLAG | Total packets | Discarded packets |
| A | 0 | 5126 | 1 |
| B | 0 | 6124 | 1 |
| C | 0 | 6161 | 1 |
| D | 0 | 12542 | 1 |
| Quadrant | Total seconds | Saturated seconds | Saturation percentage |
|---|---|---|---|
| A | 2429 | 2 | 0.082338% |
| B | 2429 | 31 | 1.276245% |
| C | 2429 | 131 | 5.393166% |
| D | 2429 | 560 | 23.054755% |
Noise dominated data is calculated using 1-second bins in cleaned event files. If a bin has >2000 counts, and if more than 50% of those come from <1% of pixels, then it is considered to be noise-dominated and hence unusable.
| Quadrant | # 1 sec bins | Bins with >0 counts | Bins with >2000 counts | High rate bins dominated by noise | Noise dominated (total time) | Noise dominated (detector-on time) | Marked lightcurve |
|---|---|---|---|---|---|---|---|
| A | 2429 | 2429 | 0 | 0 | 0.00% | 0.00% | 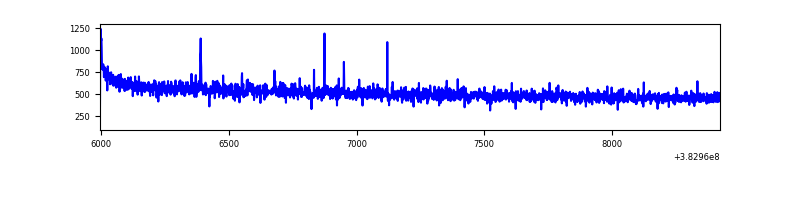 |
| B | 2429 | 2429 | 21 | 21 | 0.86% | 0.86% |  |
| C | 2429 | 2429 | 107 | 107 | 4.41% | 4.41% | 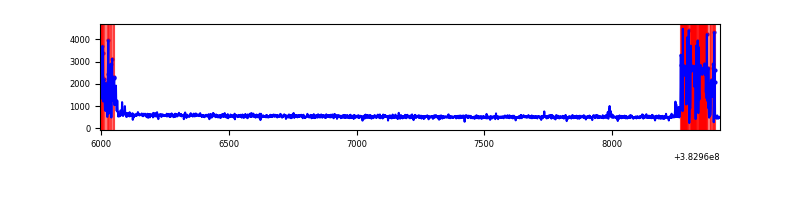 |
| D | 2429 | 2429 | 595 | 595 | 24.50% | 24.50% | 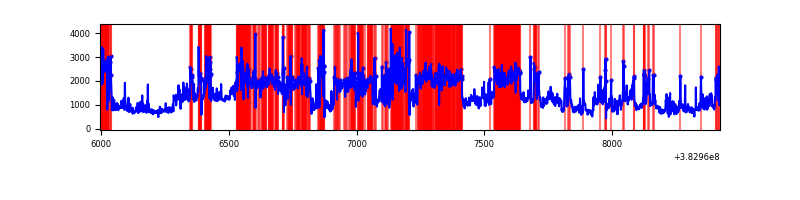 |
Top three noisy pixels from each quadrant. If the there are fewer than three noisy pixels in the level2.evt file, extra rows are filled as -1
| Pixel properties | Quadrant properties | ||||||
|---|---|---|---|---|---|---|---|
| Quadrant | DetID | PixID | Counts | Sigma | Mean | Median | Sigma |
| A | 10 | 83 | 21325 | 326.47 | 315 | 308 | 64.4 |
| A | 9 | 143 | 6401 | 94.65 | 315 | 308 | 64.4 |
| A | 13 | 254 | 4223 | 60.81 | 315 | 308 | 64.4 |
| B | 5 | 172 | 104609 | 1737.27 | 309 | 302 | 60.0 |
| B | 0 | 190 | 82258 | 1365.01 | 309 | 302 | 60.0 |
| B | 0 | 189 | 69984 | 1160.58 | 309 | 302 | 60.0 |
| C | 0 | 207 | 269619 | 3916.24 | 295 | 298 | 68.8 |
| C | 15 | 214 | 101276 | 1468.34 | 295 | 298 | 68.8 |
| C | 0 | 10 | 85555 | 1239.74 | 295 | 298 | 68.8 |
| D | 8 | 195 | 1673917 | 23340.02 | 285 | 277 | 71.7 |
| D | 1 | 52 | 225641 | 3142.84 | 285 | 277 | 71.7 |
| D | 5 | 223 | 139579 | 1942.65 | 285 | 277 | 71.7 |
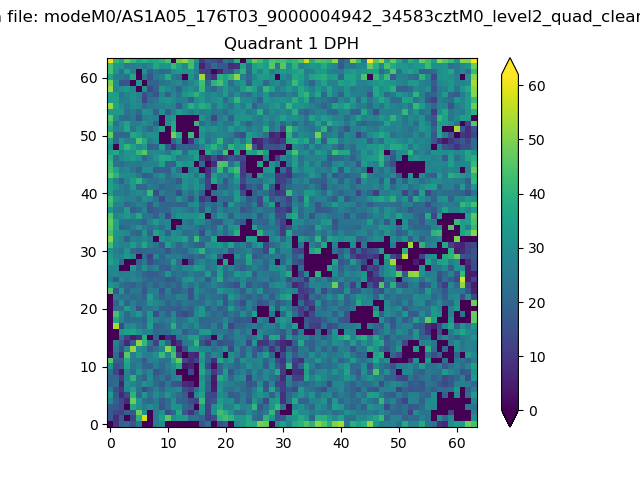
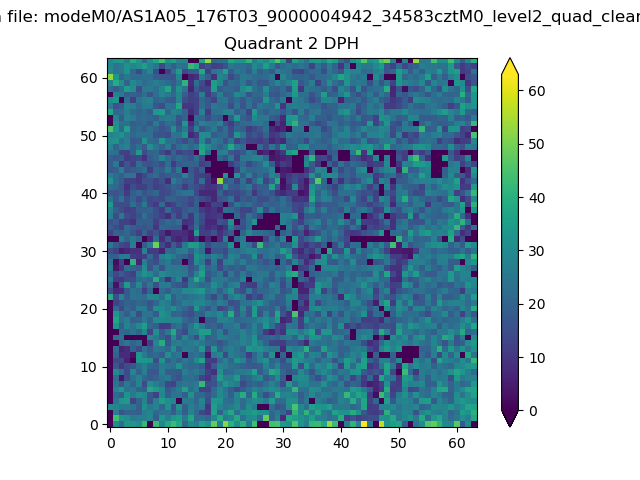
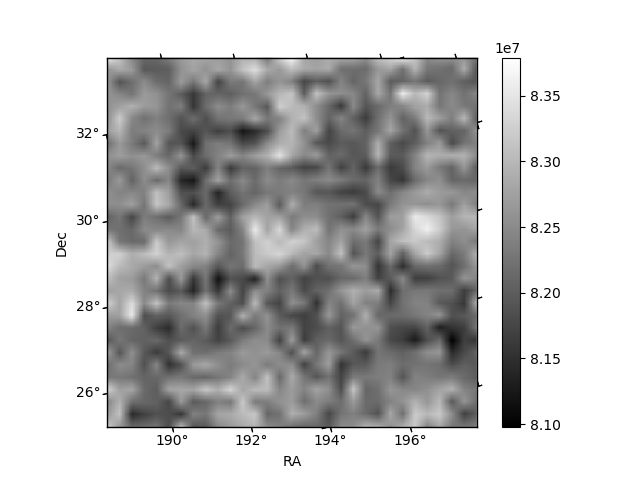
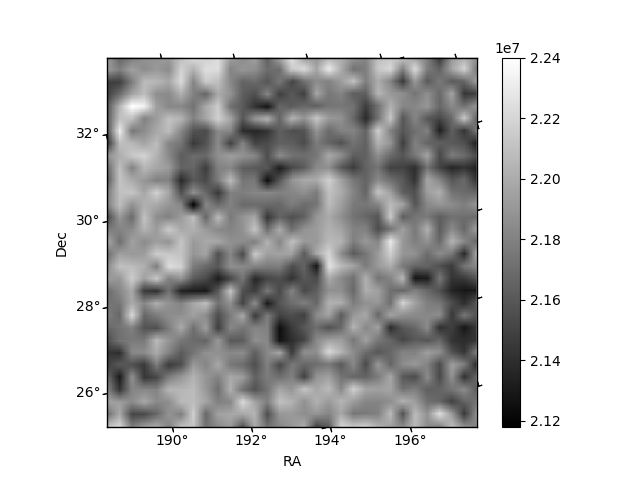
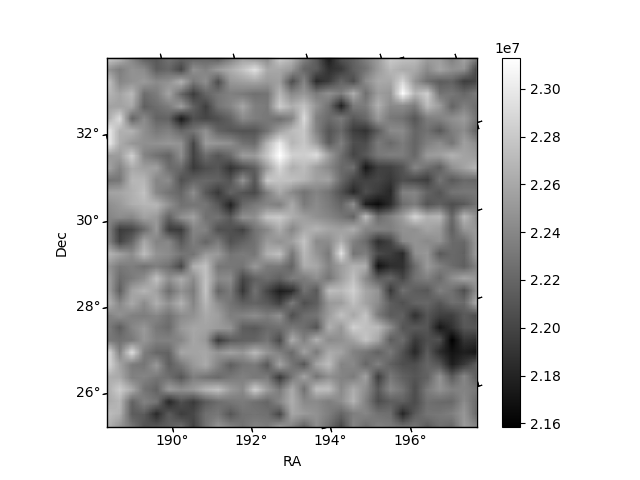
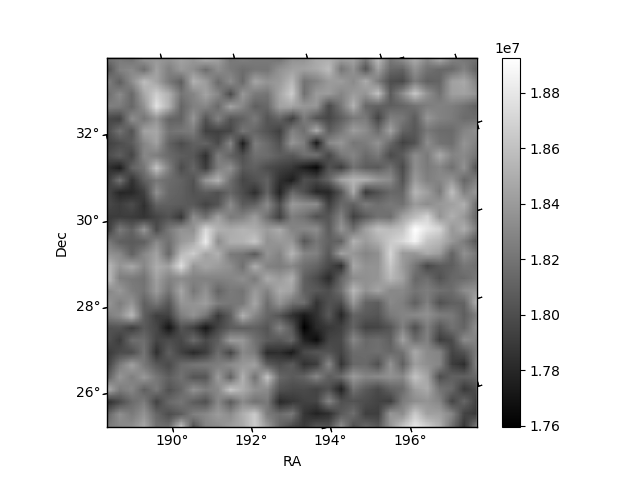
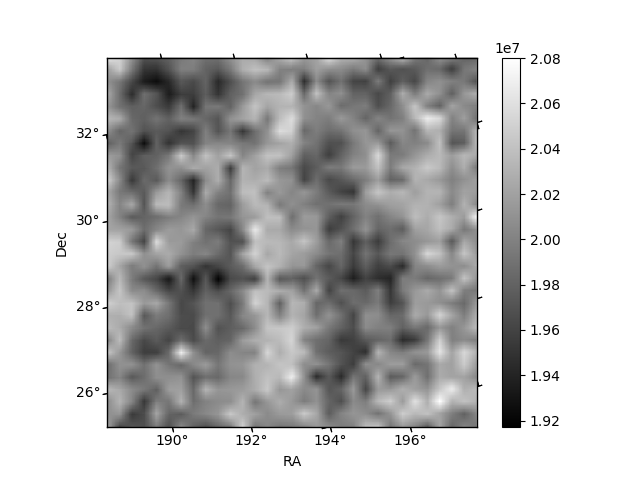
Histogram calculated using DETX and DETY for each event in the final _common_clean file
| Quadrant A | 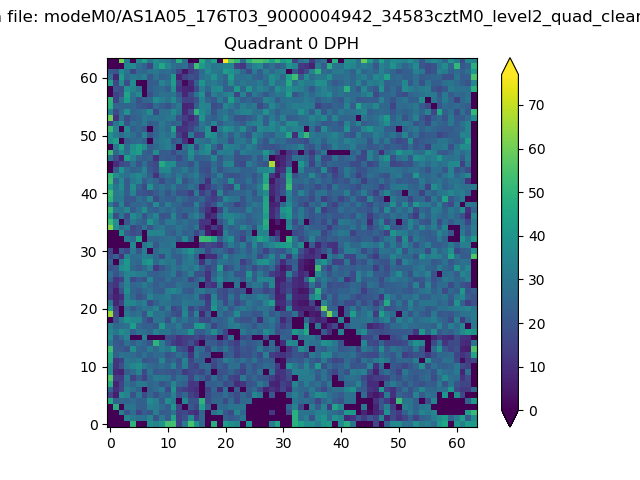 |
 |
Quadrant B |
|---|---|---|---|
| Quadrant D | 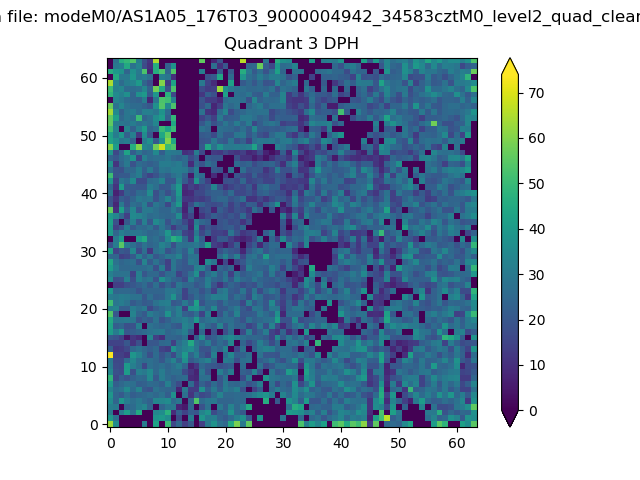 |
 |
Quadrant C |
| Plot type | Count rate plots | Images |
|---|---|---|
| Comparison with Poisson distribution Blue bars denote a histogram of data divided into 1 sec bins. Red curve is a Poisson curve with rate = median count rate of data. |
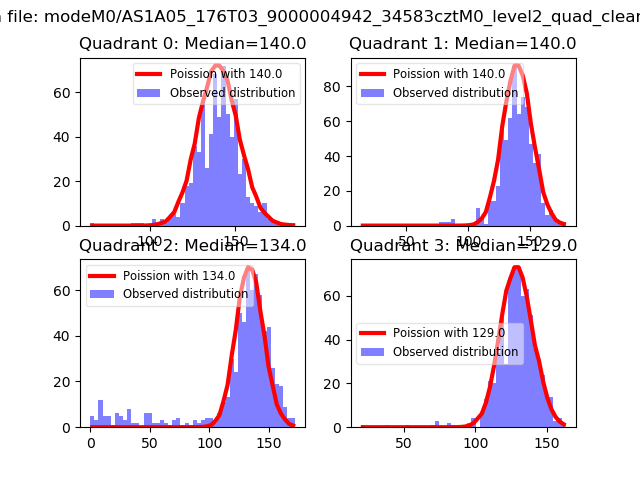 |
 |
| Quadrant-wise count rates Data is divided into 100 sec bins |
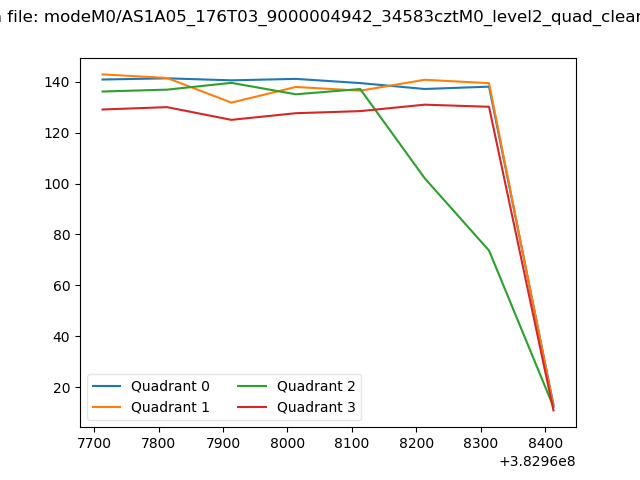 |
|
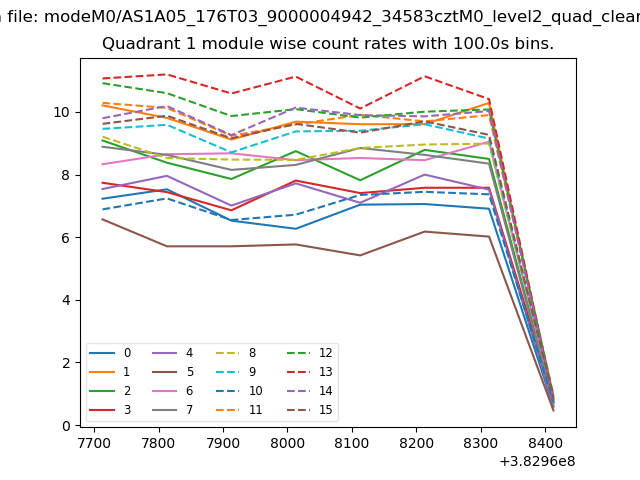
| Module-wise count rates for Quadrant A Data is divided into 100 sec bins |
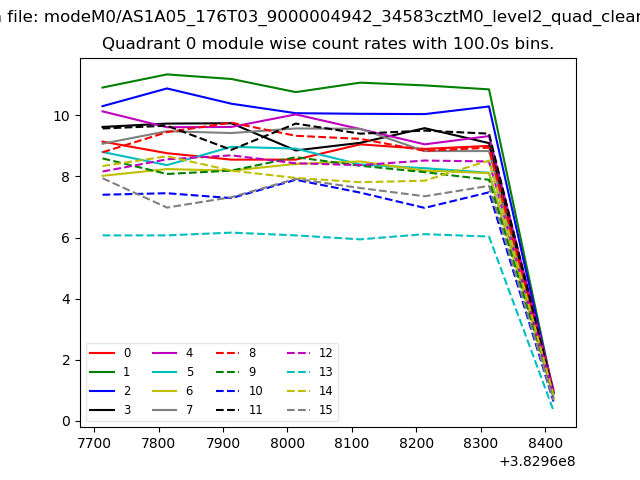 |
 |
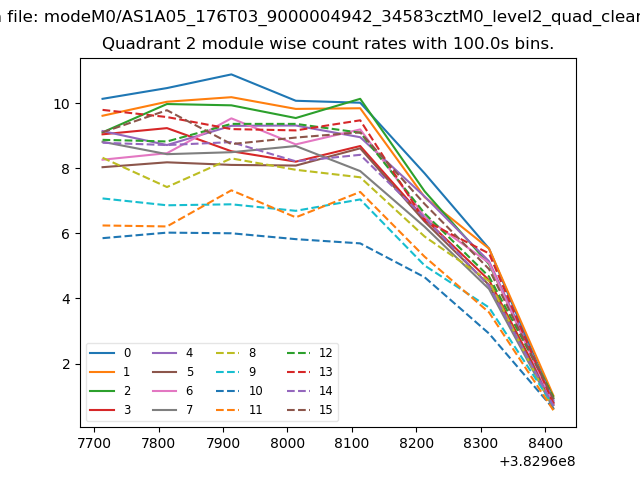
| Module-wise count rates for Quadrant B Data is divided into 100 sec bins |
 |
 |
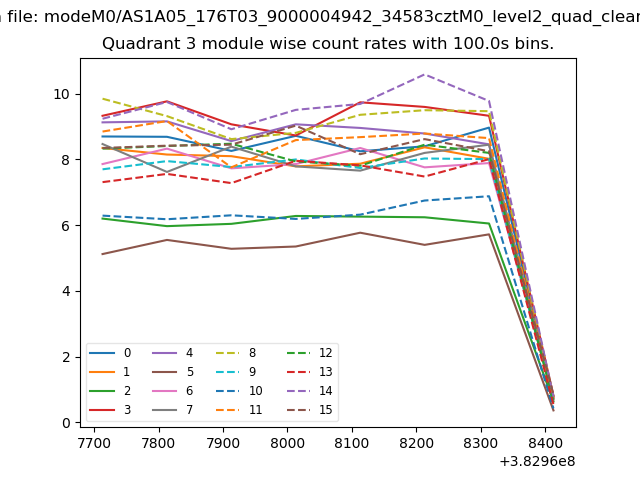
| Module-wise count rates for Quadrant C Data is divided into 100 sec bins |
 |
 |
| Module-wise count rates for Quadrant D Data is divided into 100 sec bins |
 |
 |
| Parameter | Plot |
|---|---|
| CZT HV Monitor | 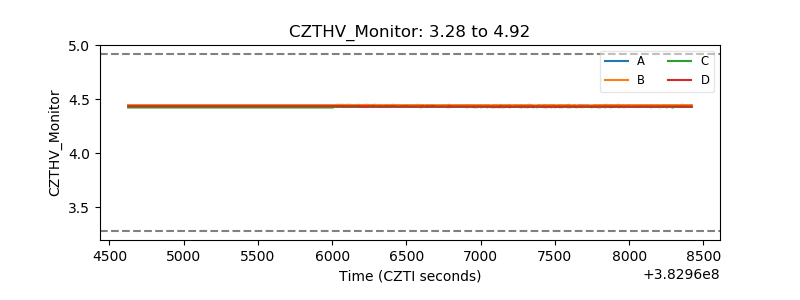 |
| D_VDD | 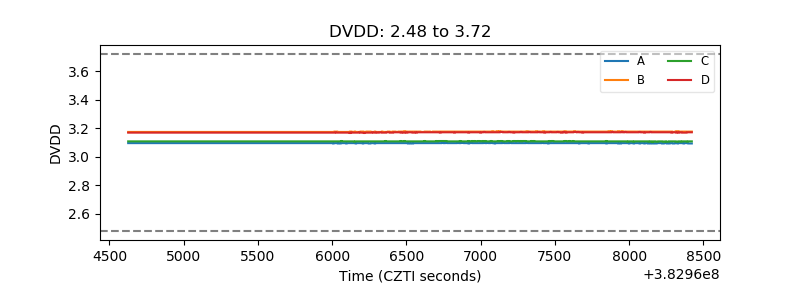 |
| Temperature 1 | 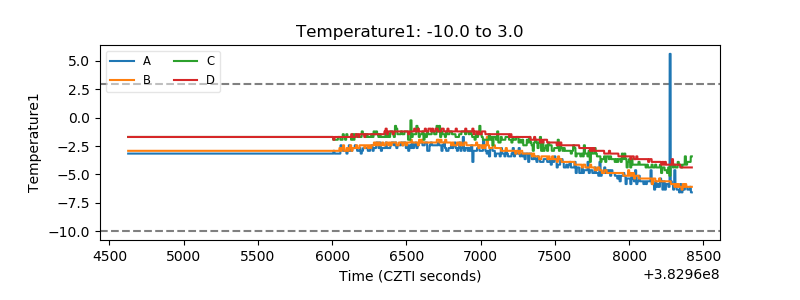 |
| Veto HV Monitor | 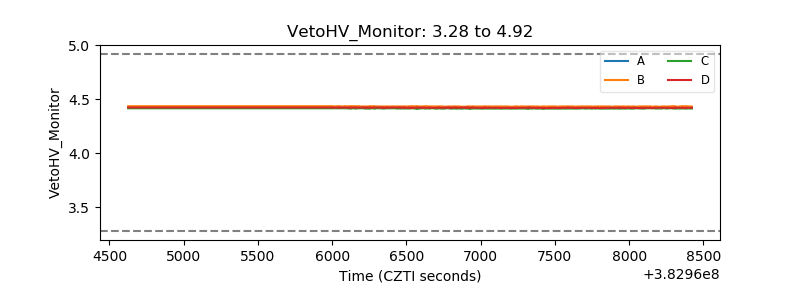 |
| Veto LLD | 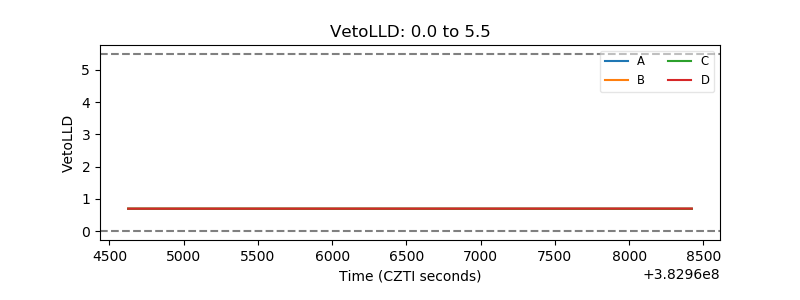 |
| Alpha Counter | 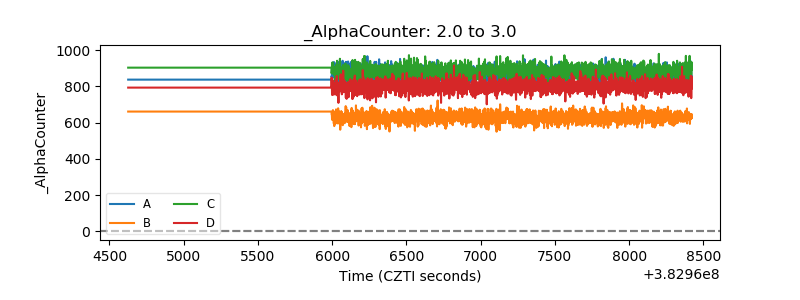 |
| _CPM_Rate | 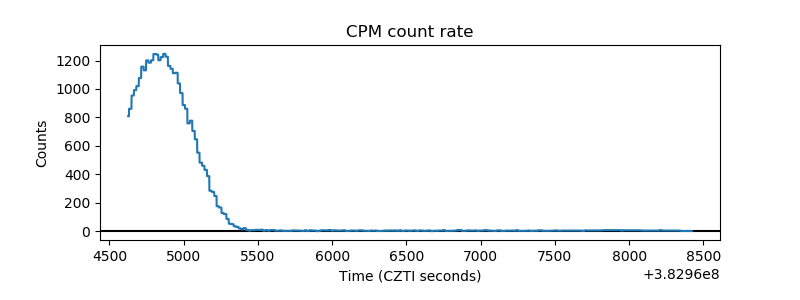 |
| CZT Counter | 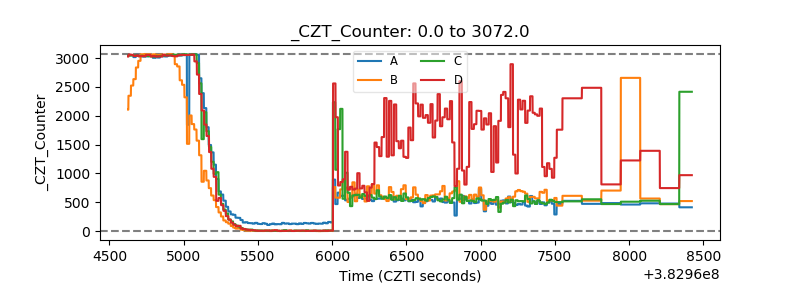 |
| +2.5 Volts monitor | 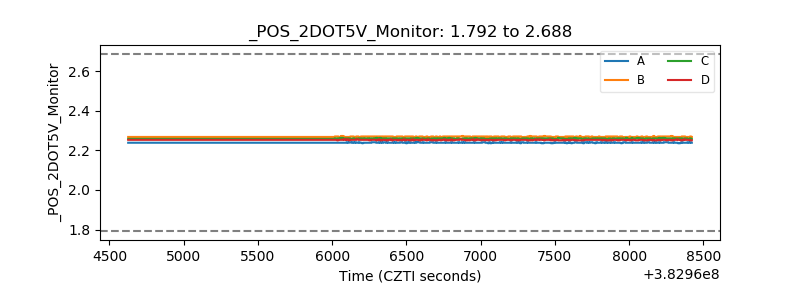 |
| +5 Volts monitor | 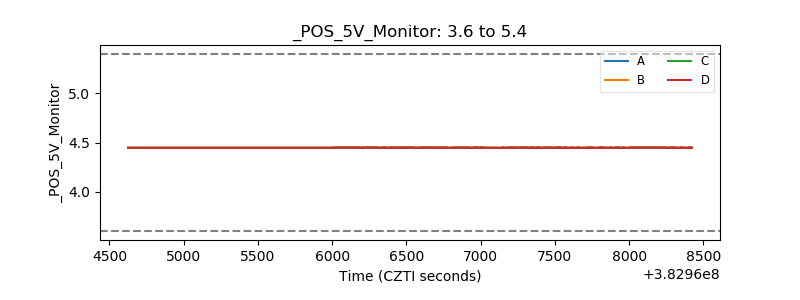 |
| _ROLL_ROT | 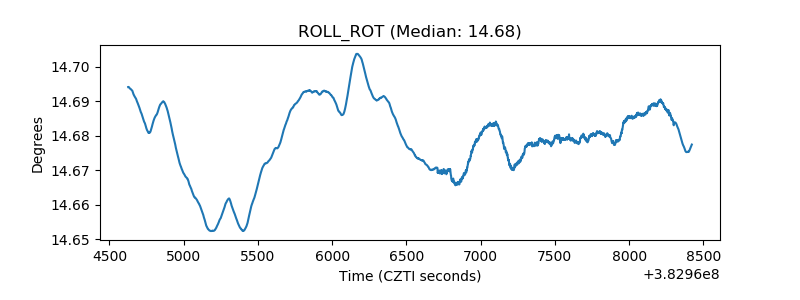 |
| _Roll_DEC |  |
| _Roll_RA | 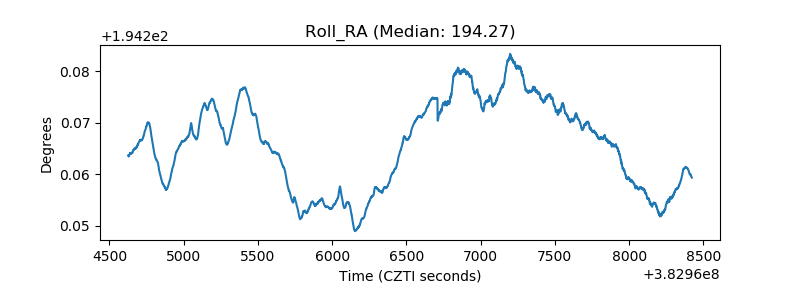 |
| Veto Counter | 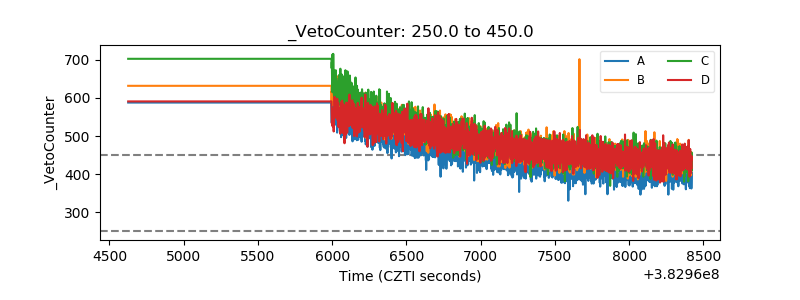 |