| Param | Original file | Final file |
|---|---|---|
| Filename | modeM0/AS1A05_176T03_9000004942_34582cztM0_level2.evt | modeM0/AS1A05_176T03_9000004942_34582cztM0_level2_quad_clean.evt |
| Size (bytes) | 568,321,920 | 48,332,160 |
| Size | 542.0 MB | 46.1 MB |
| Events in quadrant A | 2,711,408 | 286,968 |
| Events in quadrant B | 3,759,416 | 276,554 |
| Events in quadrant C | 2,957,783 | 282,829 |
| Events in quadrant D | 7,430,053 | 250,705 |
| Mode SS | |||
|---|---|---|---|
| Quadrant | BADHDUFLAG | Total packets | Discarded packets |
| A | 0 | 108 | 0 |
| B | 0 | 108 | 0 |
| C | 0 | 108 | 0 |
| D | 0 | 108 | 0 |
| Mode M9 | |||
|---|---|---|---|
| Quadrant | BADHDUFLAG | Total packets | Discarded packets |
| A | 0 | 24 | 0 |
| B | 0 | 24 | 0 |
| C | 0 | 24 | 0 |
| D | 0 | 25 | 0 |
| Mode M0 | |||
|---|---|---|---|
| Quadrant | BADHDUFLAG | Total packets | Discarded packets |
| A | 0 | 11069 | 3 |
| B | 0 | 14640 | 2 |
| C | 0 | 11600 | 2 |
| D | 0 | 25777 | 2 |
| Quadrant | Total seconds | Saturated seconds | Saturation percentage |
|---|---|---|---|
| A | 5218 | 6 | 0.114987% |
| B | 5218 | 200 | 3.832886% |
| C | 5218 | 42 | 0.804906% |
| D | 5218 | 995 | 19.068609% |
Noise dominated data is calculated using 1-second bins in cleaned event files. If a bin has >2000 counts, and if more than 50% of those come from <1% of pixels, then it is considered to be noise-dominated and hence unusable.
| Quadrant | # 1 sec bins | Bins with >0 counts | Bins with >2000 counts | High rate bins dominated by noise | Noise dominated (total time) | Noise dominated (detector-on time) | Marked lightcurve |
|---|---|---|---|---|---|---|---|
| A | 7341 | 5219 | 0 | 0 | 0.00% | 0.00% | 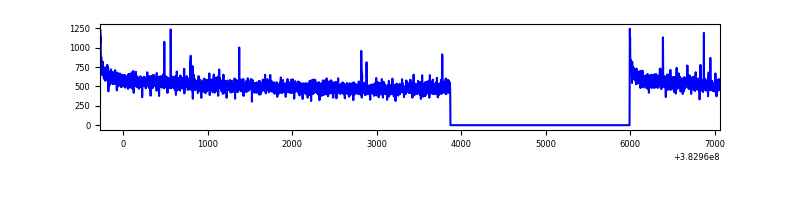 |
| B | 7341 | 5219 | 154 | 154 | 2.10% | 2.95% | 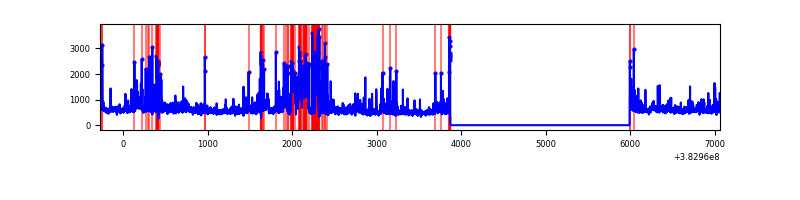 |
| C | 7341 | 5219 | 29 | 29 | 0.40% | 0.56% | 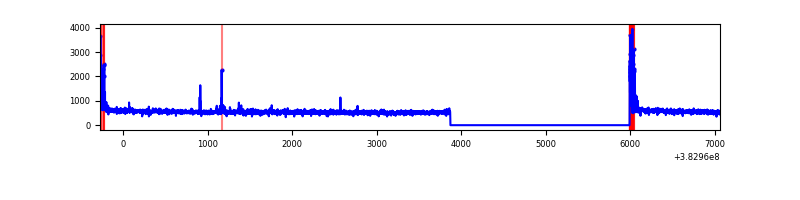 |
| D | 7341 | 5219 | 913 | 913 | 12.44% | 17.49% | 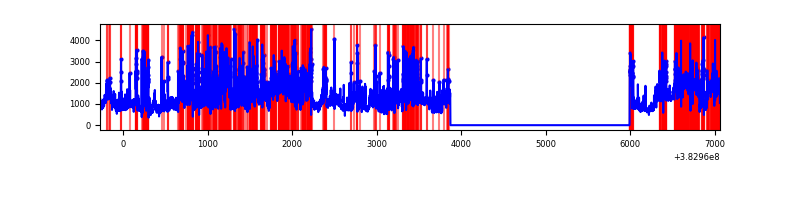 |
Top three noisy pixels from each quadrant. If the there are fewer than three noisy pixels in the level2.evt file, extra rows are filled as -1
| Pixel properties | Quadrant properties | ||||||
|---|---|---|---|---|---|---|---|
| Quadrant | DetID | PixID | Counts | Sigma | Mean | Median | Sigma |
| A | 10 | 83 | 42814 | 309.33 | 684 | 674 | 136.2 |
| A | 13 | 6 | 11872 | 82.2 | 684 | 674 | 136.2 |
| A | 9 | 143 | 11258 | 77.69 | 684 | 674 | 136.2 |
| B | 5 | 172 | 713593 | 5728.54 | 661 | 647 | 124.5 |
| B | 0 | 189 | 198645 | 1590.92 | 661 | 647 | 124.5 |
| B | 0 | 190 | 141745 | 1133.73 | 661 | 647 | 124.5 |
| C | 15 | 214 | 222433 | 1477.52 | 656 | 662 | 150.1 |
| C | 0 | 10 | 129621 | 859.17 | 656 | 662 | 150.1 |
| C | 14 | 67 | 30357 | 197.84 | 656 | 662 | 150.1 |
| D | 8 | 195 | 2194317 | 14540.51 | 620 | 604 | 150.9 |
| D | 1 | 47 | 1226702 | 8126.9 | 620 | 604 | 150.9 |
| D | 1 | 52 | 765830 | 5072.12 | 620 | 604 | 150.9 |
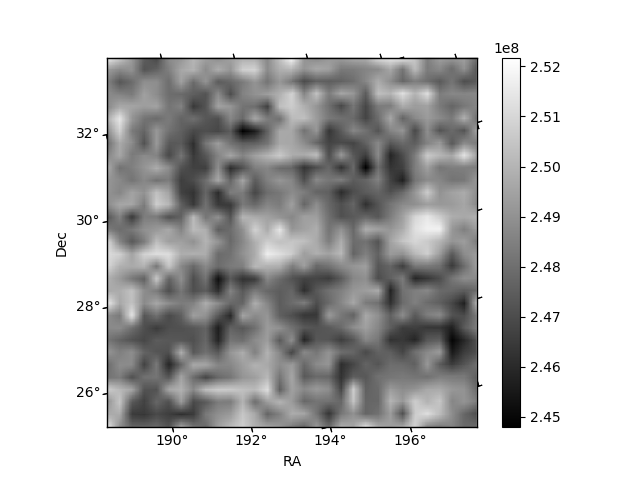
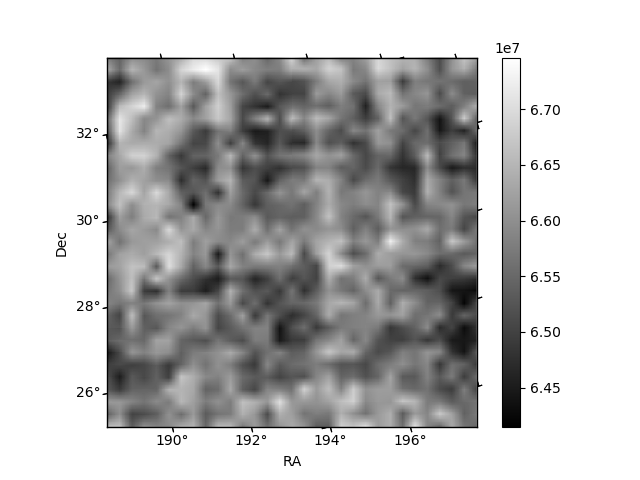
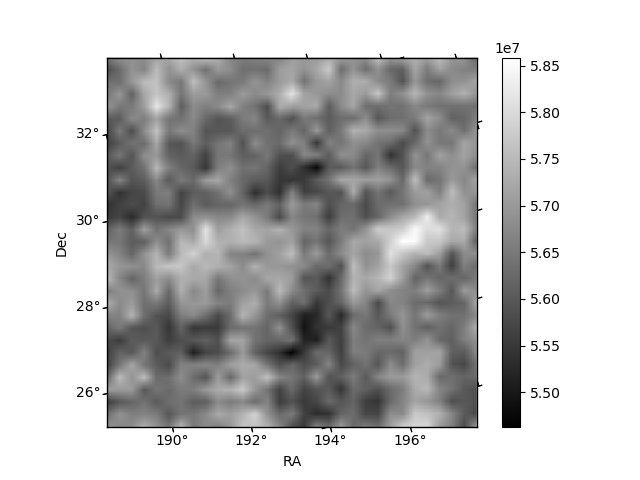
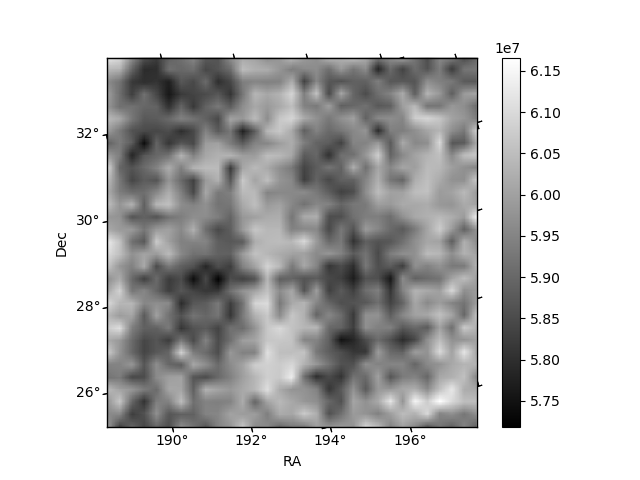
Histogram calculated using DETX and DETY for each event in the final _common_clean file
| Quadrant A | 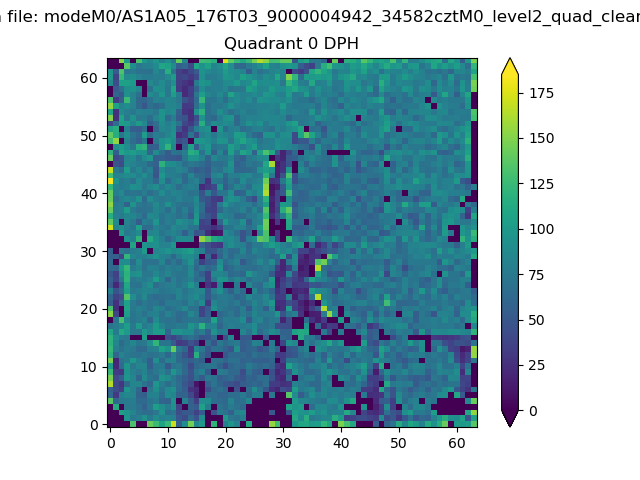 |
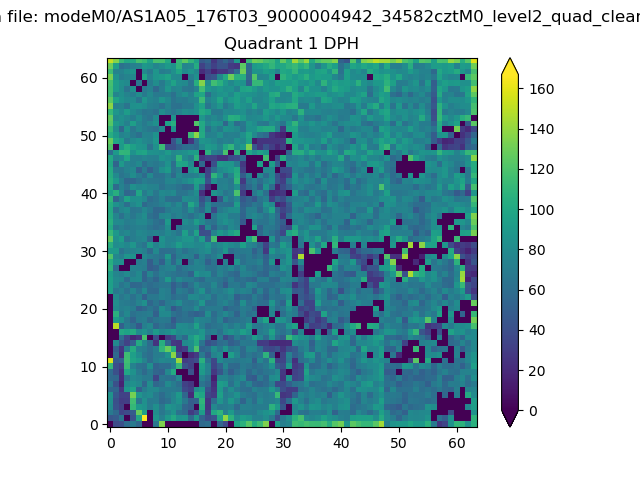 |
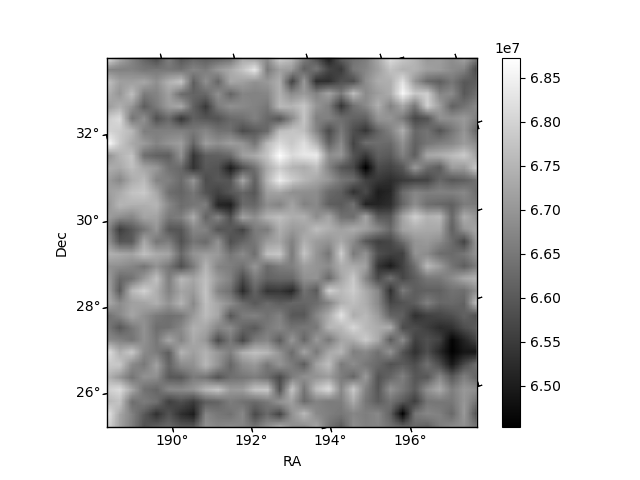
Quadrant B |
|---|---|---|---|
| Quadrant D | 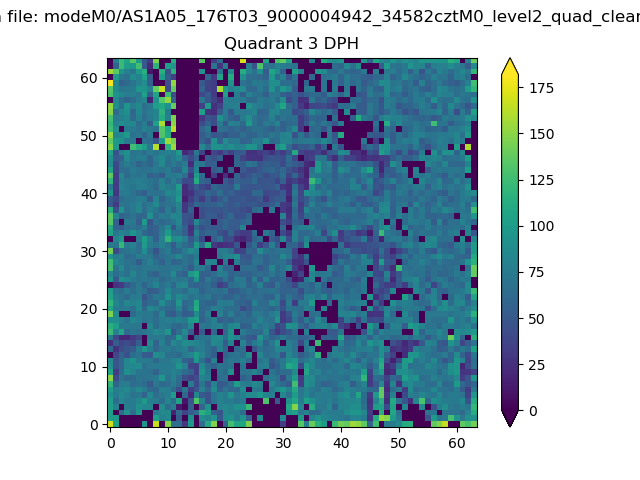 |
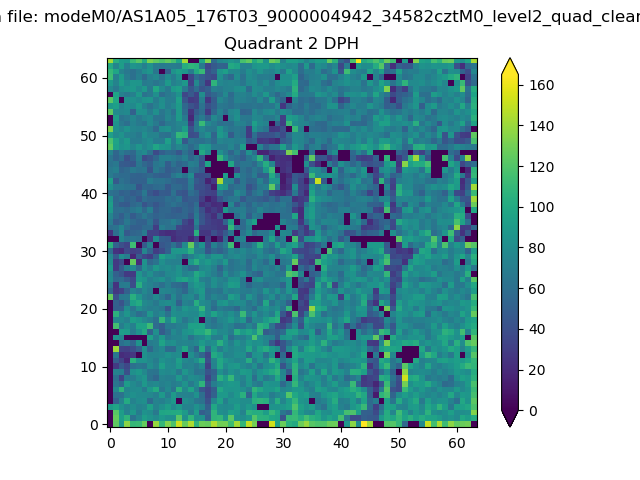 |
Quadrant C |
| Plot type | Count rate plots | Images |
|---|---|---|
| Comparison with Poisson distribution Blue bars denote a histogram of data divided into 1 sec bins. Red curve is a Poisson curve with rate = median count rate of data. |
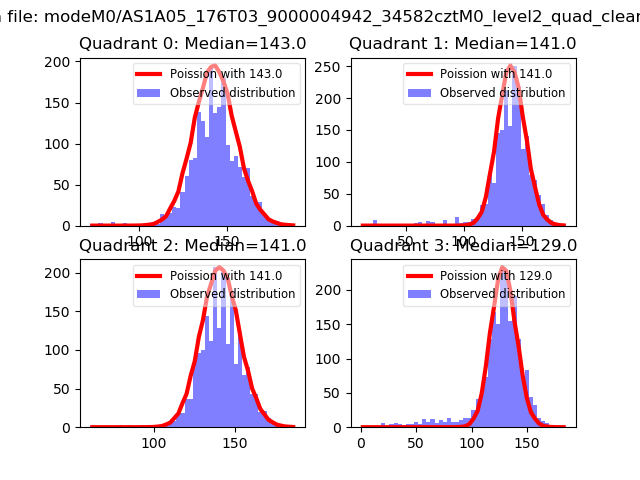 |
 |
| Quadrant-wise count rates Data is divided into 100 sec bins |
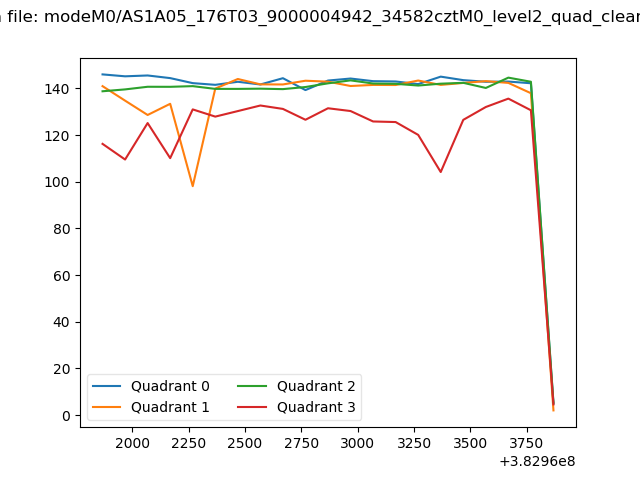 |
|
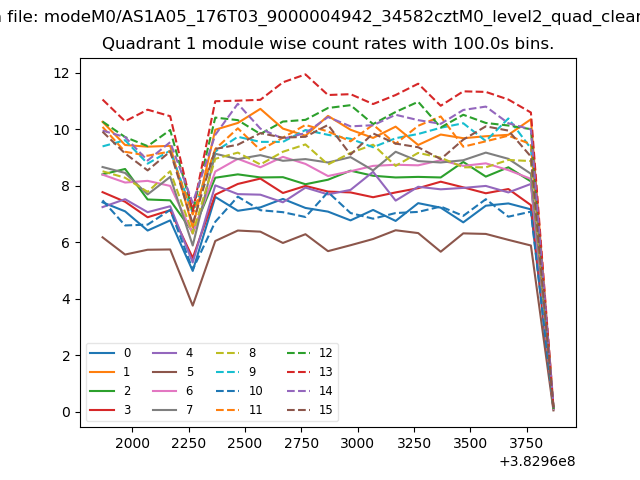
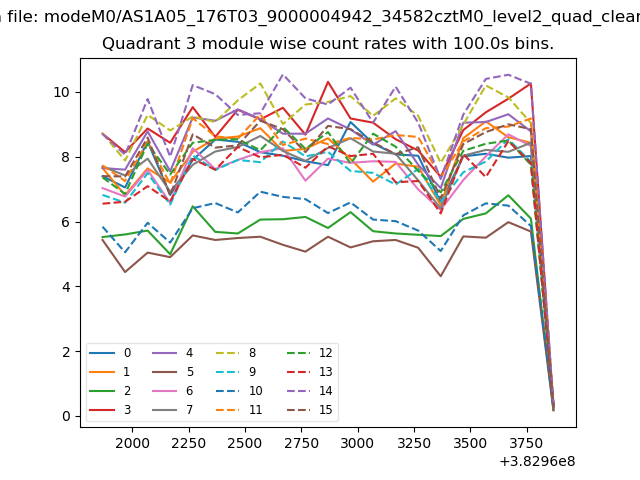
| Module-wise count rates for Quadrant A Data is divided into 100 sec bins |
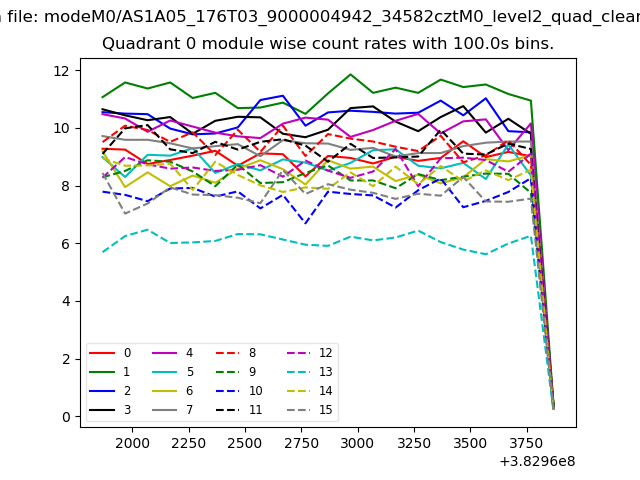 |
 |
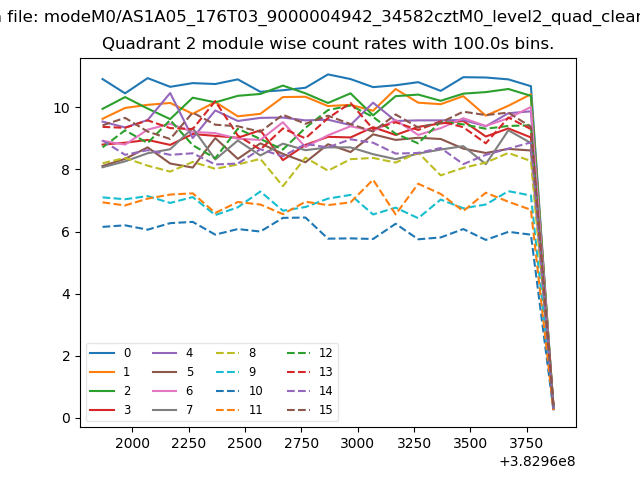
| Module-wise count rates for Quadrant B Data is divided into 100 sec bins |
 |
 |
| Module-wise count rates for Quadrant C Data is divided into 100 sec bins |
 |
 |
| Module-wise count rates for Quadrant D Data is divided into 100 sec bins |
 |
 |
| Parameter | Plot |
|---|---|
| CZT HV Monitor | 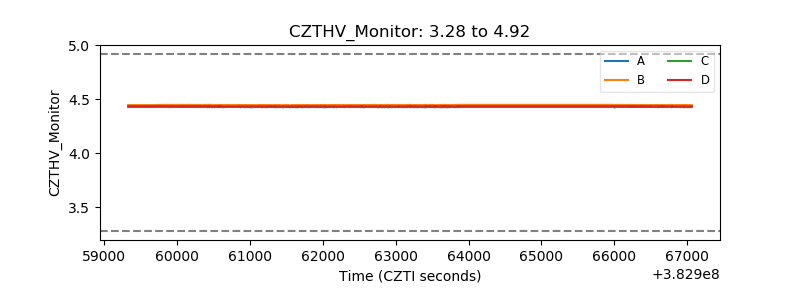 |
| D_VDD | 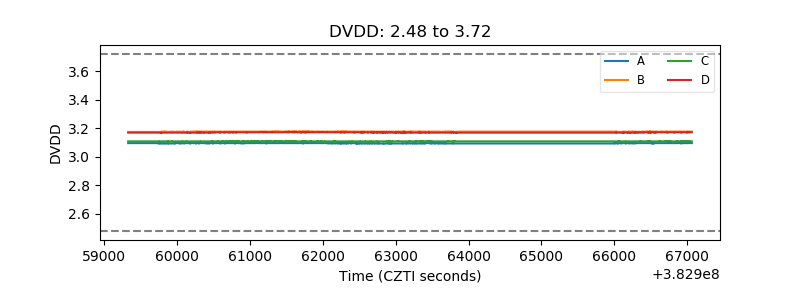 |
| Temperature 1 | 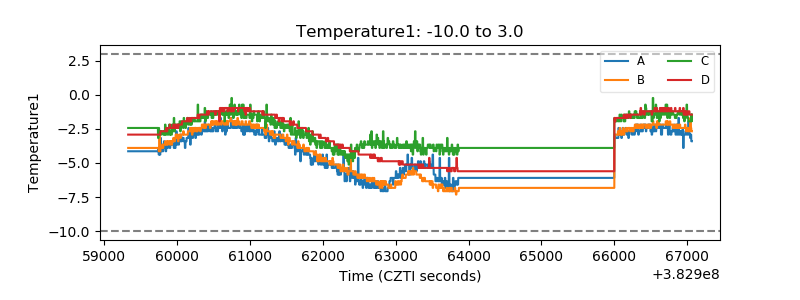 |
| Veto HV Monitor | 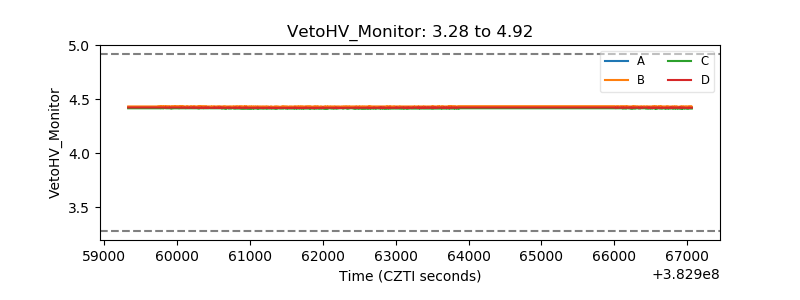 |
| Veto LLD | 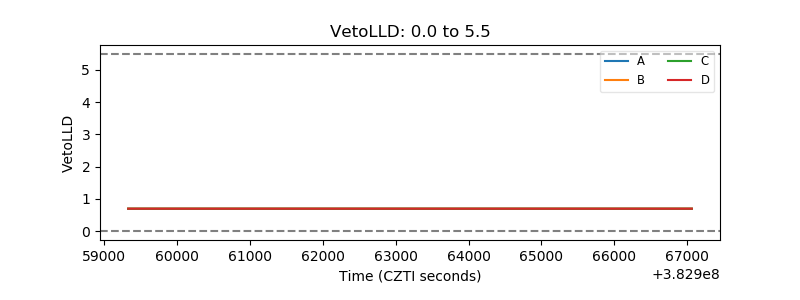 |
| Alpha Counter | 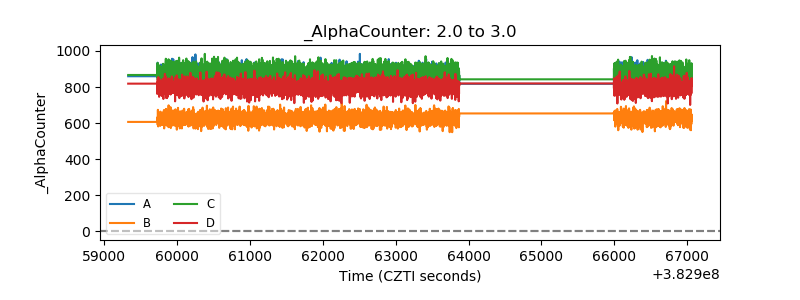 |
| _CPM_Rate | 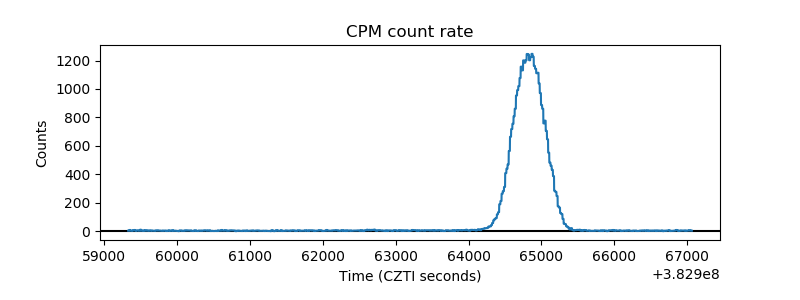 |
| CZT Counter | 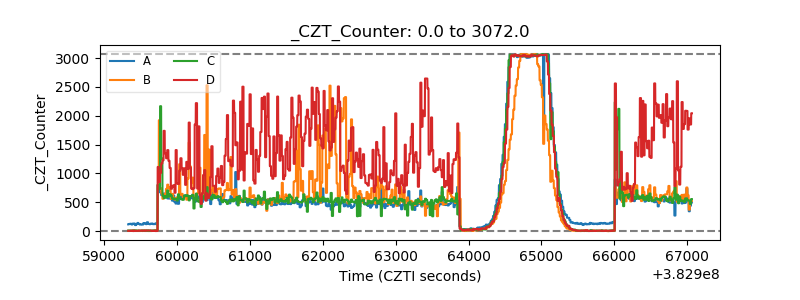 |
| +2.5 Volts monitor | 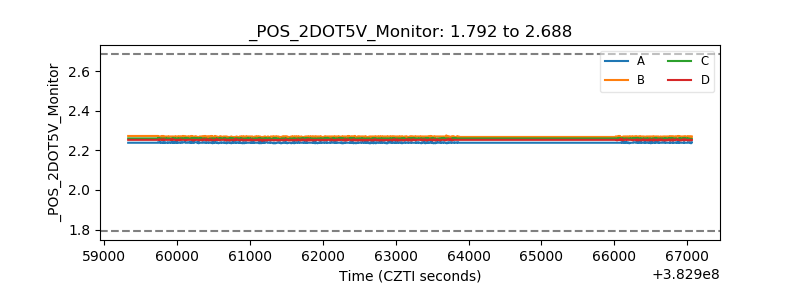 |
| +5 Volts monitor | 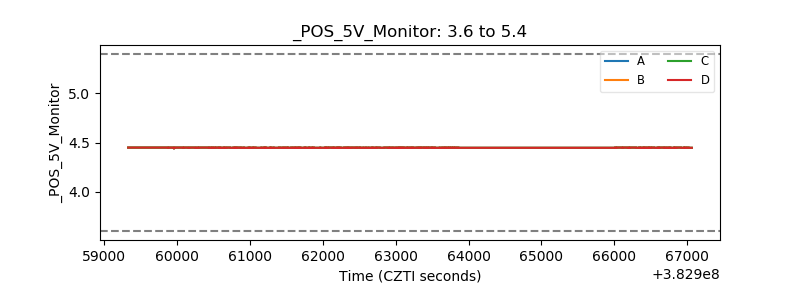 |
| _ROLL_ROT | 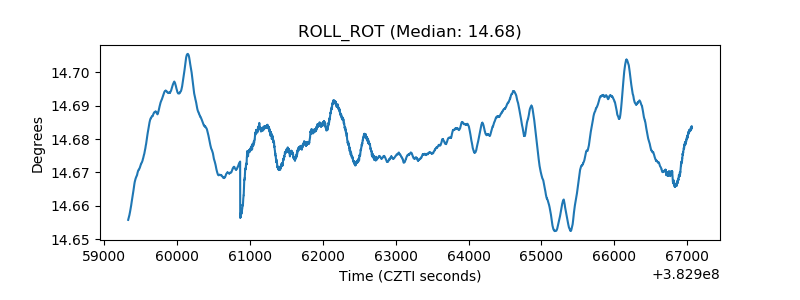 |
| _Roll_DEC | 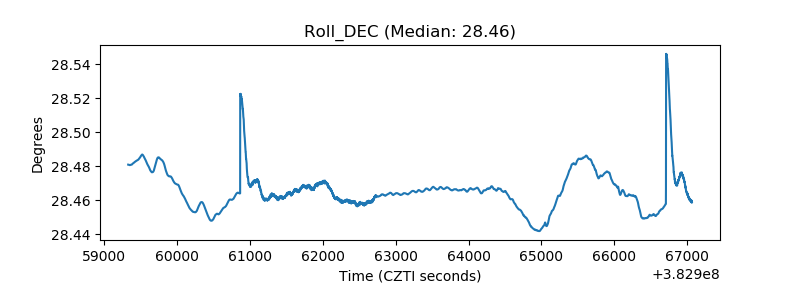 |
| _Roll_RA | 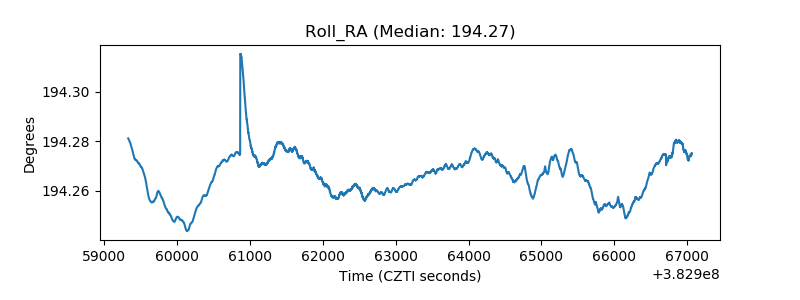 |
| Veto Counter | 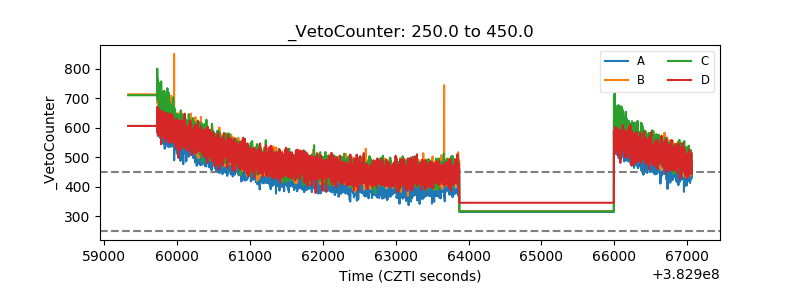 |