| Param | Original file | Final file |
|---|---|---|
| Filename | modeM0/AS1A05_176T03_9000004942cztM0_level2_bc.evt | modeM0/AS1A05_176T03_9000004942cztM0_level2_quad_clean.evt |
| Size (bytes) | 452,551,680 | 63,766,080 |
| Size | 431.6 MB | 60.8 MB |
| Events in quadrant A | 1,582,790 | 386,408 |
| Events in quadrant B | 2,533,987 | 374,295 |
| Events in quadrant C | 1,990,861 | 369,616 |
| Events in quadrant D | 7,144,498 | 341,405 |
| Mode SS | |||
|---|---|---|---|
| Quadrant | BADHDUFLAG | Total packets | Discarded packets |
| A | 0 | 134 | 0 |
| B | 0 | 134 | 0 |
| C | 0 | 134 | 0 |
| D | 0 | 134 | 0 |
| Mode M9 | |||
|---|---|---|---|
| Quadrant | BADHDUFLAG | Total packets | Discarded packets |
| A | 0 | 24 | 0 |
| B | 0 | 24 | 0 |
| C | 0 | 24 | 0 |
| D | 0 | 25 | 0 |
| Mode M0 | |||
|---|---|---|---|
| Quadrant | BADHDUFLAG | Total packets | Discarded packets |
| A | 0 | 13800 | 0 |
| B | 0 | 17946 | 0 |
| C | 0 | 15092 | 0 |
| D | 0 | 32560 | 0 |
| Quadrant | Total seconds | Saturated seconds | Saturation percentage |
|---|---|---|---|
| A | 6577 | 6 | 0.091227% |
| B | 6577 | 224 | 3.405808% |
| C | 6577 | 147 | 2.235062% |
| D | 6577 | 1273 | 19.355329% |
Noise dominated data is calculated using 1-second bins in cleaned event files. If a bin has >2000 counts, and if more than 50% of those come from <1% of pixels, then it is considered to be noise-dominated and hence unusable.
| Quadrant | # 1 sec bins | Bins with >0 counts | Bins with >2000 counts | High rate bins dominated by noise | Noise dominated (total time) | Noise dominated (detector-on time) | Marked lightcurve |
|---|---|---|---|---|---|---|---|
| A | 8699 | 6577 | 0 | 0 | 0.00% | 0.00% |  |
| B | 8699 | 6576 | 26 | 26 | 0.30% | 0.40% |  |
| C | 8699 | 6576 | 11 | 11 | 0.13% | 0.17% |  |
| D | 8699 | 6576 | 420 | 420 | 4.83% | 6.39% |  |
Top three noisy pixels from each quadrant. If the there are fewer than three noisy pixels in the level2.evt file, extra rows are filled as -1
| Pixel properties | Quadrant properties | ||||||
|---|---|---|---|---|---|---|---|
| Quadrant | DetID | PixID | Counts | Sigma | Mean | Median | Sigma |
| A | 10 | 83 | 43275 | 497.19 | 391 | 385 | 86.3 |
| A | 13 | 6 | 12279 | 137.88 | 391 | 385 | 86.3 |
| A | 13 | 254 | 11087 | 124.06 | 391 | 385 | 86.3 |
| B | 5 | 172 | 570706 | 7480.78 | 384 | 378 | 76.2 |
| B | 0 | 189 | 194935 | 2551.93 | 384 | 378 | 76.2 |
| B | 0 | 190 | 156124 | 2042.86 | 384 | 378 | 76.2 |
| C | 15 | 214 | 262719 | 3152.97 | 372 | 370 | 83.2 |
| C | 0 | 207 | 128392 | 1538.59 | 372 | 370 | 83.2 |
| C | 0 | 10 | 98864 | 1183.72 | 372 | 370 | 83.2 |
| D | 8 | 195 | 3009329 | 35378.52 | 355 | 344 | 85.1 |
| D | 1 | 47 | 1121534 | 13182.53 | 355 | 344 | 85.1 |
| D | 1 | 52 | 816177 | 9592.26 | 355 | 344 | 85.1 |
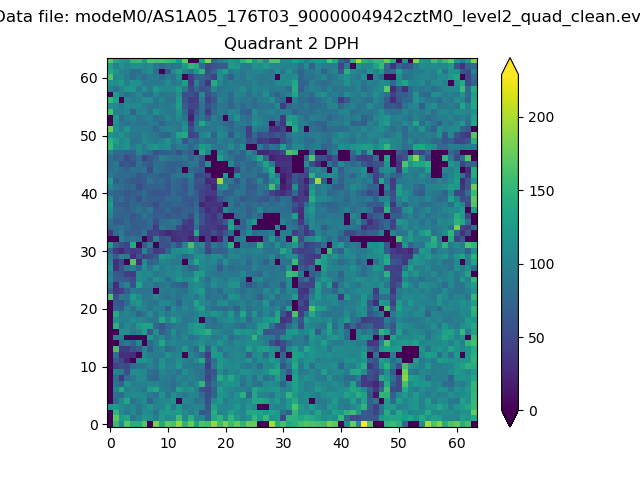
Histogram calculated using DETX and DETY for each event in the final _common_clean file
| Quadrant A | 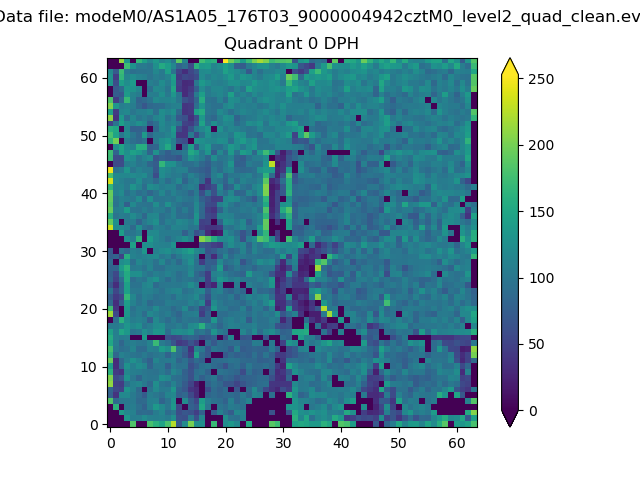 |
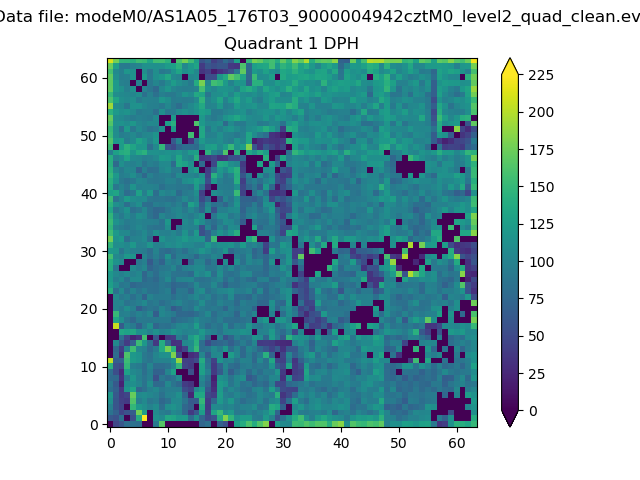 |
Quadrant B |
|---|---|---|---|
| Quadrant D | 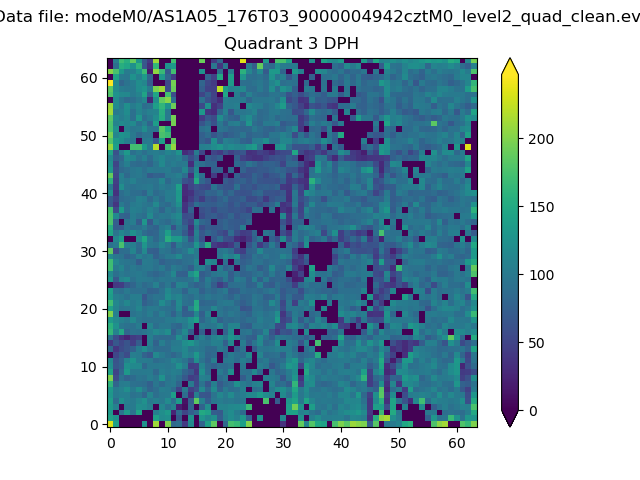 |
 |
Quadrant C |
| Plot type | Count rate plots | Images |
|---|---|---|
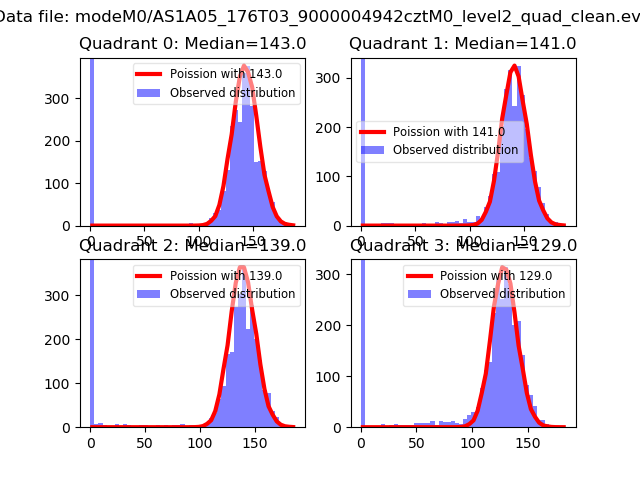
| Comparison with Poisson distribution Blue bars denote a histogram of data divided into 1 sec bins. Red curve is a Poisson curve with rate = median count rate of data. |
 |
 |
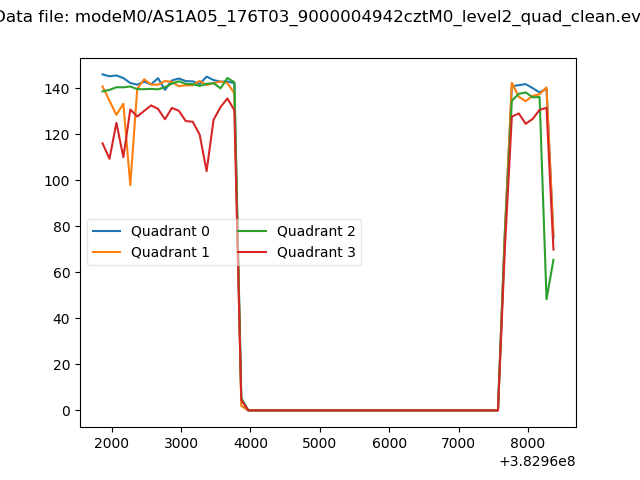
| Quadrant-wise count rates Data is divided into 100 sec bins |
 |
|
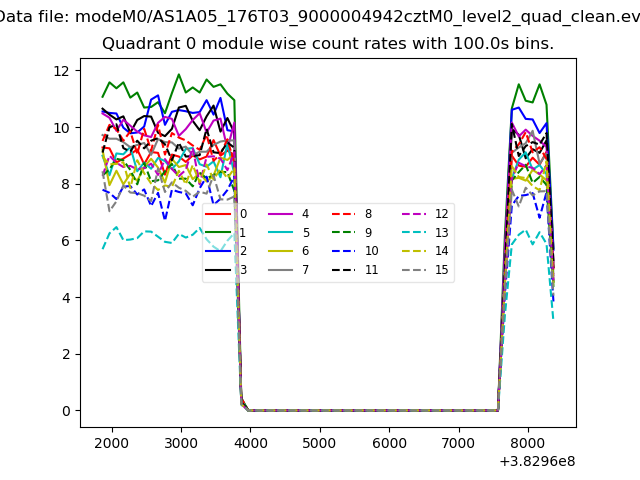
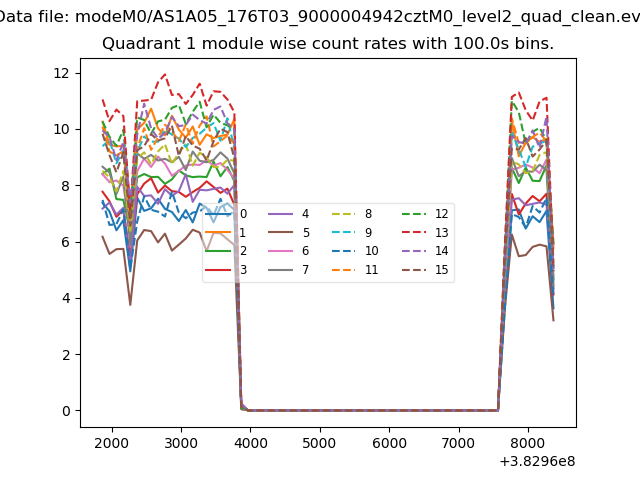
| Module-wise count rates for Quadrant A Data is divided into 100 sec bins |
 |
 |
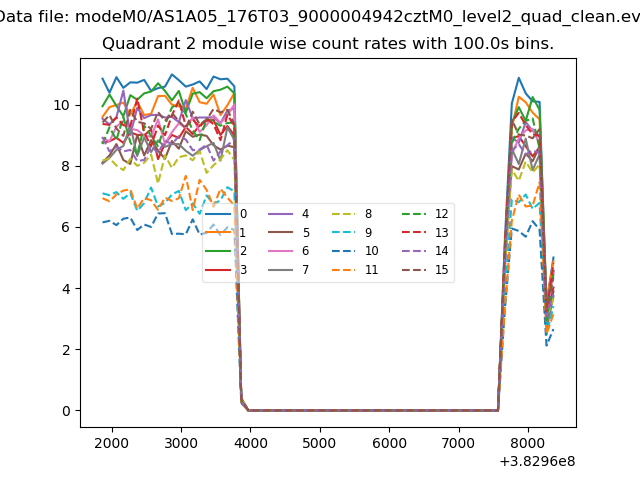
| Module-wise count rates for Quadrant B Data is divided into 100 sec bins |
 |
 |
| Module-wise count rates for Quadrant C Data is divided into 100 sec bins |
 |
 |
| Module-wise count rates for Quadrant D Data is divided into 100 sec bins |
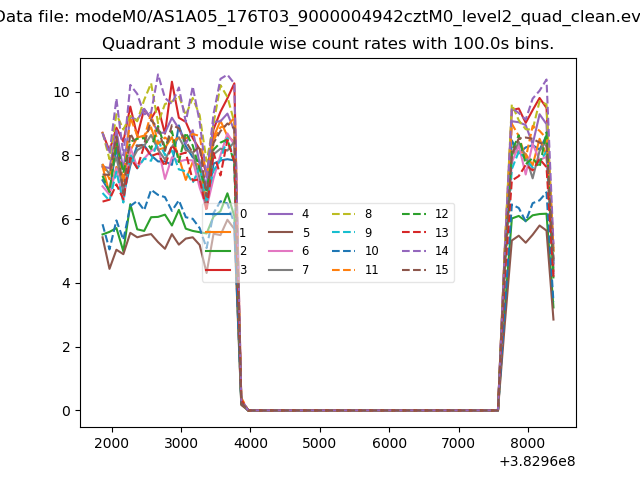 |
 |
| Parameter | Plot |
|---|---|
| CZT HV Monitor | 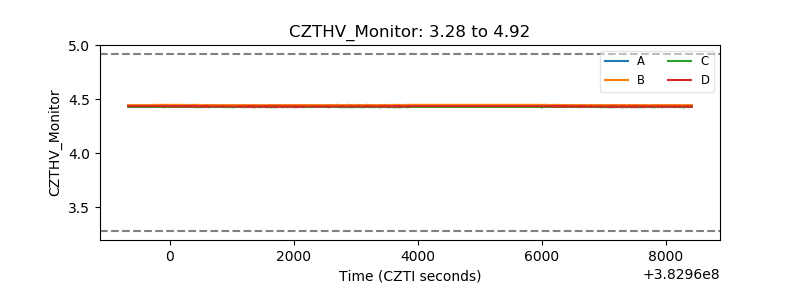 |
| D_VDD | 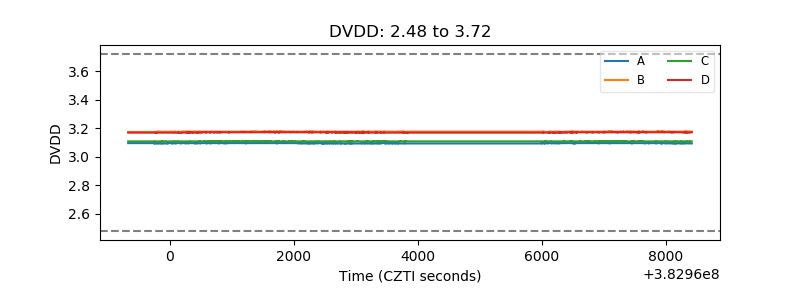 |
| Temperature 1 | 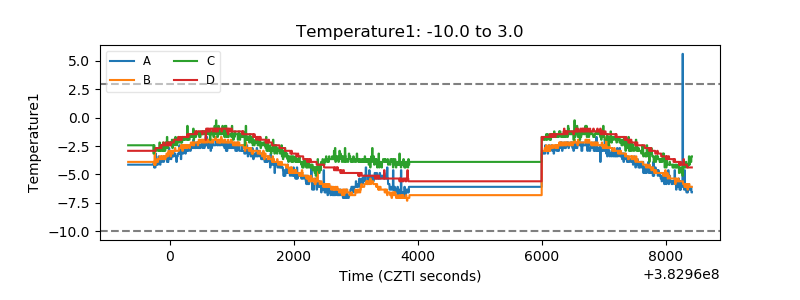 |
| Veto HV Monitor | 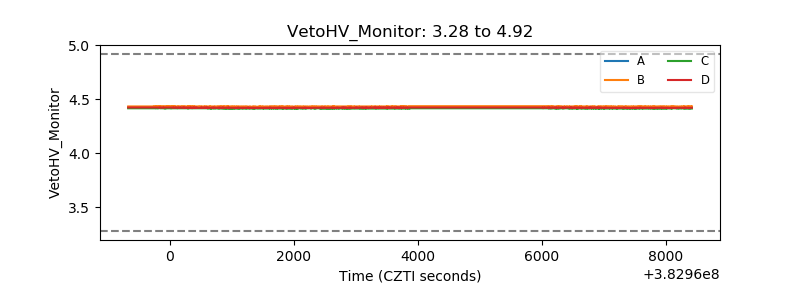 |
| Veto LLD | 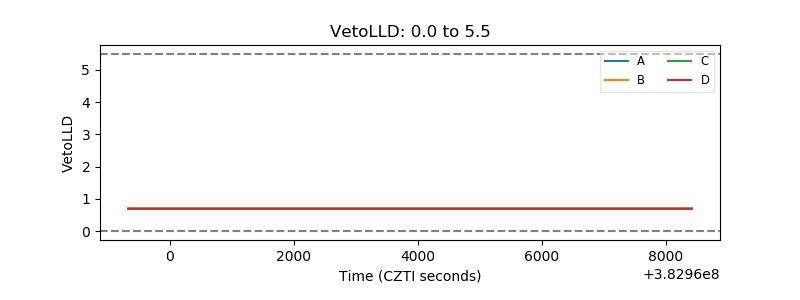 |
| Alpha Counter | 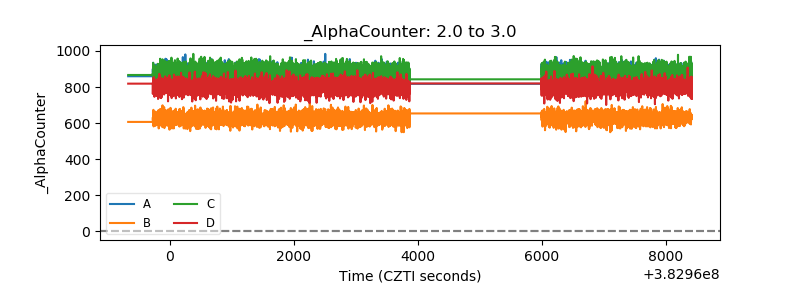 |
| _CPM_Rate | 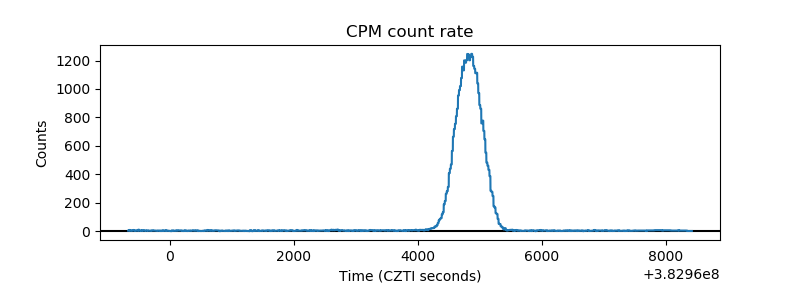 |
| CZT Counter | 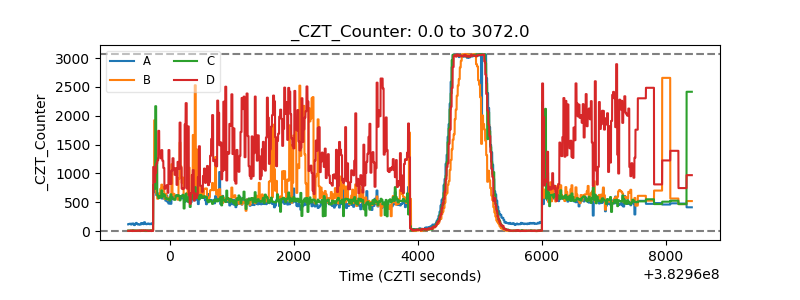 |
| +2.5 Volts monitor | 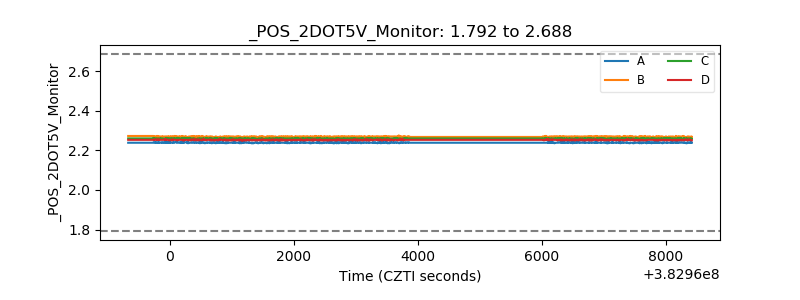 |
| +5 Volts monitor | 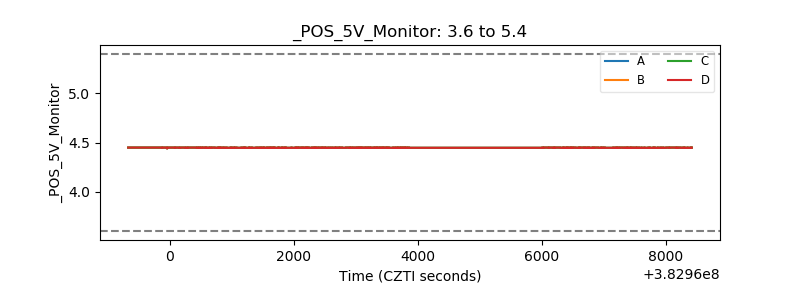 |
| _ROLL_ROT | 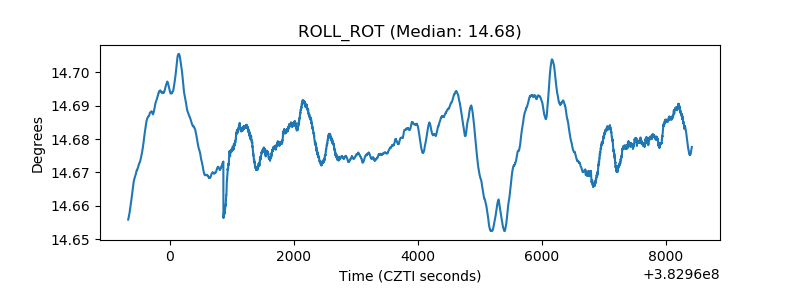 |
| _Roll_DEC | 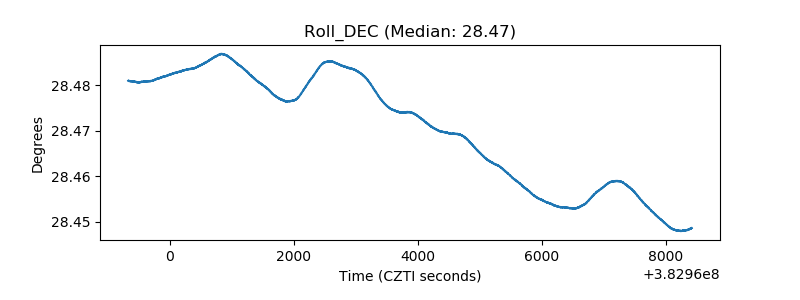 |
| _Roll_RA | 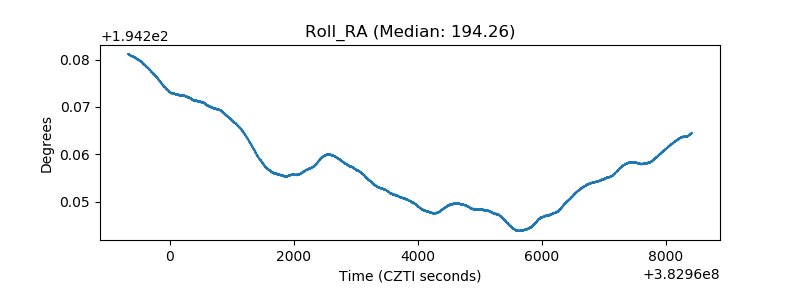 |
| Veto Counter | 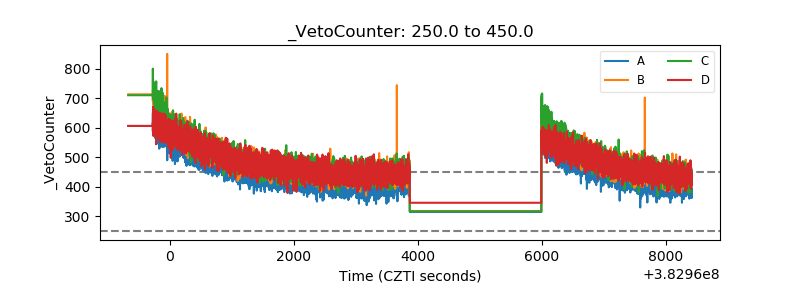 |