| Param | Original file | Final file |
|---|---|---|
| Filename | modeM0/AS1A05_167T01_9000004940_34580cztM0_level2.evt | modeM0/AS1A05_167T01_9000004940_34580cztM0_level2_quad_clean.evt |
| Size (bytes) | 424,160,640 | 67,121,280 |
| Size | 404.5 MB | 64.0 MB |
| Events in quadrant A | 2,515,501 | 429,572 |
| Events in quadrant B | 2,833,734 | 439,071 |
| Events in quadrant C | 2,608,116 | 428,878 |
| Events in quadrant D | 4,555,368 | 390,408 |
| Mode SS | |||
|---|---|---|---|
| Quadrant | BADHDUFLAG | Total packets | Discarded packets |
| A | 0 | 104 | 6 |
| B | 0 | 104 | 6 |
| C | 0 | 105 | 7 |
| D | 0 | 104 | 6 |
| Mode M9 | |||
|---|---|---|---|
| Quadrant | BADHDUFLAG | Total packets | Discarded packets |
| A | 0 | 20 | 0 |
| B | 0 | 20 | 0 |
| C | 0 | 20 | 0 |
| D | 0 | 20 | 0 |
| Mode M0 | |||
|---|---|---|---|
| Quadrant | BADHDUFLAG | Total packets | Discarded packets |
| A | 0 | 10574 | 353 |
| B | 0 | 11613 | 414 |
| C | 0 | 10707 | 385 |
| D | 0 | 17784 | 639 |
| Quadrant | Total seconds | Saturated seconds | Saturation percentage |
|---|---|---|---|
| A | 4929 | 12 | 0.243457% |
| B | 4913 | 60 | 1.221250% |
| C | 4913 | 10 | 0.203542% |
| D | 4900 | 246 | 5.020408% |
Noise dominated data is calculated using 1-second bins in cleaned event files. If a bin has >2000 counts, and if more than 50% of those come from <1% of pixels, then it is considered to be noise-dominated and hence unusable.
| Quadrant | # 1 sec bins | Bins with >0 counts | Bins with >2000 counts | High rate bins dominated by noise | Noise dominated (total time) | Noise dominated (detector-on time) | Marked lightcurve |
|---|---|---|---|---|---|---|---|
| A | 7073 | 4978 | 8 | 8 | 0.11% | 0.16% | 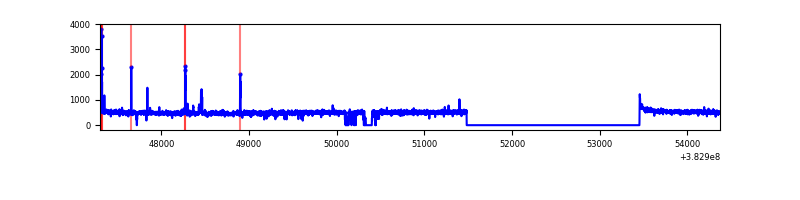 |
| B | 7073 | 4978 | 45 | 45 | 0.64% | 0.90% | 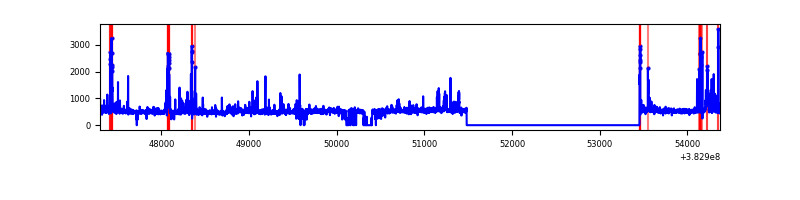 |
| C | 7073 | 4965 | 4 | 4 | 0.06% | 0.08% | 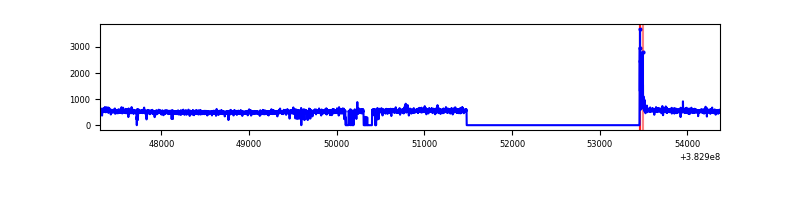 |
| D | 7073 | 4958 | 197 | 197 | 2.79% | 3.97% | 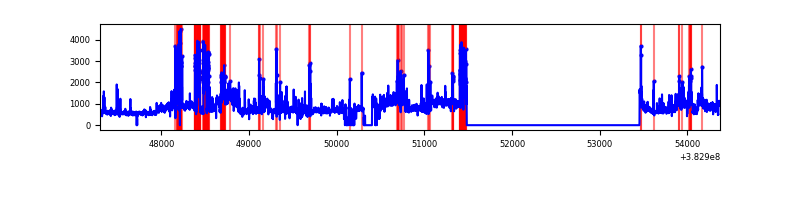 |
Top three noisy pixels from each quadrant. If the there are fewer than three noisy pixels in the level2.evt file, extra rows are filled as -1
| Pixel properties | Quadrant properties | ||||||
|---|---|---|---|---|---|---|---|
| Quadrant | DetID | PixID | Counts | Sigma | Mean | Median | Sigma |
| A | 9 | 143 | 37727 | 296.47 | 627 | 616 | 125.2 |
| A | 10 | 83 | 29177 | 228.17 | 627 | 616 | 125.2 |
| A | 15 | 174 | 19624 | 151.85 | 627 | 616 | 125.2 |
| B | 5 | 172 | 200506 | 1710.74 | 614 | 599 | 116.9 |
| B | 0 | 189 | 86071 | 731.44 | 614 | 599 | 116.9 |
| B | 0 | 245 | 43407 | 366.34 | 614 | 599 | 116.9 |
| C | 15 | 214 | 209028 | 1504.27 | 601 | 605 | 138.6 |
| C | 0 | 10 | 38684 | 274.83 | 601 | 605 | 138.6 |
| C | 14 | 67 | 10310 | 70.04 | 601 | 605 | 138.6 |
| D | 8 | 195 | 1252413 | 8653.82 | 590 | 576 | 144.7 |
| D | 1 | 52 | 509312 | 3516.84 | 590 | 576 | 144.7 |
| D | 2 | 249 | 168777 | 1162.76 | 590 | 576 | 144.7 |
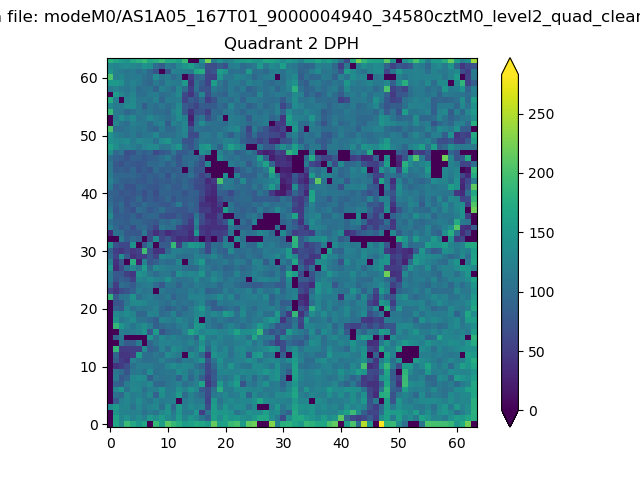
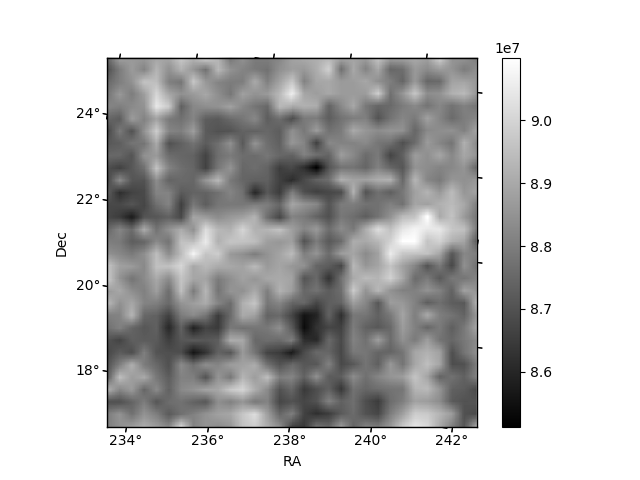
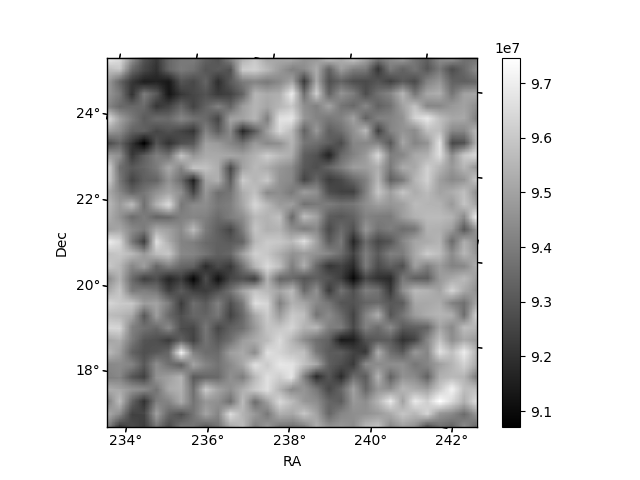
Histogram calculated using DETX and DETY for each event in the final _common_clean file
| Quadrant A | 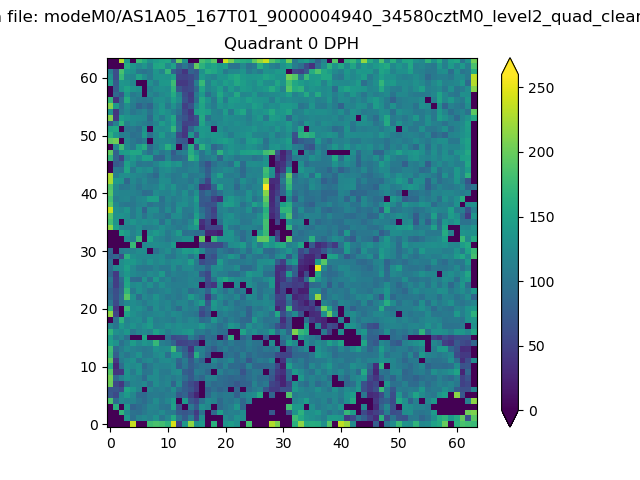 |
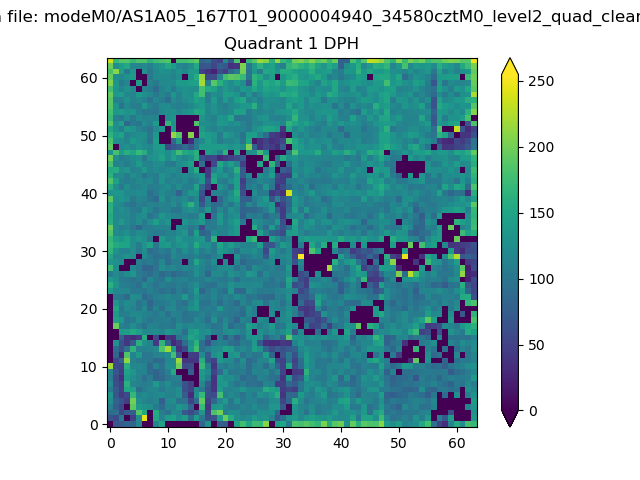 |
Quadrant B |
|---|---|---|---|
| Quadrant D | 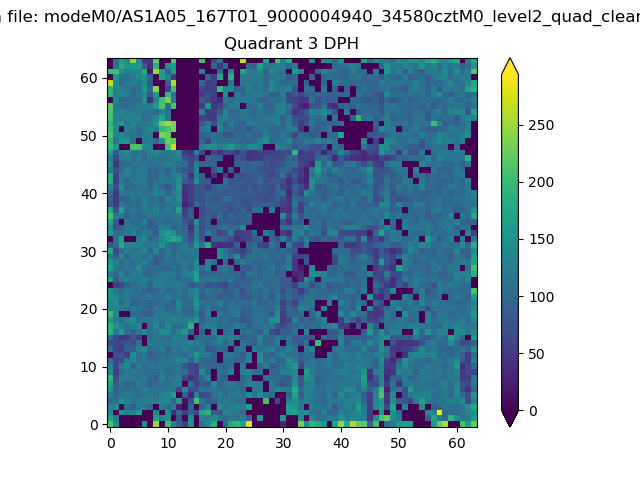 |
 |
Quadrant C |
| Plot type | Count rate plots | Images |
|---|---|---|
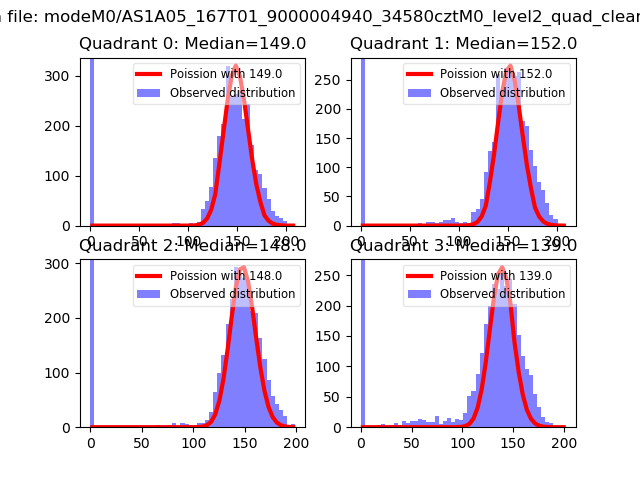
| Comparison with Poisson distribution Blue bars denote a histogram of data divided into 1 sec bins. Red curve is a Poisson curve with rate = median count rate of data. |
 |
 |
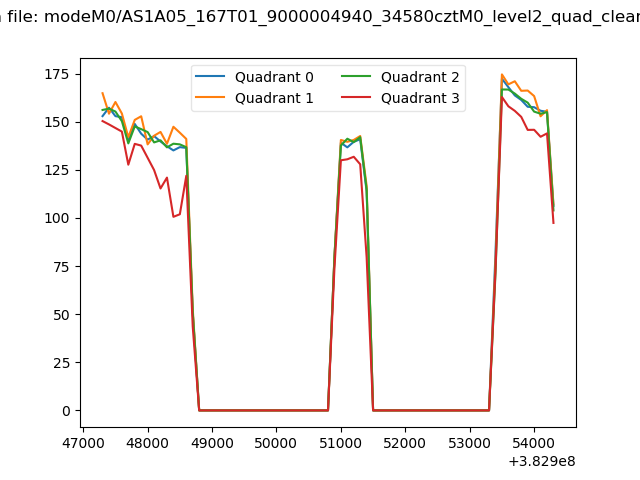
| Quadrant-wise count rates Data is divided into 100 sec bins |
 |
|
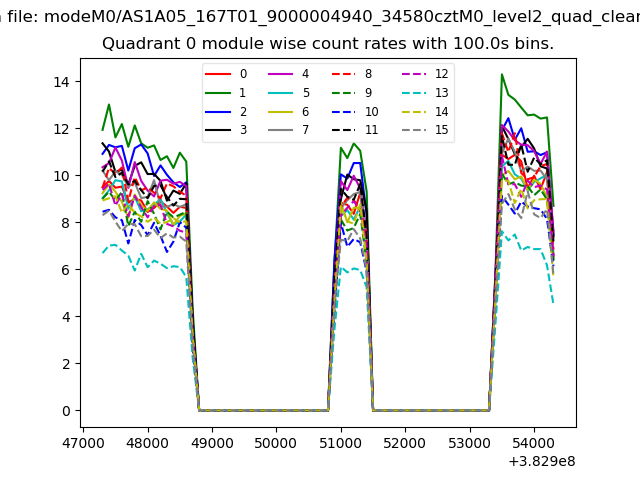
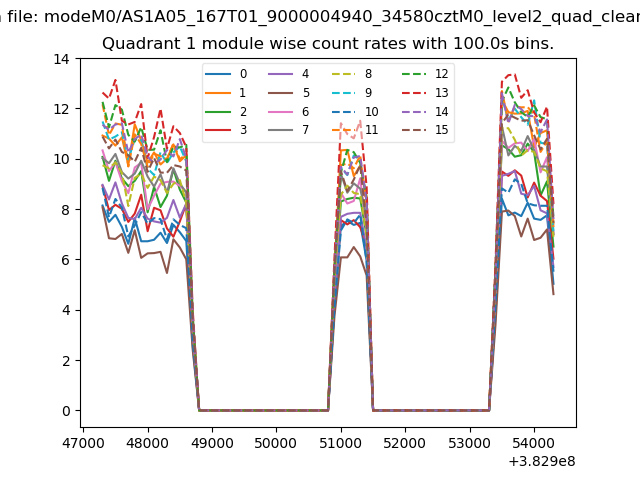
| Module-wise count rates for Quadrant A Data is divided into 100 sec bins |
 |
 |
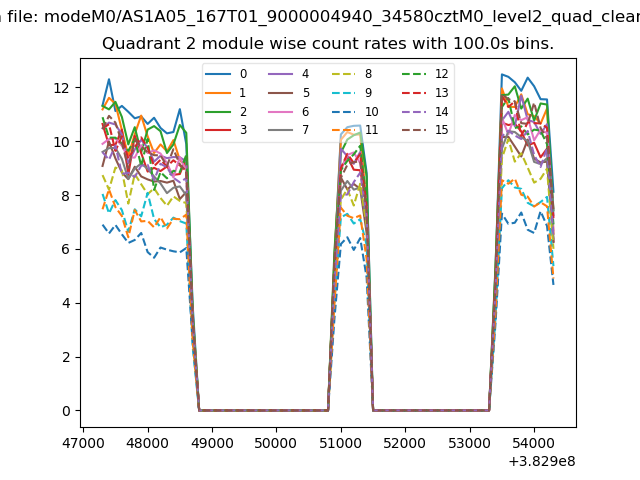
| Module-wise count rates for Quadrant B Data is divided into 100 sec bins |
 |
 |
| Module-wise count rates for Quadrant C Data is divided into 100 sec bins |
 |
 |
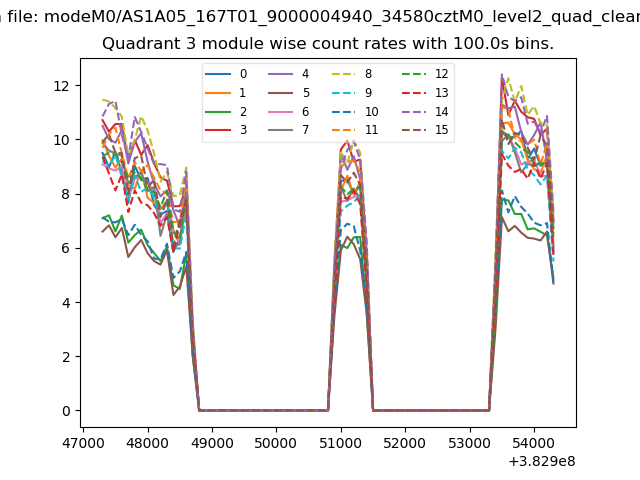
| Module-wise count rates for Quadrant D Data is divided into 100 sec bins |
 |
 |
| Parameter | Plot |
|---|---|
| CZT HV Monitor | 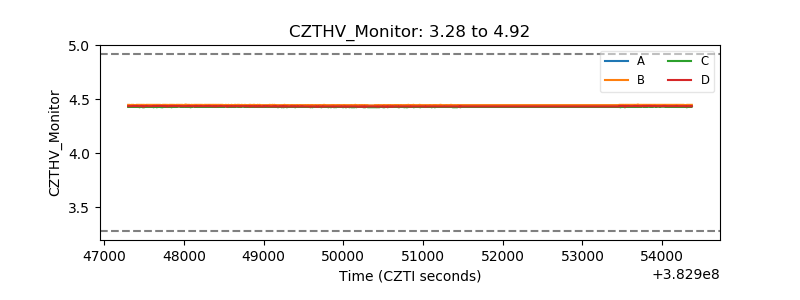 |
| D_VDD | 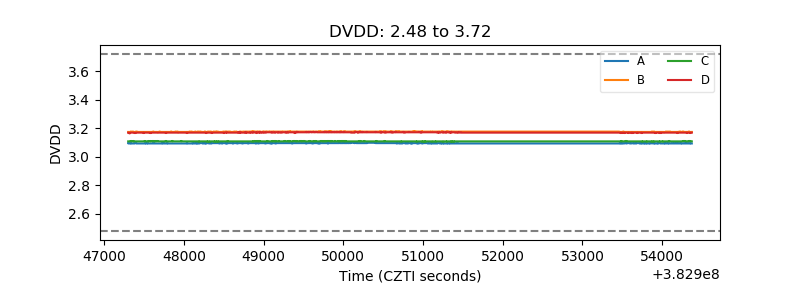 |
| Temperature 1 | 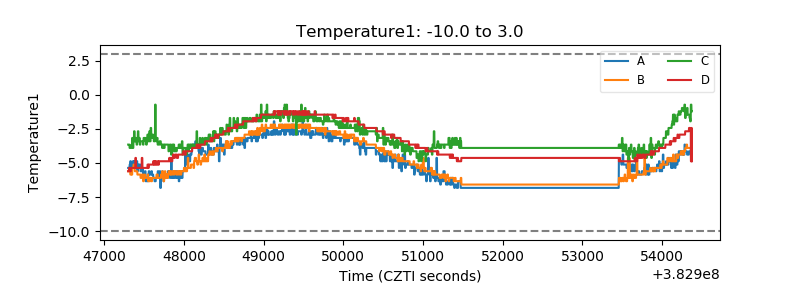 |
| Veto HV Monitor | 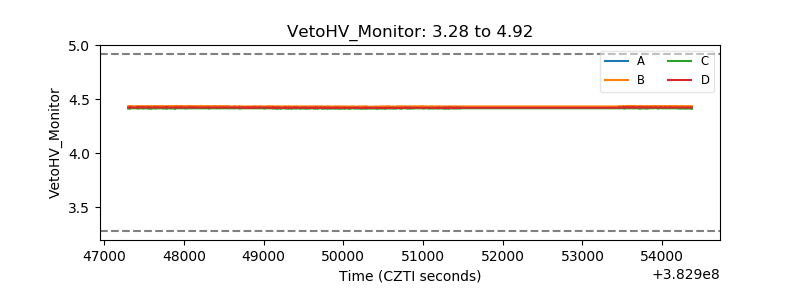 |
| Veto LLD | 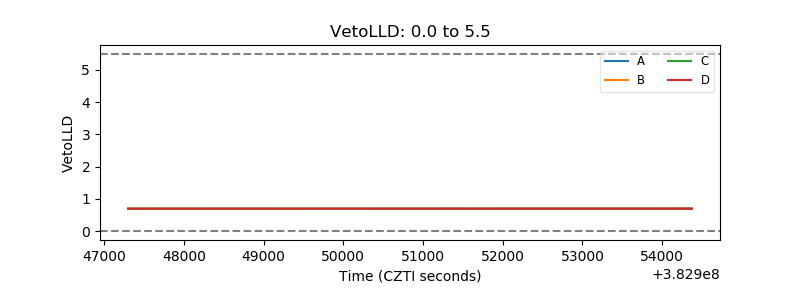 |
| Alpha Counter | 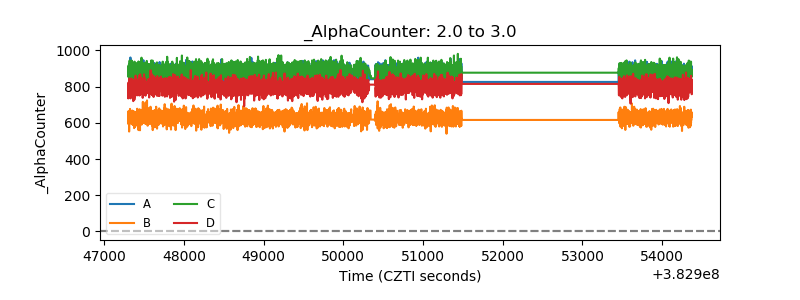 |
| _CPM_Rate | 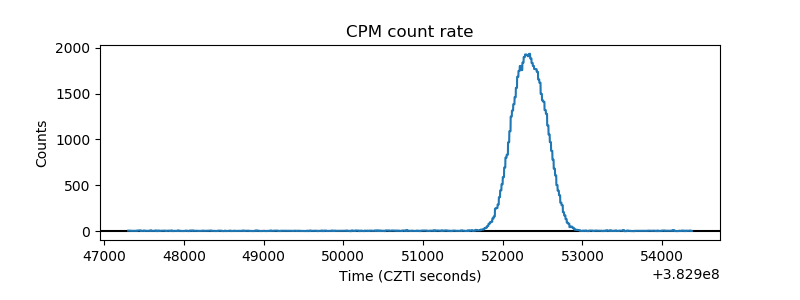 |
| CZT Counter | 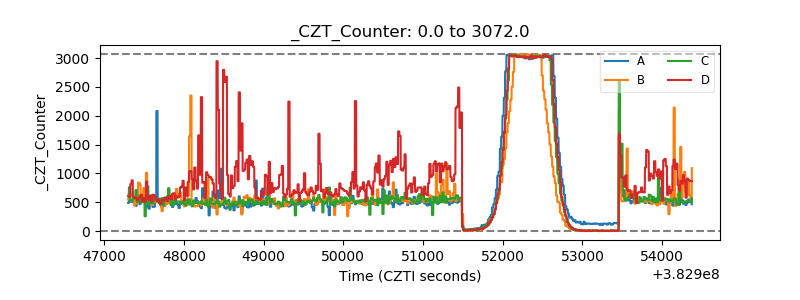 |
| +2.5 Volts monitor | 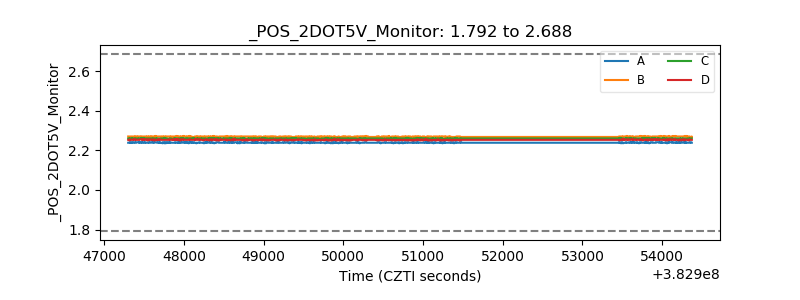 |
| +5 Volts monitor | 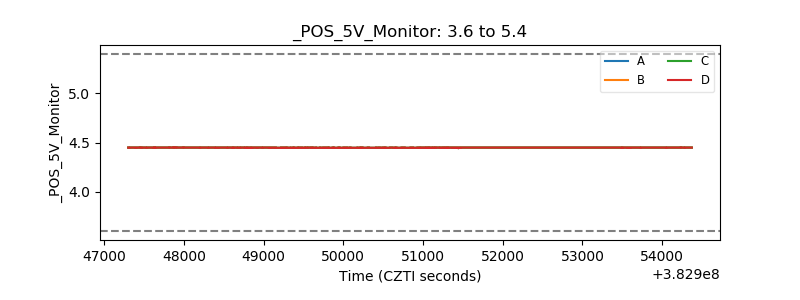 |
| _ROLL_ROT | 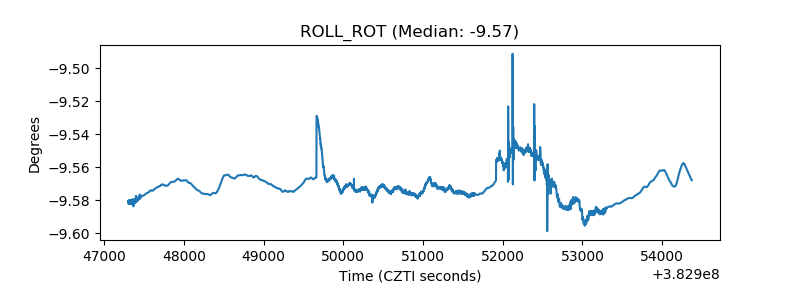 |
| _Roll_DEC | 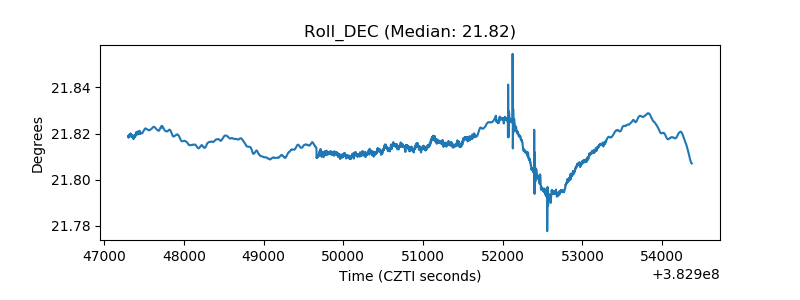 |
| _Roll_RA | 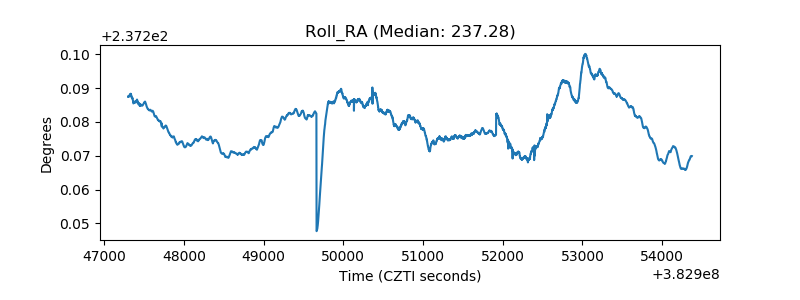 |
| Veto Counter | 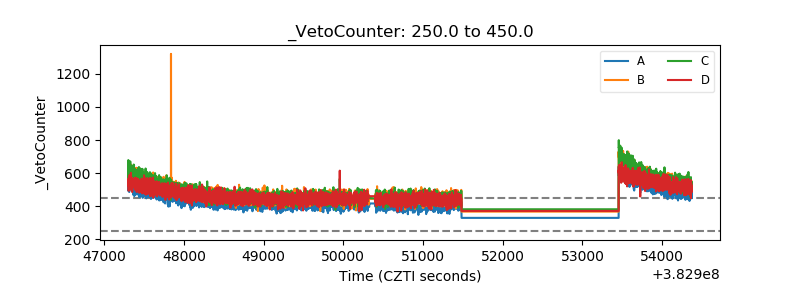 |