| Param | Original file | Final file |
|---|---|---|
| Filename | modeM0/AS1A05_167T01_9000004940_34576cztM0_level2.evt | modeM0/AS1A05_167T01_9000004940_34576cztM0_level2_quad_clean.evt |
| Size (bytes) | 514,823,040 | 78,477,120 |
| Size | 491.0 MB | 74.8 MB |
| Events in quadrant A | 2,657,363 | 496,815 |
| Events in quadrant B | 3,296,477 | 506,804 |
| Events in quadrant C | 2,870,395 | 502,094 |
| Events in quadrant D | 6,371,048 | 462,004 |
| Mode SS | |||
|---|---|---|---|
| Quadrant | BADHDUFLAG | Total packets | Discarded packets |
| A | 0 | 118 | 0 |
| B | 0 | 118 | 0 |
| C | 0 | 118 | 0 |
| D | 0 | 118 | 0 |
| Mode M9 | |||
|---|---|---|---|
| Quadrant | BADHDUFLAG | Total packets | Discarded packets |
| A | 0 | 25 | 0 |
| B | 0 | 25 | 0 |
| C | 0 | 25 | 0 |
| D | 0 | 26 | 0 |
| Mode M0 | |||
|---|---|---|---|
| Quadrant | BADHDUFLAG | Total packets | Discarded packets |
| A | 0 | 11866 | 3 |
| B | 0 | 13545 | 2 |
| C | 0 | 12108 | 2 |
| D | 0 | 23118 | 2 |
| Quadrant | Total seconds | Saturated seconds | Saturation percentage |
|---|---|---|---|
| A | 5851 | 6 | 0.102547% |
| B | 5851 | 133 | 2.273116% |
| C | 5851 | 12 | 0.205093% |
| D | 5851 | 441 | 7.537173% |
Noise dominated data is calculated using 1-second bins in cleaned event files. If a bin has >2000 counts, and if more than 50% of those come from <1% of pixels, then it is considered to be noise-dominated and hence unusable.
| Quadrant | # 1 sec bins | Bins with >0 counts | Bins with >2000 counts | High rate bins dominated by noise | Noise dominated (total time) | Noise dominated (detector-on time) | Marked lightcurve |
|---|---|---|---|---|---|---|---|
| A | 7433 | 5852 | 0 | 0 | 0.00% | 0.00% | 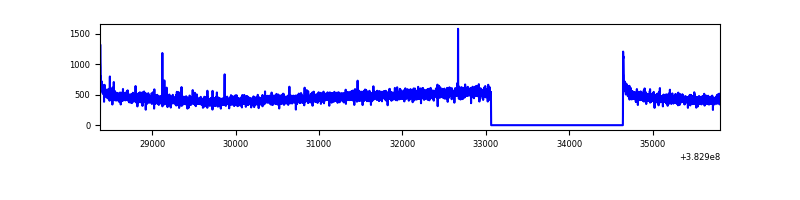 |
| B | 7433 | 5852 | 97 | 97 | 1.30% | 1.66% | 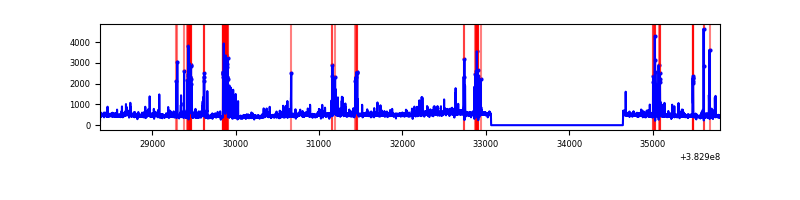 |
| C | 7433 | 5852 | 4 | 4 | 0.05% | 0.07% | 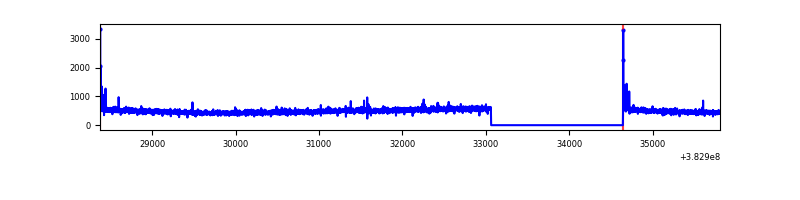 |
| D | 7433 | 5852 | 286 | 286 | 3.85% | 4.89% | 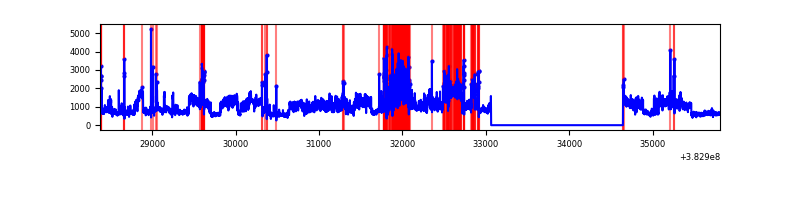 |
Top three noisy pixels from each quadrant. If the there are fewer than three noisy pixels in the level2.evt file, extra rows are filled as -1
| Pixel properties | Quadrant properties | ||||||
|---|---|---|---|---|---|---|---|
| Quadrant | DetID | PixID | Counts | Sigma | Mean | Median | Sigma |
| A | 10 | 83 | 42784 | 310.29 | 673 | 660 | 135.8 |
| A | 13 | 6 | 11337 | 78.65 | 673 | 660 | 135.8 |
| A | 13 | 254 | 9981 | 68.66 | 673 | 660 | 135.8 |
| B | 5 | 172 | 398178 | 3105.67 | 668 | 650 | 128.0 |
| B | 0 | 189 | 78648 | 609.35 | 668 | 650 | 128.0 |
| B | 0 | 229 | 73738 | 570.99 | 668 | 650 | 128.0 |
| C | 15 | 214 | 247911 | 1615.95 | 654 | 658 | 153.0 |
| C | 0 | 10 | 40580 | 260.92 | 654 | 658 | 153.0 |
| C | 14 | 67 | 27748 | 177.05 | 654 | 658 | 153.0 |
| D | 8 | 195 | 2976212 | 19312.94 | 630 | 613 | 154.1 |
| D | 2 | 249 | 324199 | 2100.22 | 630 | 613 | 154.1 |
| D | 1 | 47 | 213904 | 1384.35 | 630 | 613 | 154.1 |
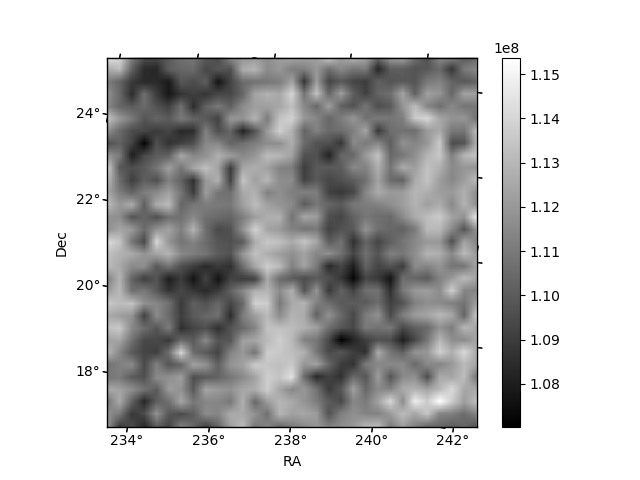
Histogram calculated using DETX and DETY for each event in the final _common_clean file
| Quadrant A | 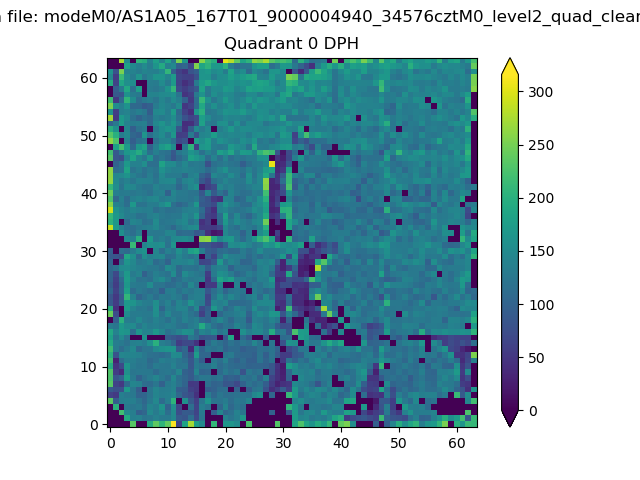 |
 |
Quadrant B |
|---|---|---|---|
| Quadrant D | 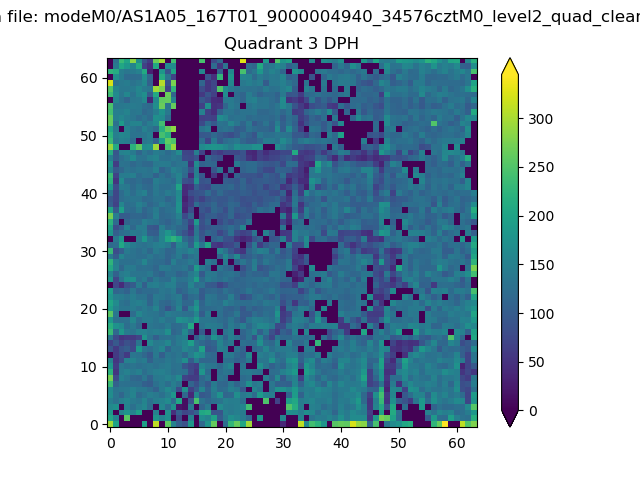 |
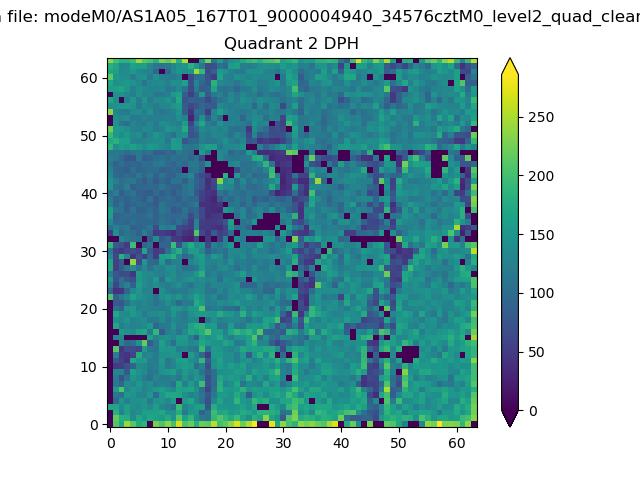 |
Quadrant C |
| Plot type | Count rate plots | Images |
|---|---|---|
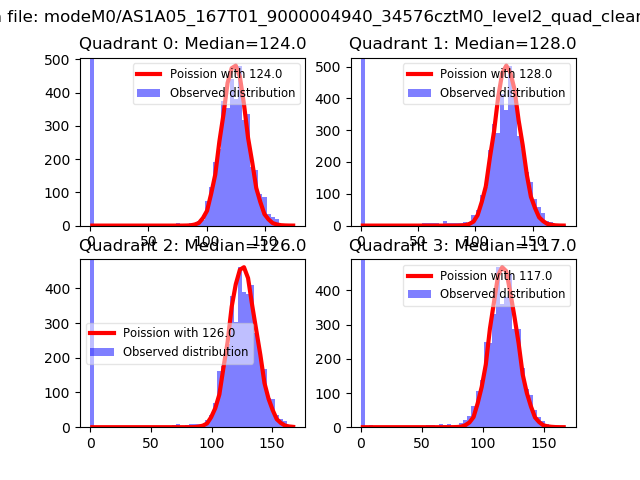
| Comparison with Poisson distribution Blue bars denote a histogram of data divided into 1 sec bins. Red curve is a Poisson curve with rate = median count rate of data. |
 |
 |
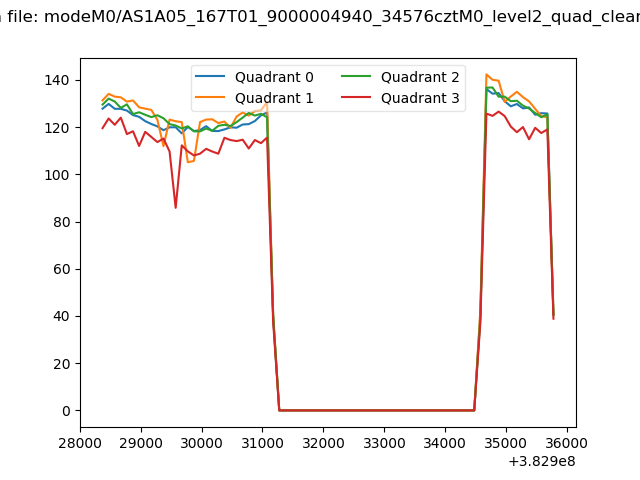
| Quadrant-wise count rates Data is divided into 100 sec bins |
 |
|
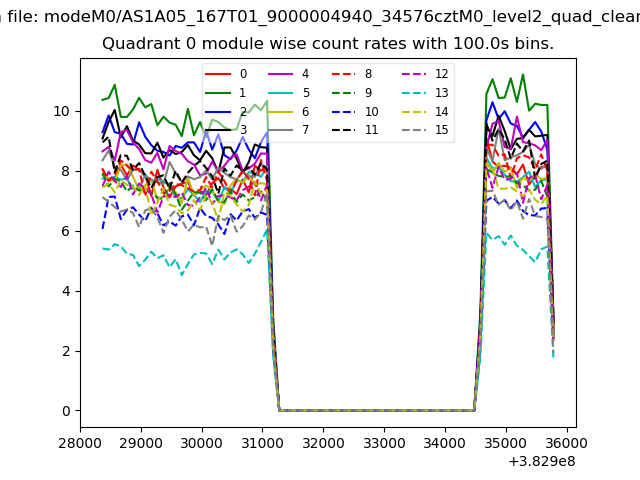
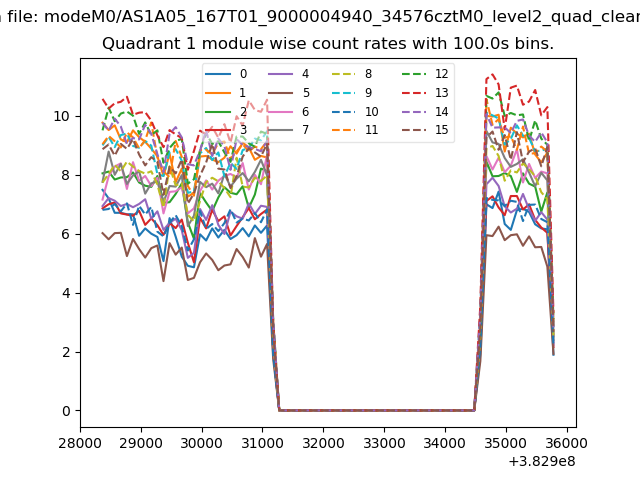
| Module-wise count rates for Quadrant A Data is divided into 100 sec bins |
 |
 |
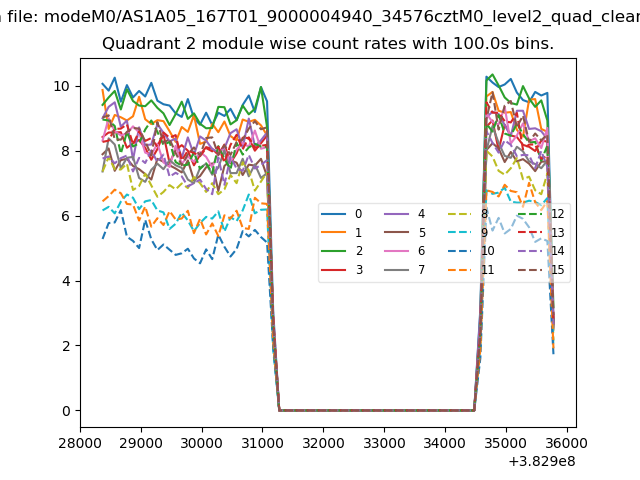
| Module-wise count rates for Quadrant B Data is divided into 100 sec bins |
 |
 |
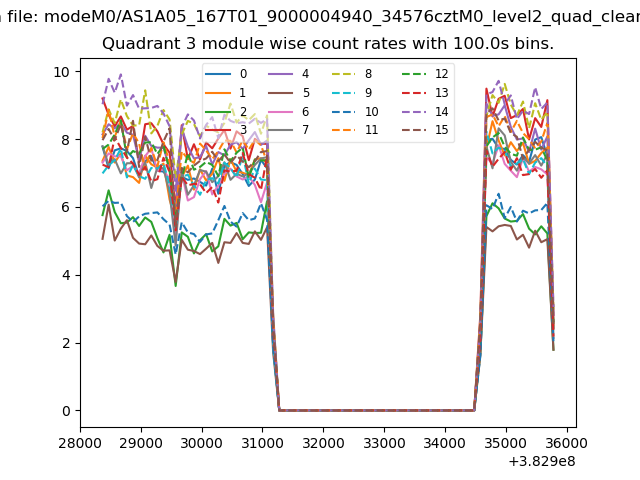
| Module-wise count rates for Quadrant C Data is divided into 100 sec bins |
 |
 |
| Module-wise count rates for Quadrant D Data is divided into 100 sec bins |
 |
 |
| Parameter | Plot |
|---|---|
| CZT HV Monitor | 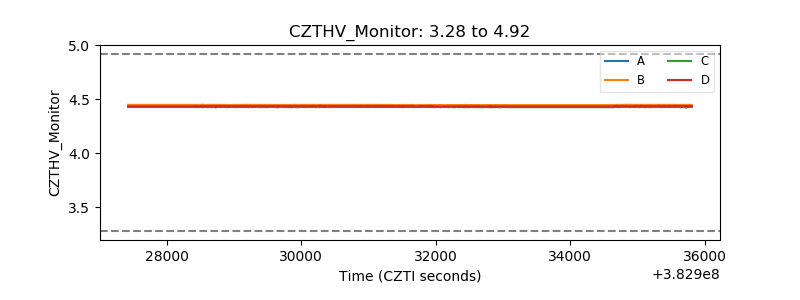 |
| D_VDD | 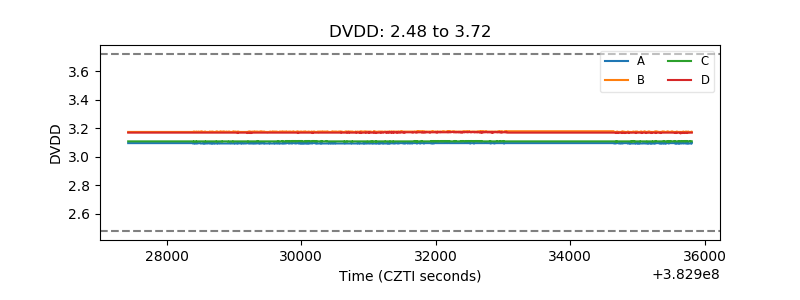 |
| Temperature 1 | 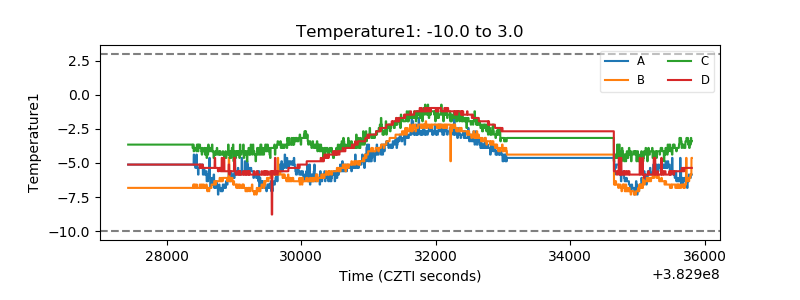 |
| Veto HV Monitor | 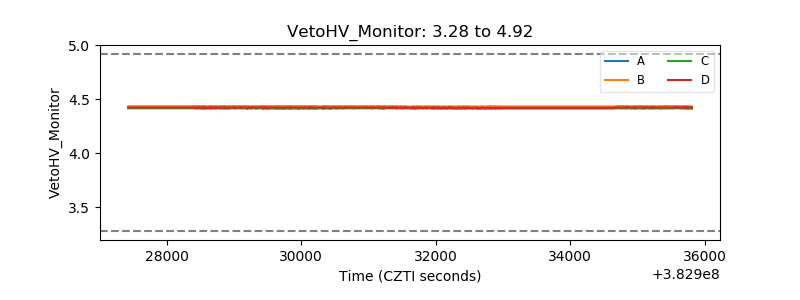 |
| Veto LLD | 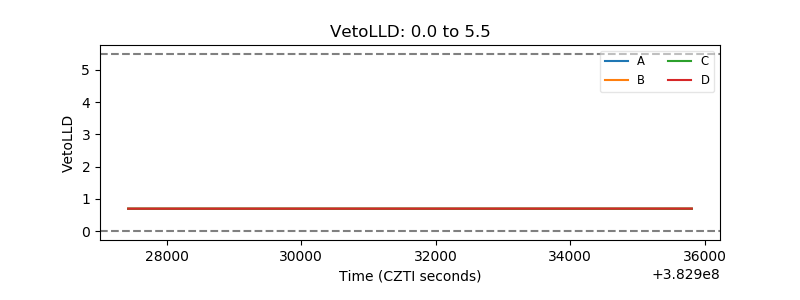 |
| Alpha Counter | 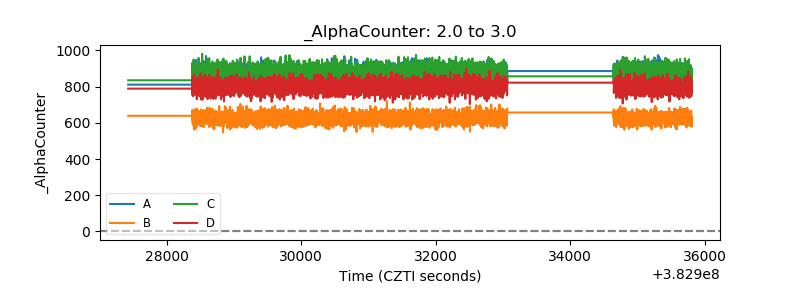 |
| _CPM_Rate | 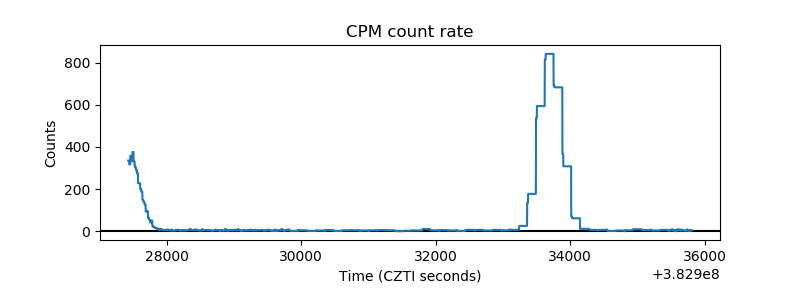 |
| CZT Counter | 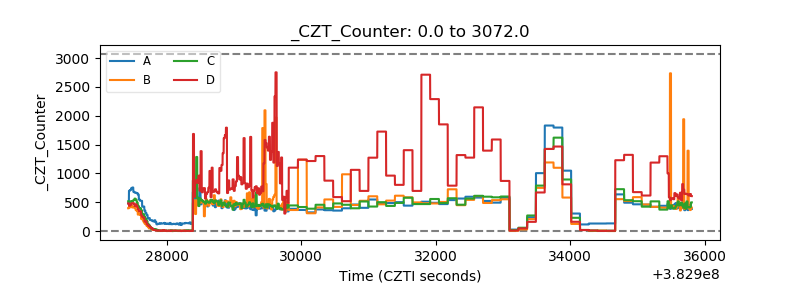 |
| +2.5 Volts monitor | 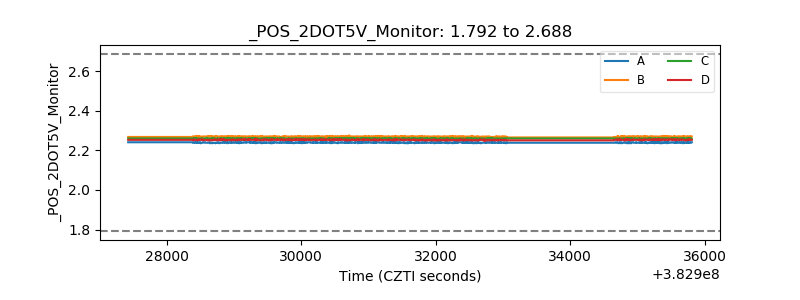 |
| +5 Volts monitor | 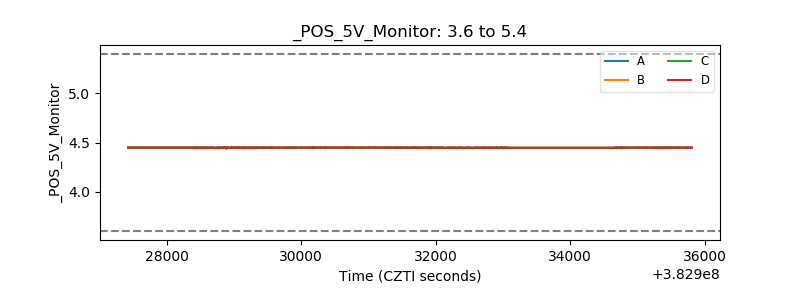 |
| _ROLL_ROT | 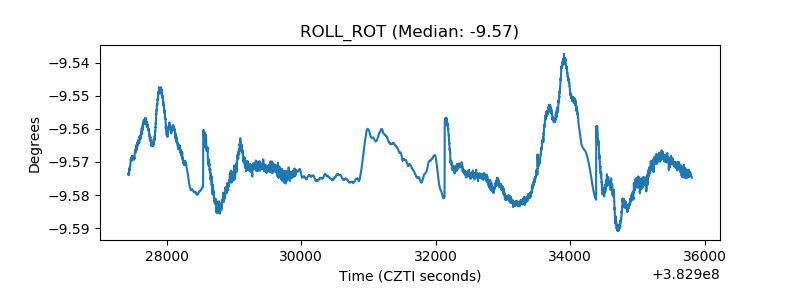 |
| _Roll_DEC | 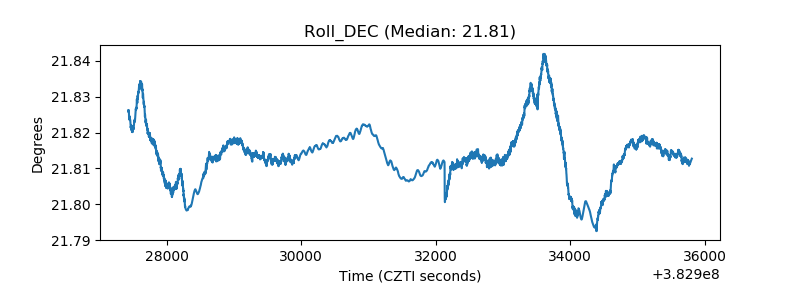 |
| _Roll_RA | 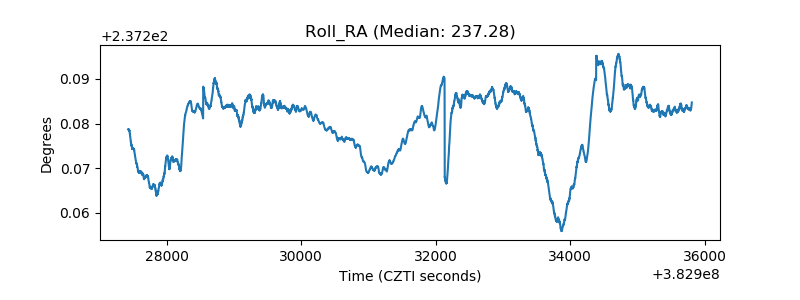 |
| Veto Counter | 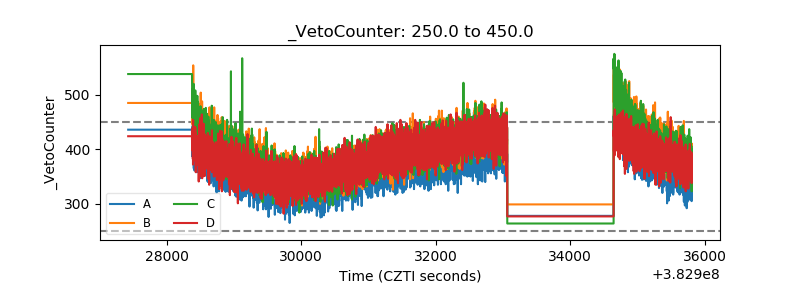 |