| Param | Original file | Final file |
|---|---|---|
| Filename | modeM0/AS1A05_167T01_9000004940_34570cztM0_level2.evt | modeM0/AS1A05_167T01_9000004940_34570cztM0_level2_quad_clean.evt |
| Size (bytes) | 509,647,680 | 59,520,960 |
| Size | 486.0 MB | 56.8 MB |
| Events in quadrant A | 2,628,081 | 361,504 |
| Events in quadrant B | 4,104,177 | 354,718 |
| Events in quadrant C | 2,927,242 | 363,919 |
| Events in quadrant D | 5,405,712 | 340,103 |
| Mode SS | |||
|---|---|---|---|
| Quadrant | BADHDUFLAG | Total packets | Discarded packets |
| A | 0 | 112 | 0 |
| B | 0 | 112 | 0 |
| C | 0 | 112 | 0 |
| D | 0 | 112 | 0 |
| Mode M9 | |||
|---|---|---|---|
| Quadrant | BADHDUFLAG | Total packets | Discarded packets |
| A | 0 | 25 | 0 |
| B | 0 | 25 | 0 |
| C | 0 | 25 | 0 |
| D | 0 | 26 | 0 |
| Mode M0 | |||
|---|---|---|---|
| Quadrant | BADHDUFLAG | Total packets | Discarded packets |
| A | 0 | 11251 | 3 |
| B | 0 | 15680 | 2 |
| C | 0 | 11698 | 2 |
| D | 0 | 19930 | 2 |
| Quadrant | Total seconds | Saturated seconds | Saturation percentage |
|---|---|---|---|
| A | 5449 | 8 | 0.146816% |
| B | 5449 | 453 | 8.313452% |
| C | 5449 | 53 | 0.972656% |
| D | 5449 | 344 | 6.313085% |
Noise dominated data is calculated using 1-second bins in cleaned event files. If a bin has >2000 counts, and if more than 50% of those come from <1% of pixels, then it is considered to be noise-dominated and hence unusable.
| Quadrant | # 1 sec bins | Bins with >0 counts | Bins with >2000 counts | High rate bins dominated by noise | Noise dominated (total time) | Noise dominated (detector-on time) | Marked lightcurve |
|---|---|---|---|---|---|---|---|
| A | 7242 | 5450 | 0 | 0 | 0.00% | 0.00% | 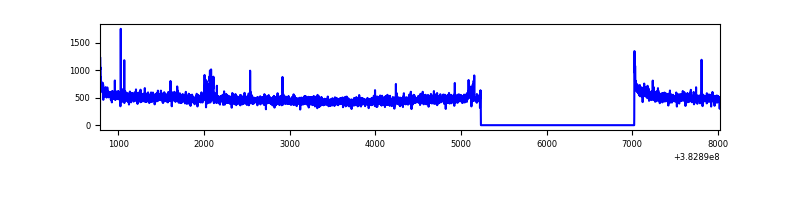 |
| B | 7242 | 5450 | 303 | 303 | 4.18% | 5.56% | 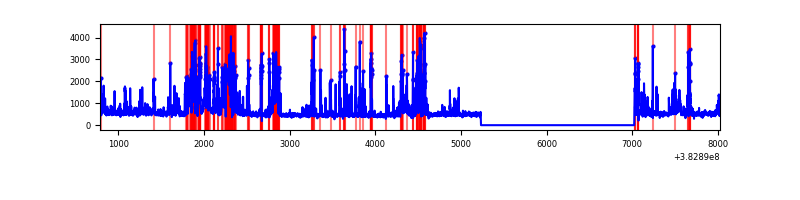 |
| C | 7242 | 5450 | 38 | 38 | 0.52% | 0.70% | 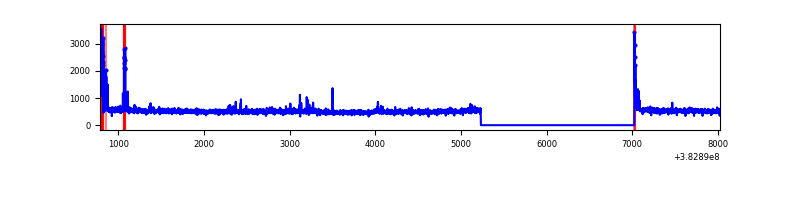 |
| D | 7242 | 5450 | 304 | 304 | 4.20% | 5.58% | 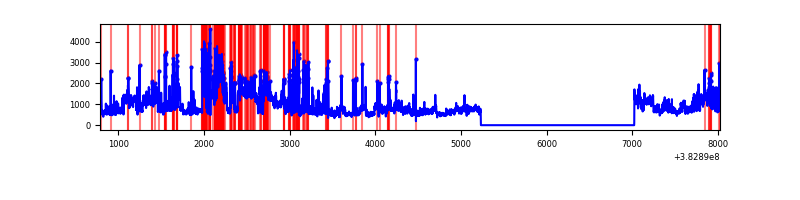 |
Top three noisy pixels from each quadrant. If the there are fewer than three noisy pixels in the level2.evt file, extra rows are filled as -1
| Pixel properties | Quadrant properties | ||||||
|---|---|---|---|---|---|---|---|
| Quadrant | DetID | PixID | Counts | Sigma | Mean | Median | Sigma |
| A | 10 | 83 | 42709 | 318.57 | 652 | 638 | 132.1 |
| A | 15 | 169 | 38869 | 289.49 | 652 | 638 | 132.1 |
| A | 13 | 254 | 9970 | 70.66 | 652 | 638 | 132.1 |
| B | 5 | 172 | 1379965 | 11488.83 | 629 | 613 | 120.1 |
| B | 5 | 255 | 152520 | 1265.26 | 629 | 613 | 120.1 |
| B | 0 | 190 | 36877 | 302.05 | 629 | 613 | 120.1 |
| C | 15 | 214 | 230733 | 1560.97 | 635 | 639 | 147.4 |
| C | 0 | 10 | 128732 | 868.99 | 635 | 639 | 147.4 |
| C | 15 | 159 | 38333 | 255.72 | 635 | 639 | 147.4 |
| D | 8 | 195 | 1580702 | 10364.78 | 623 | 607 | 152.4 |
| D | 7 | 223 | 710063 | 4653.74 | 623 | 607 | 152.4 |
| D | 2 | 250 | 220768 | 1444.17 | 623 | 607 | 152.4 |
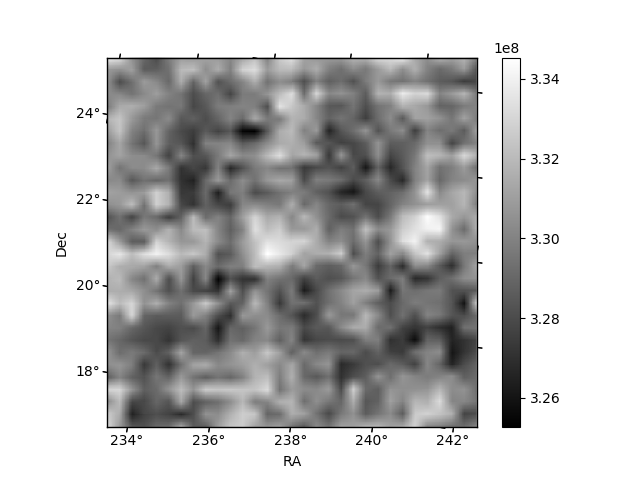
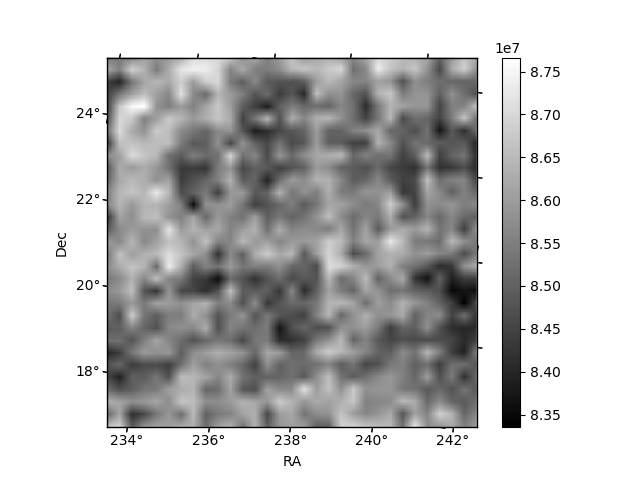
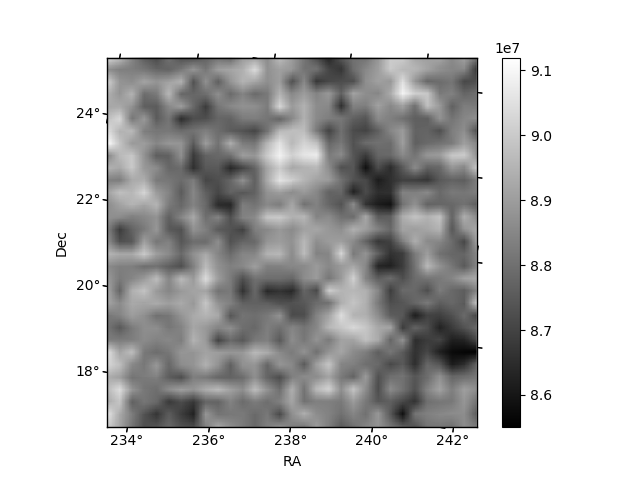
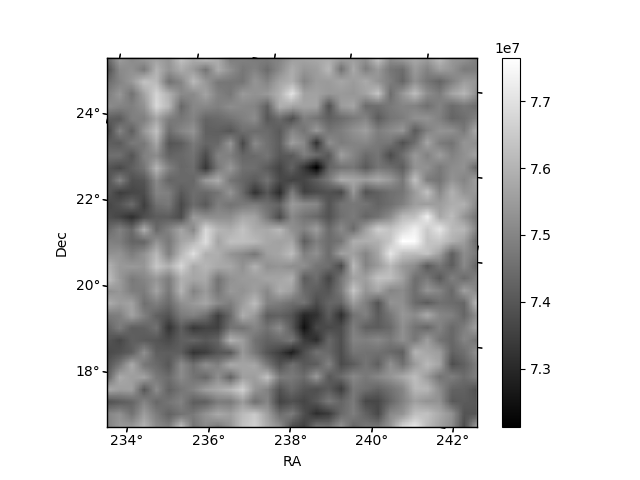
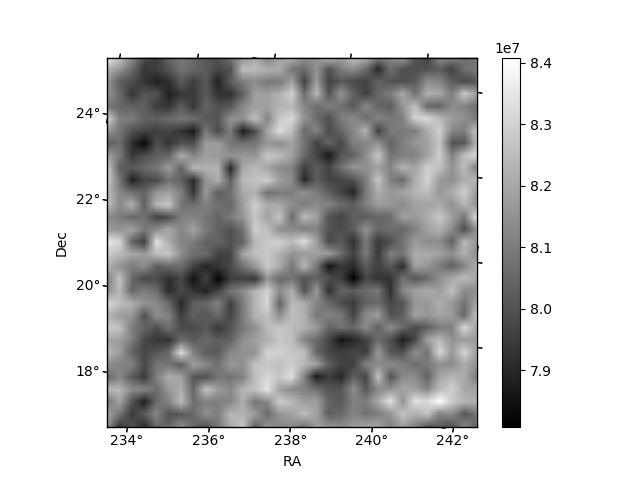
Histogram calculated using DETX and DETY for each event in the final _common_clean file
| Quadrant A | 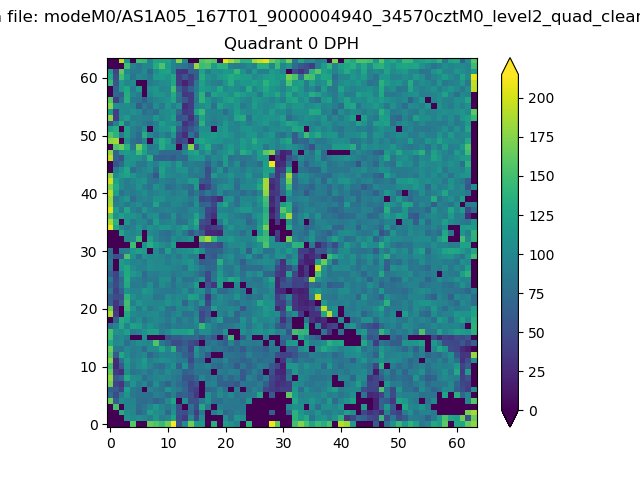 |
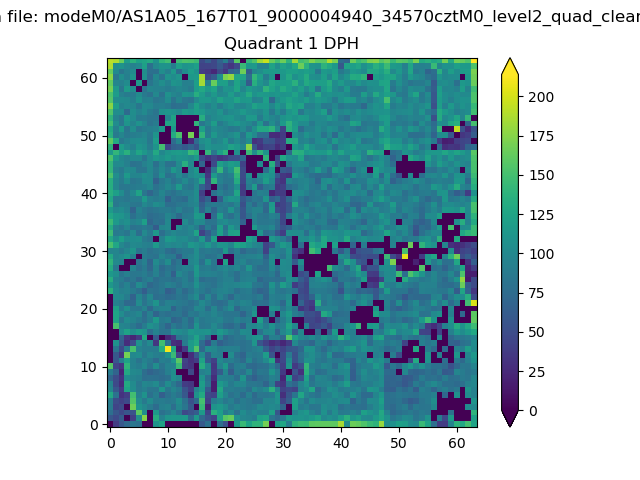 |
Quadrant B |
|---|---|---|---|
| Quadrant D | 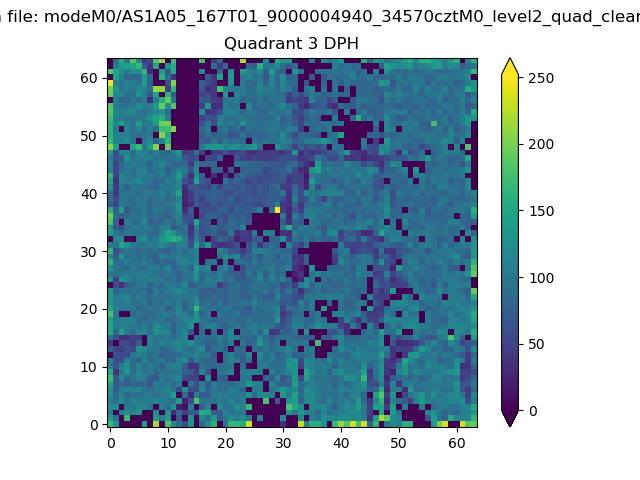 |
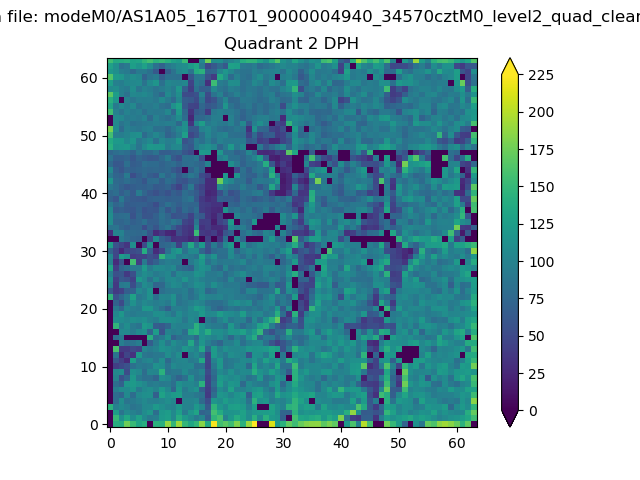 |
Quadrant C |
| Plot type | Count rate plots | Images |
|---|---|---|
| Comparison with Poisson distribution Blue bars denote a histogram of data divided into 1 sec bins. Red curve is a Poisson curve with rate = median count rate of data. |
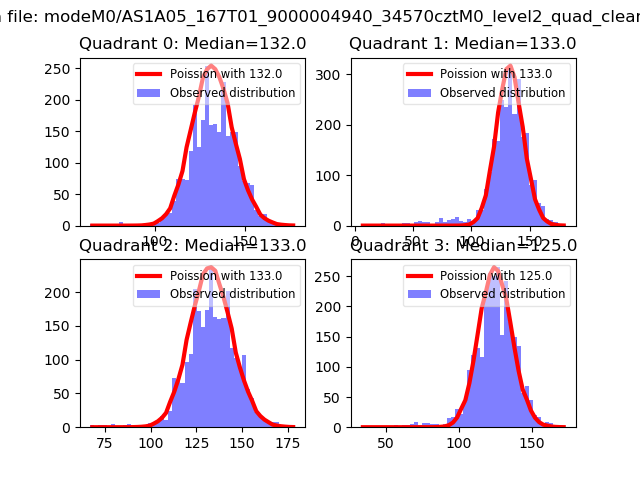 |
 |
| Quadrant-wise count rates Data is divided into 100 sec bins |
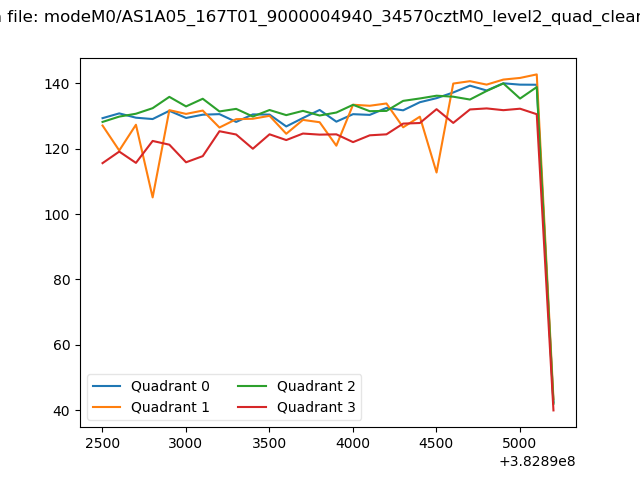 |
|
| Module-wise count rates for Quadrant A Data is divided into 100 sec bins |
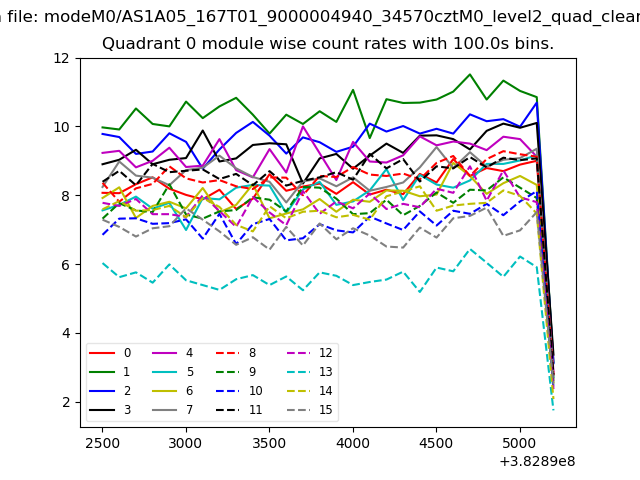 |
 |
| Module-wise count rates for Quadrant B Data is divided into 100 sec bins |
 |
 |
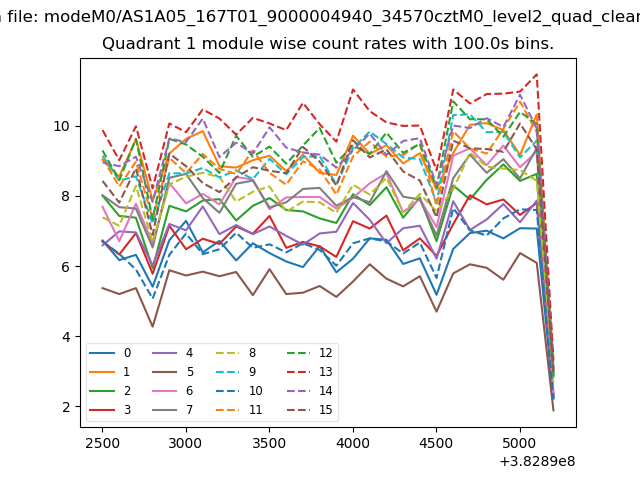
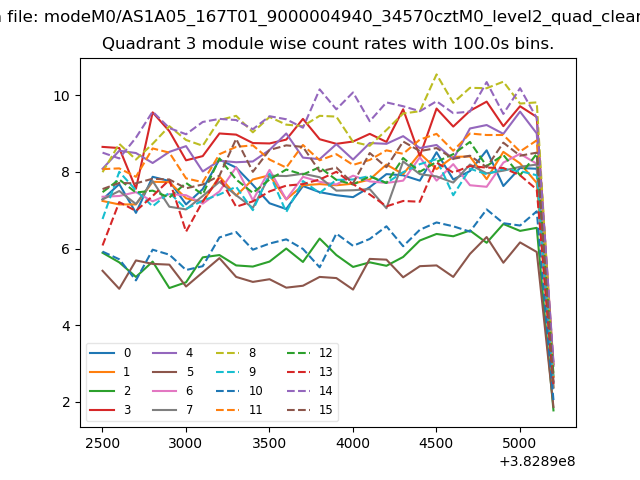
| Module-wise count rates for Quadrant C Data is divided into 100 sec bins |
 |
 |
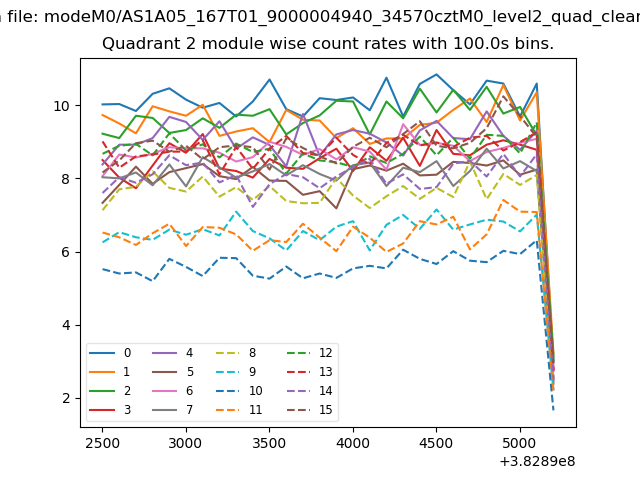
| Module-wise count rates for Quadrant D Data is divided into 100 sec bins |
 |
 |
| Parameter | Plot |
|---|---|
| CZT HV Monitor | 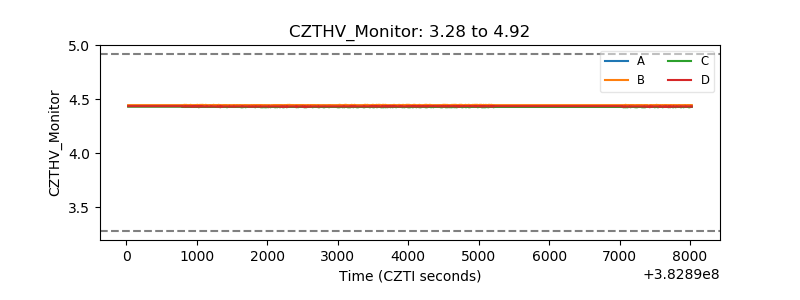 |
| D_VDD | 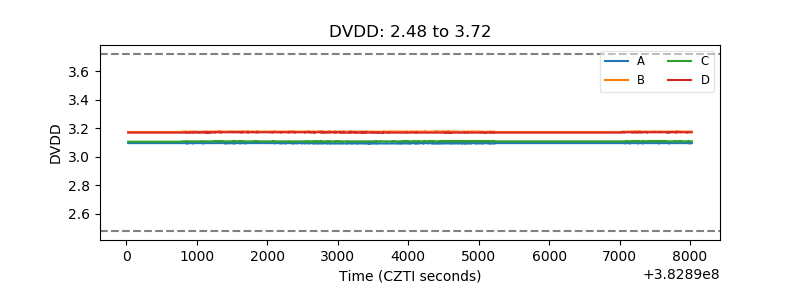 |
| Temperature 1 | 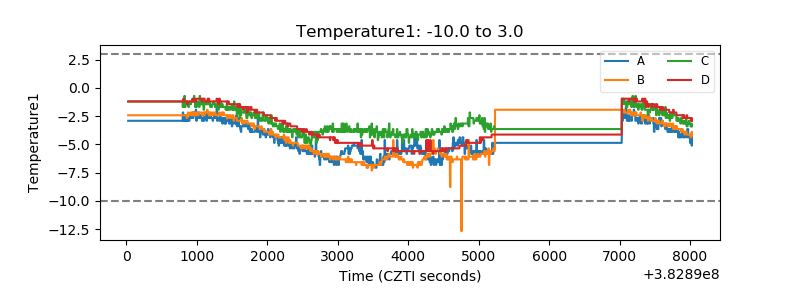 |
| Veto HV Monitor | 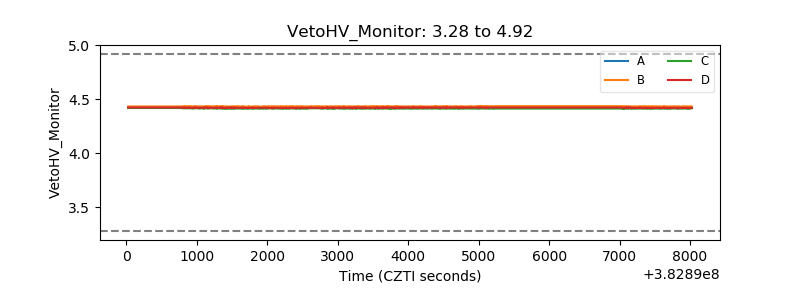 |
| Veto LLD | 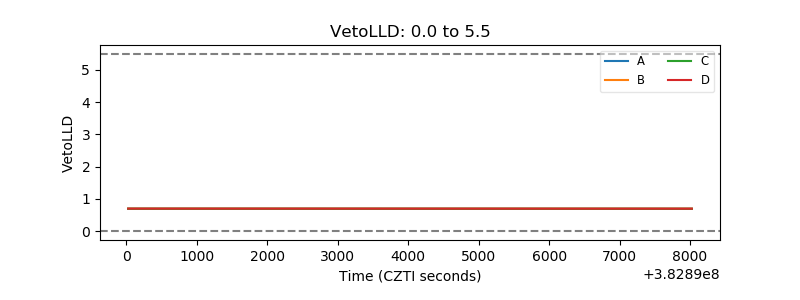 |
| Alpha Counter | 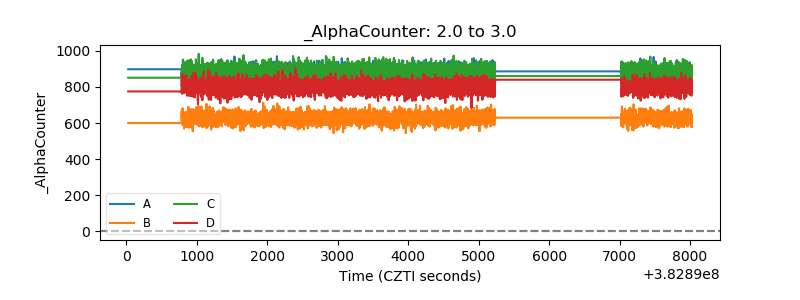 |
| _CPM_Rate | 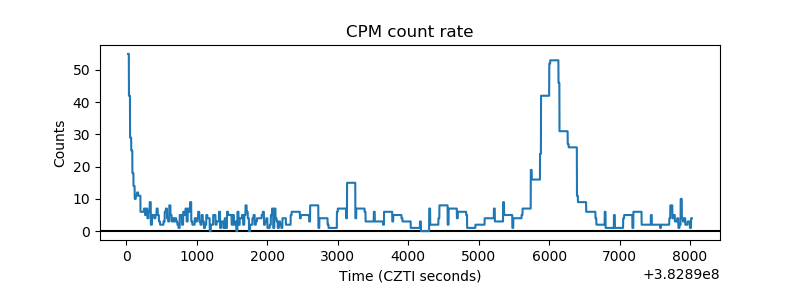 |
| CZT Counter | 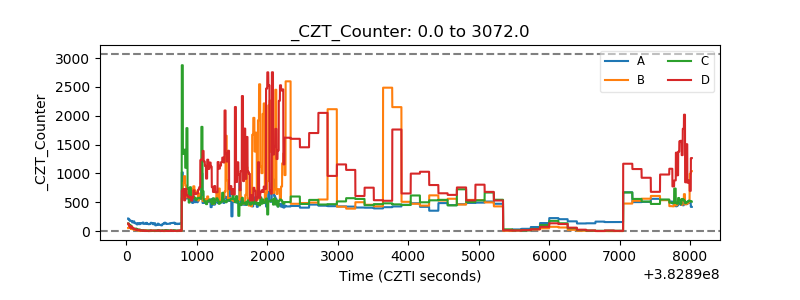 |
| +2.5 Volts monitor | 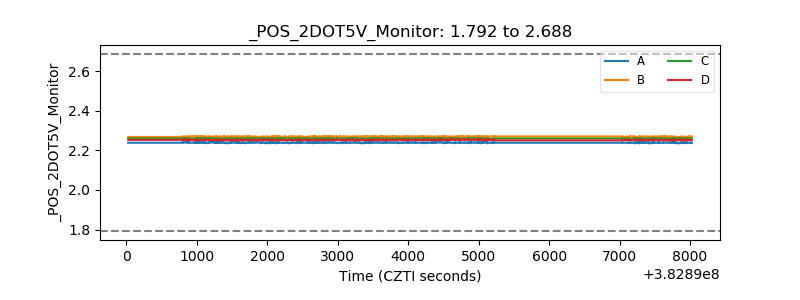 |
| +5 Volts monitor | 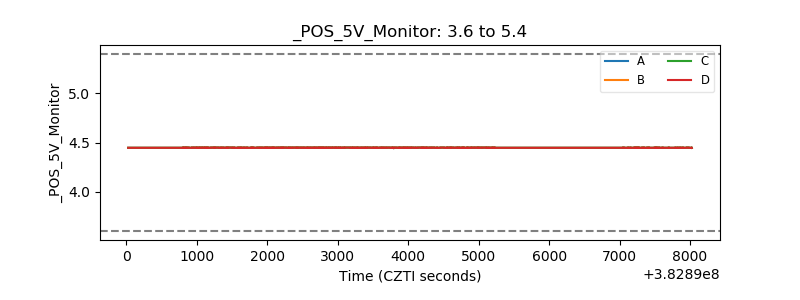 |
| _ROLL_ROT | 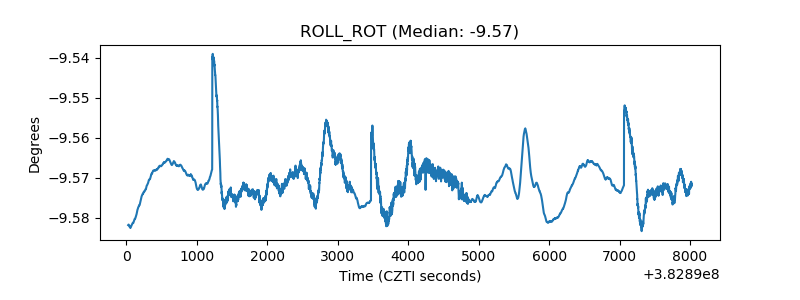 |
| _Roll_DEC | 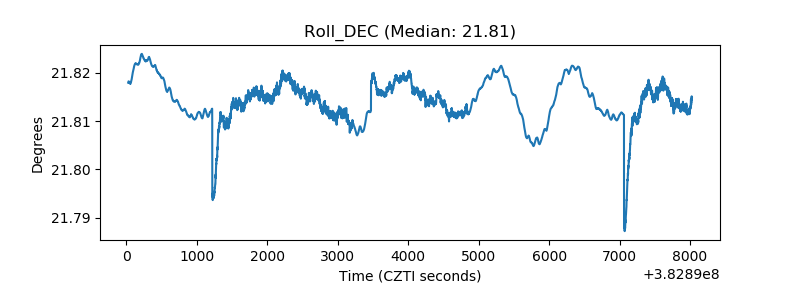 |
| _Roll_RA | 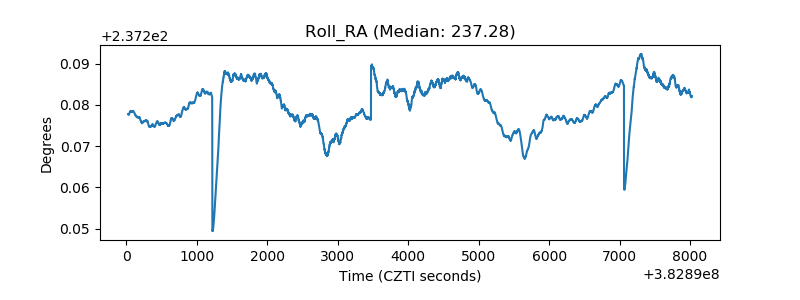 |
| Veto Counter | 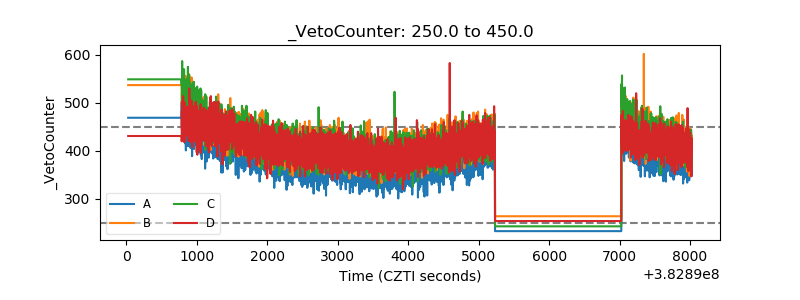 |