| Param | Original file | Final file |
|---|---|---|
| Filename | modeM0/AS1A05_167T01_9000004940_34569cztM0_level2.evt | modeM0/AS1A05_167T01_9000004940_34569cztM0_level2_quad_clean.evt |
| Size (bytes) | 476,945,280 | 48,568,320 |
| Size | 454.9 MB | 46.3 MB |
| Events in quadrant A | 2,695,919 | 278,276 |
| Events in quadrant B | 3,592,405 | 279,827 |
| Events in quadrant C | 2,904,119 | 282,437 |
| Events in quadrant D | 4,896,172 | 261,835 |
| Mode SS | |||
|---|---|---|---|
| Quadrant | BADHDUFLAG | Total packets | Discarded packets |
| A | 0 | 108 | 0 |
| B | 0 | 108 | 0 |
| C | 0 | 108 | 0 |
| D | 0 | 108 | 0 |
| Mode M9 | |||
|---|---|---|---|
| Quadrant | BADHDUFLAG | Total packets | Discarded packets |
| A | 0 | 24 | 0 |
| B | 0 | 24 | 0 |
| C | 0 | 24 | 0 |
| D | 0 | 25 | 0 |
| Mode M0 | |||
|---|---|---|---|
| Quadrant | BADHDUFLAG | Total packets | Discarded packets |
| A | 0 | 11112 | 3 |
| B | 0 | 13981 | 2 |
| C | 0 | 11381 | 2 |
| D | 0 | 18382 | 2 |
| Quadrant | Total seconds | Saturated seconds | Saturation percentage |
|---|---|---|---|
| A | 5246 | 29 | 0.552802% |
| B | 5246 | 223 | 4.250858% |
| C | 5246 | 61 | 1.162791% |
| D | 5246 | 211 | 4.022112% |
Noise dominated data is calculated using 1-second bins in cleaned event files. If a bin has >2000 counts, and if more than 50% of those come from <1% of pixels, then it is considered to be noise-dominated and hence unusable.
| Quadrant | # 1 sec bins | Bins with >0 counts | Bins with >2000 counts | High rate bins dominated by noise | Noise dominated (total time) | Noise dominated (detector-on time) | Marked lightcurve |
|---|---|---|---|---|---|---|---|
| A | 7338 | 5247 | 10 | 10 | 0.14% | 0.19% | 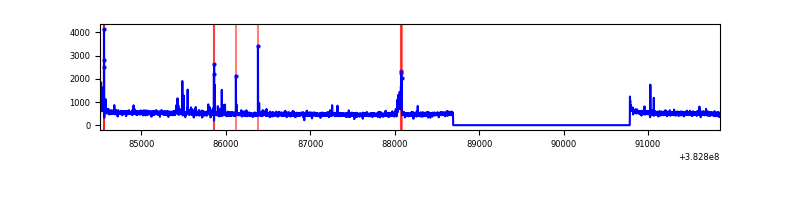 |
| B | 7338 | 5247 | 145 | 145 | 1.98% | 2.76% | 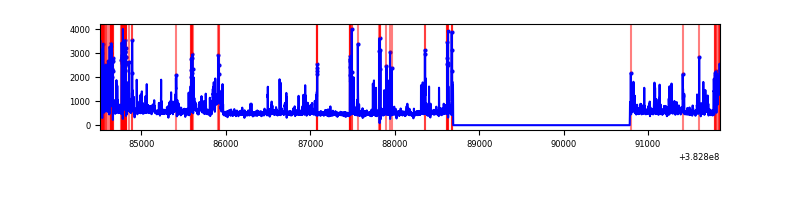 |
| C | 7338 | 5247 | 50 | 50 | 0.68% | 0.95% | 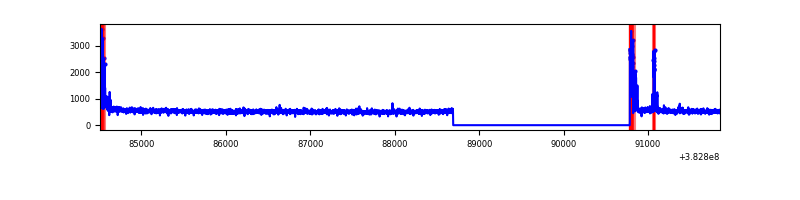 |
| D | 7338 | 5247 | 173 | 173 | 2.36% | 3.30% | 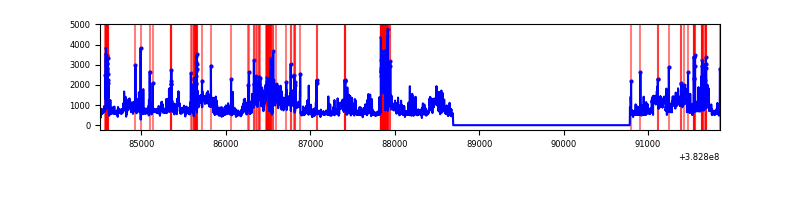 |
Top three noisy pixels from each quadrant. If the there are fewer than three noisy pixels in the level2.evt file, extra rows are filled as -1
| Pixel properties | Quadrant properties | ||||||
|---|---|---|---|---|---|---|---|
| Quadrant | DetID | PixID | Counts | Sigma | Mean | Median | Sigma |
| A | 15 | 169 | 90998 | 688.16 | 654 | 640 | 131.3 |
| A | 10 | 83 | 41222 | 309.07 | 654 | 640 | 131.3 |
| A | 7 | 16 | 11069 | 79.42 | 654 | 640 | 131.3 |
| B | 5 | 172 | 523912 | 4294.57 | 637 | 621 | 121.8 |
| B | 5 | 255 | 292329 | 2394.01 | 637 | 621 | 121.8 |
| B | 15 | 35 | 128550 | 1049.9 | 637 | 621 | 121.8 |
| C | 15 | 214 | 221939 | 1509.43 | 633 | 637 | 146.6 |
| C | 0 | 10 | 171171 | 1163.16 | 633 | 637 | 146.6 |
| C | 15 | 159 | 33686 | 225.42 | 633 | 637 | 146.6 |
| D | 8 | 195 | 1481711 | 9709.21 | 628 | 610 | 152.5 |
| D | 7 | 223 | 239386 | 1565.27 | 628 | 610 | 152.5 |
| D | 13 | 249 | 178741 | 1167.72 | 628 | 610 | 152.5 |
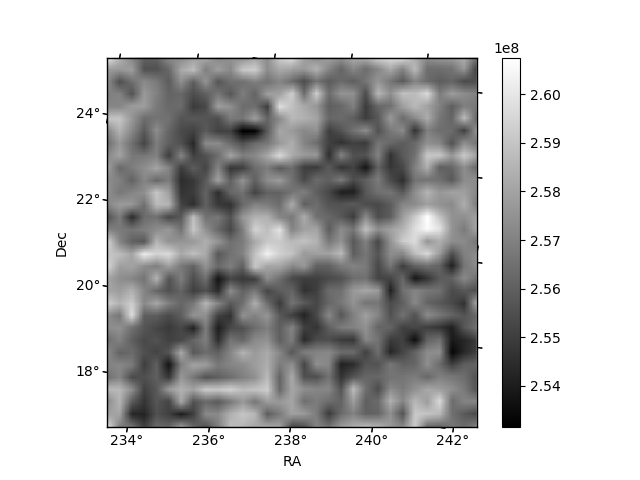
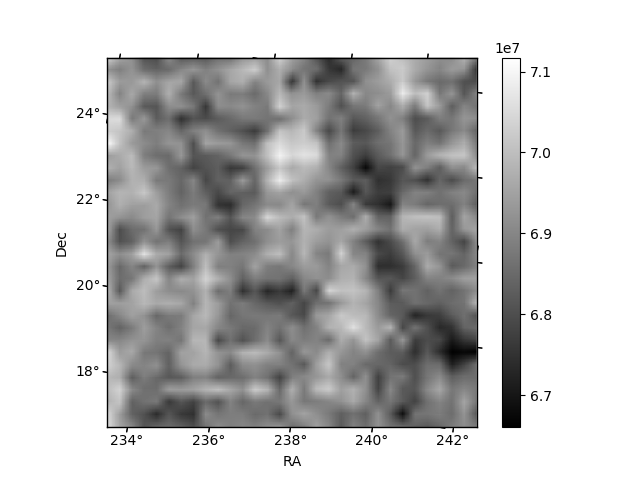
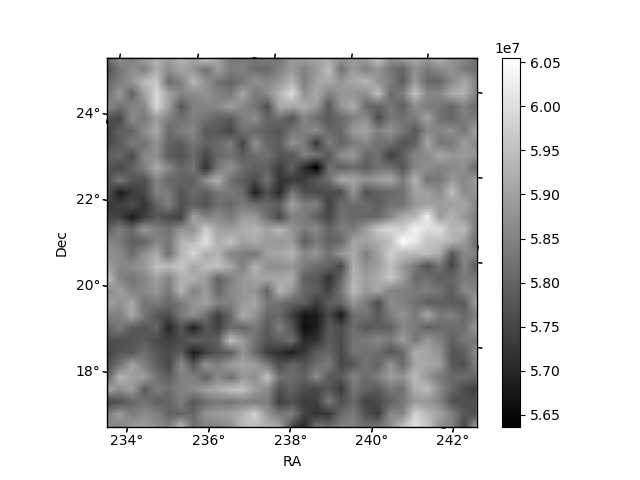
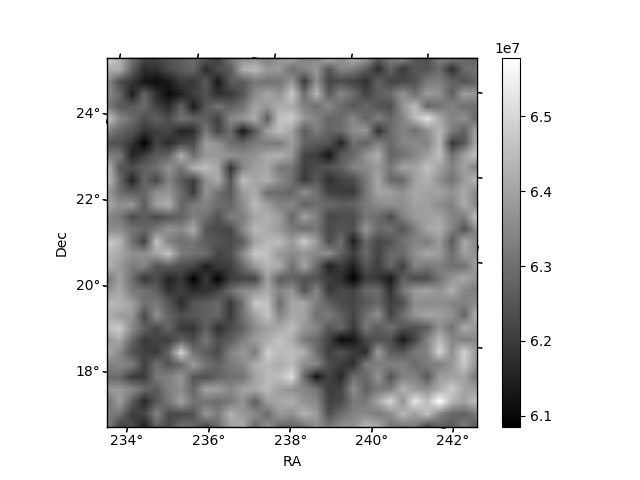
Histogram calculated using DETX and DETY for each event in the final _common_clean file
| Quadrant A | 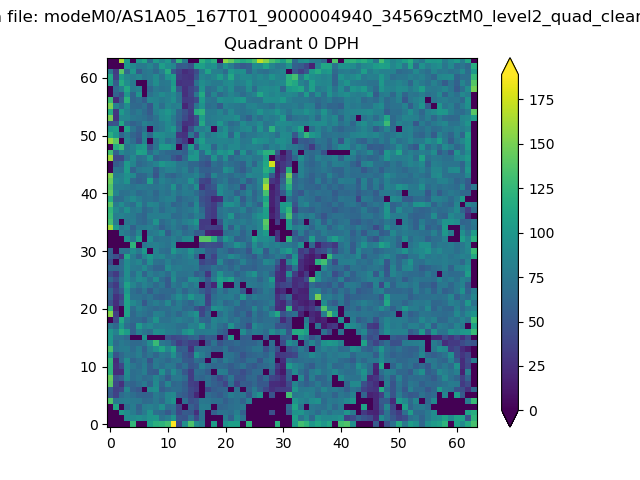 |
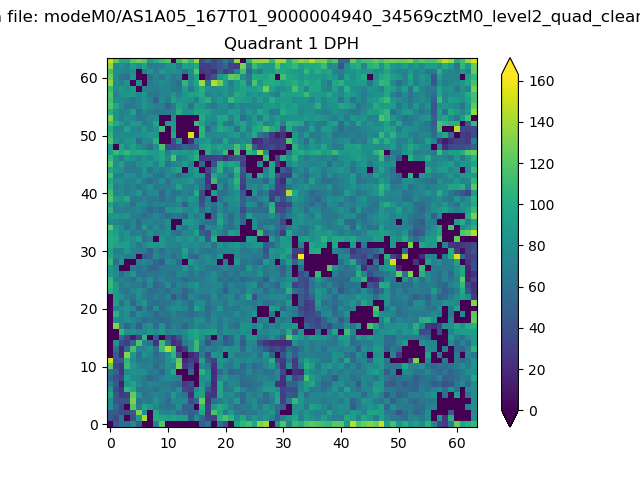 |
Quadrant B |
|---|---|---|---|
| Quadrant D | 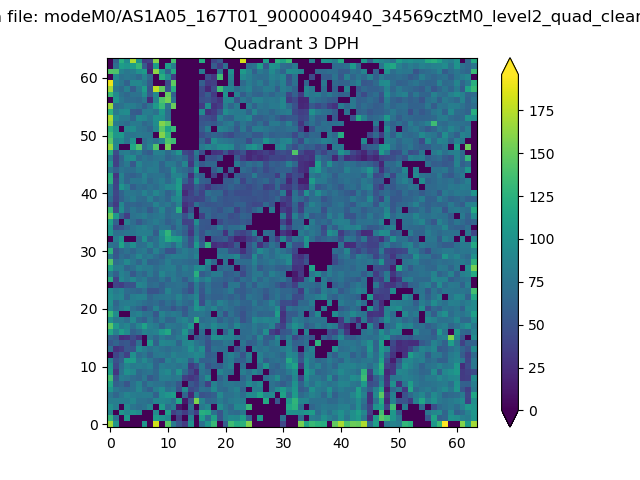 |
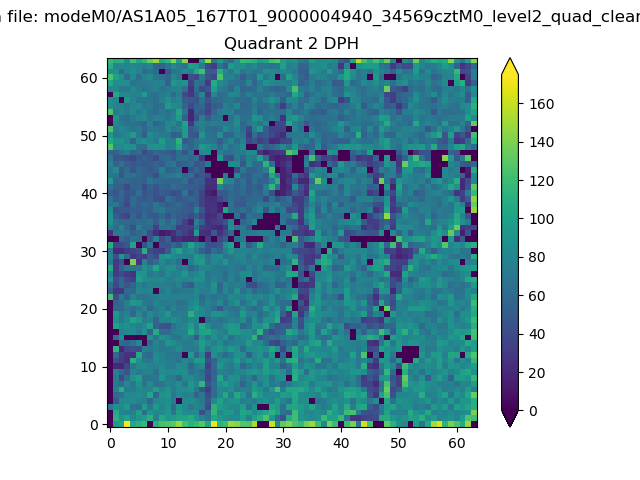 |
Quadrant C |
| Plot type | Count rate plots | Images |
|---|---|---|
| Comparison with Poisson distribution Blue bars denote a histogram of data divided into 1 sec bins. Red curve is a Poisson curve with rate = median count rate of data. |
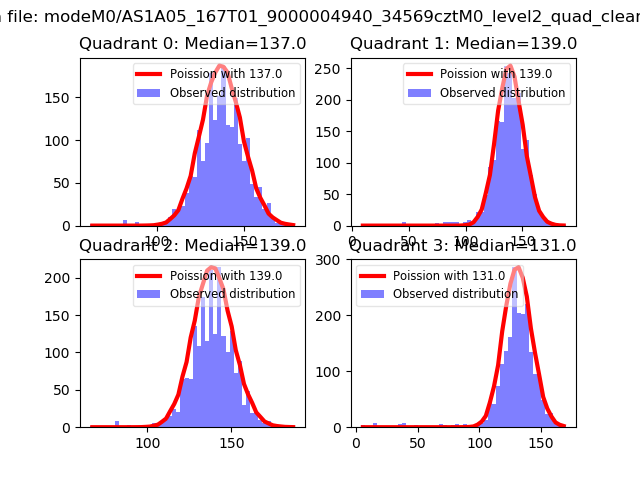 |
 |
| Quadrant-wise count rates Data is divided into 100 sec bins |
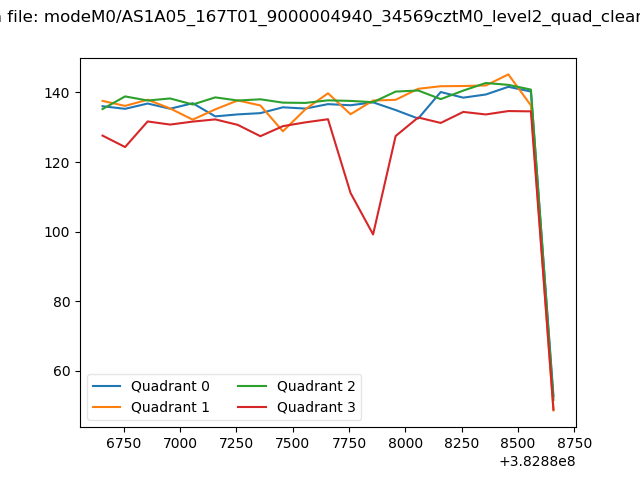 |
|
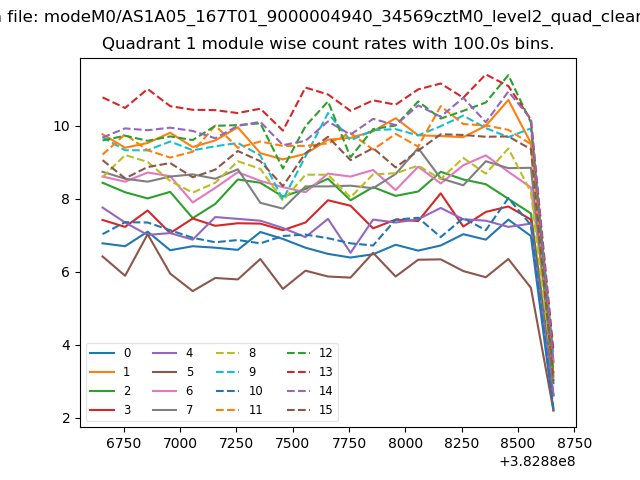
| Module-wise count rates for Quadrant A Data is divided into 100 sec bins |
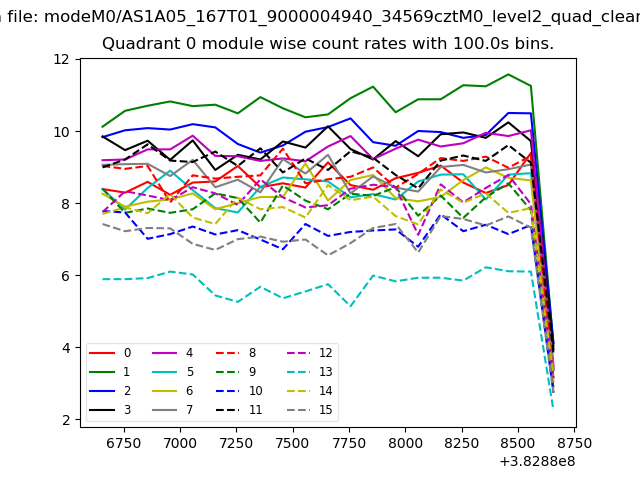 |
 |
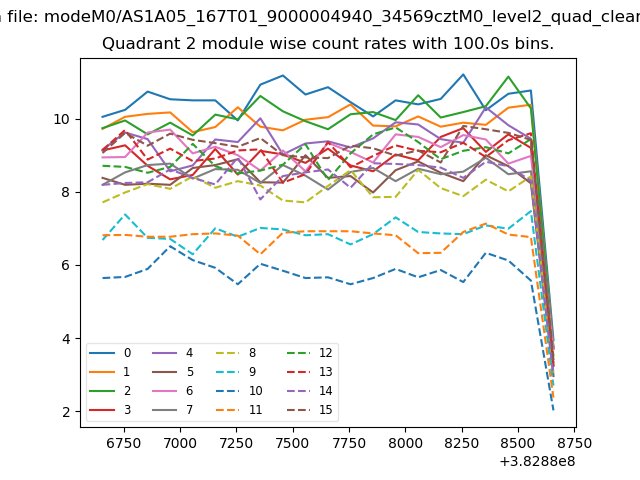
| Module-wise count rates for Quadrant B Data is divided into 100 sec bins |
 |
 |
| Module-wise count rates for Quadrant C Data is divided into 100 sec bins |
 |
 |
| Module-wise count rates for Quadrant D Data is divided into 100 sec bins |
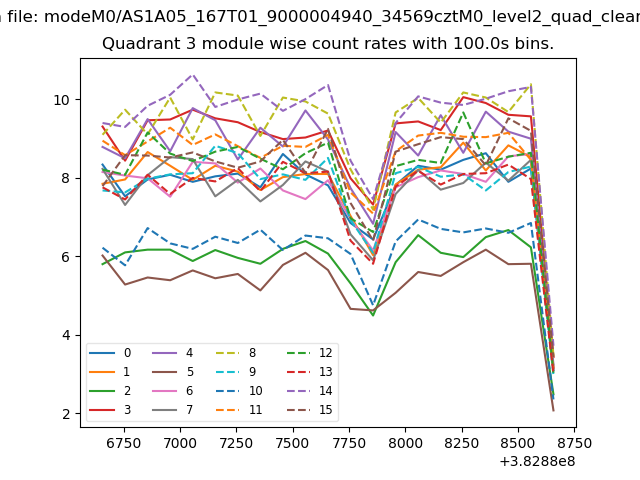 |
 |
| Parameter | Plot |
|---|---|
| CZT HV Monitor | 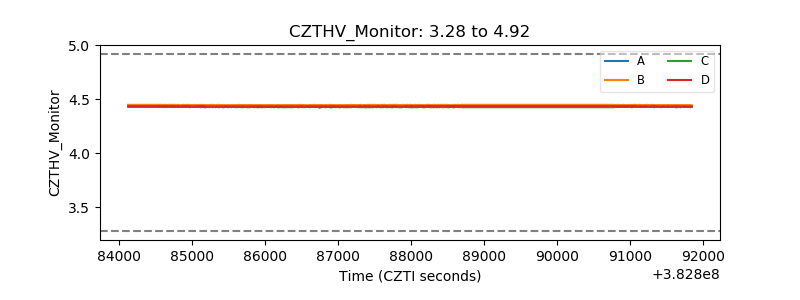 |
| D_VDD | 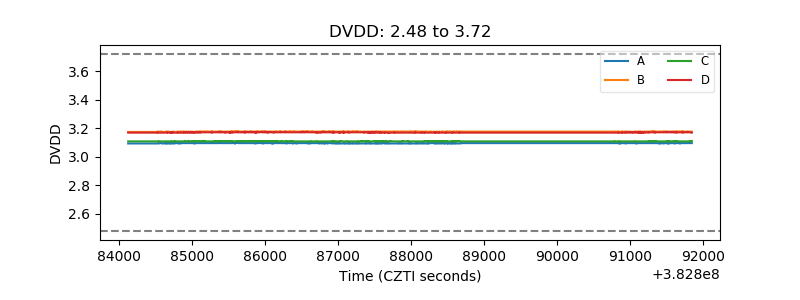 |
| Temperature 1 | 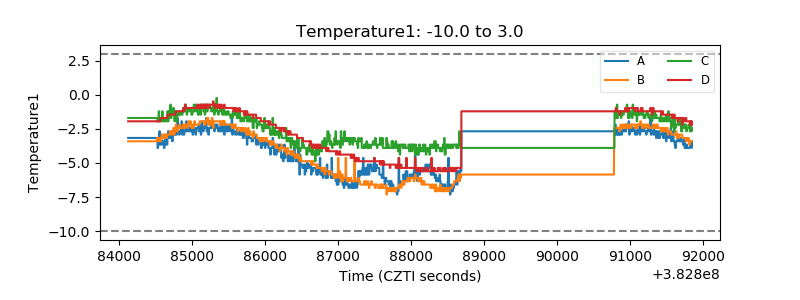 |
| Veto HV Monitor | 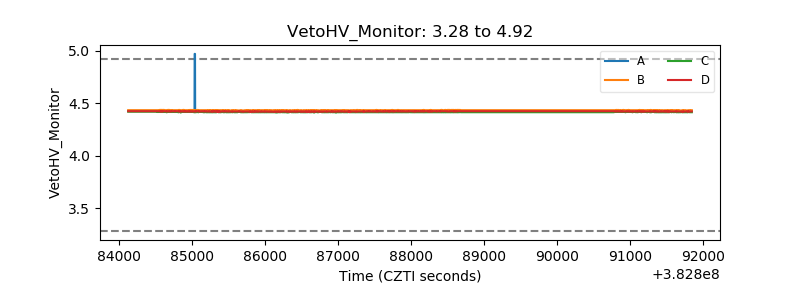 |
| Veto LLD | 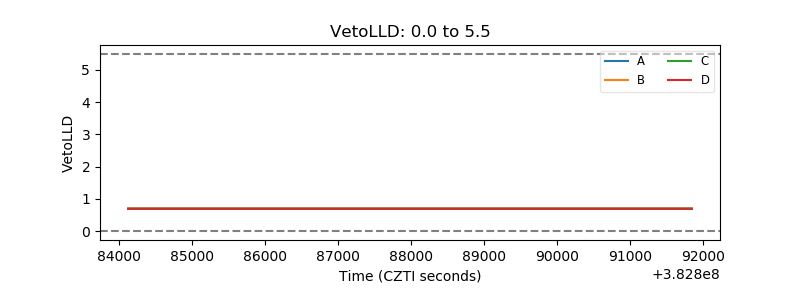 |
| Alpha Counter | 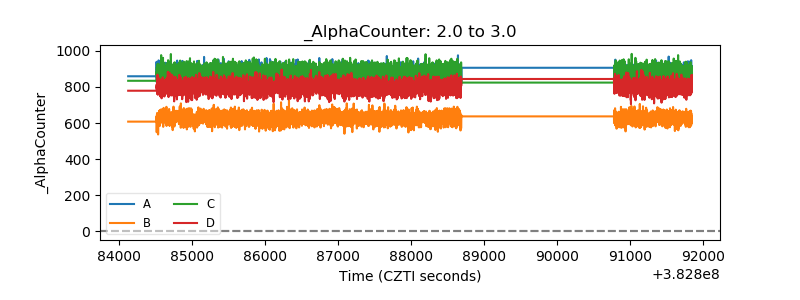 |
| _CPM_Rate | 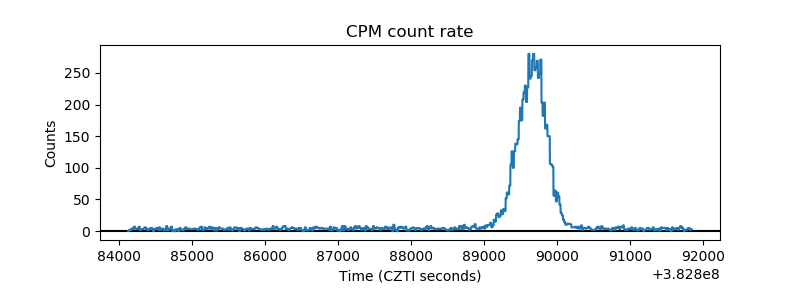 |
| CZT Counter | 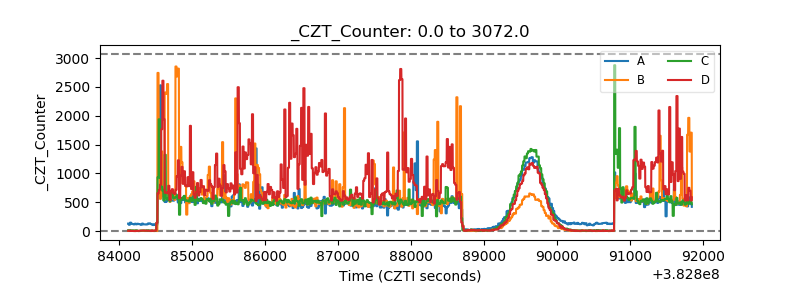 |
| +2.5 Volts monitor | 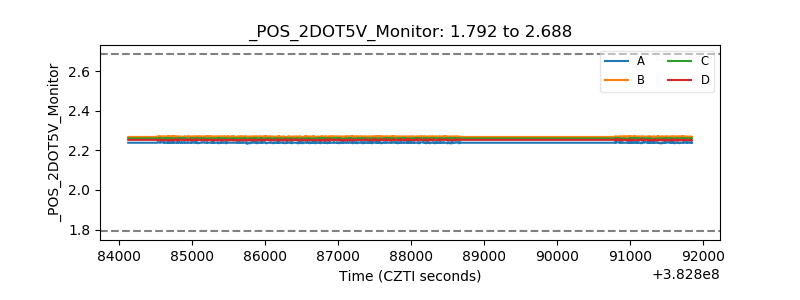 |
| +5 Volts monitor | 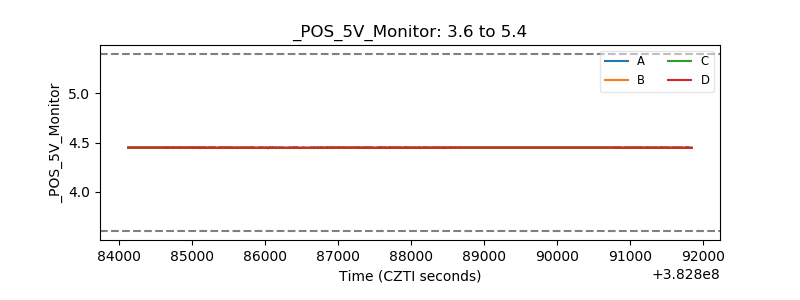 |
| _ROLL_ROT | 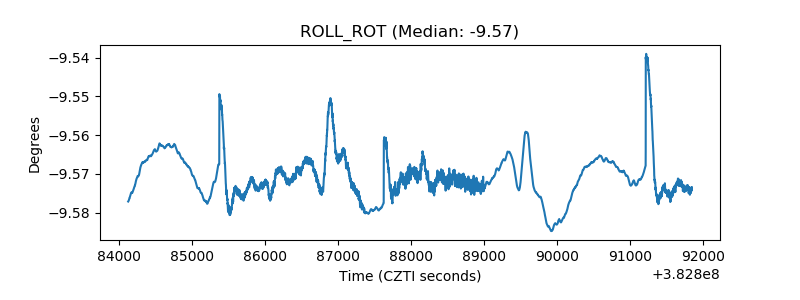 |
| _Roll_DEC | 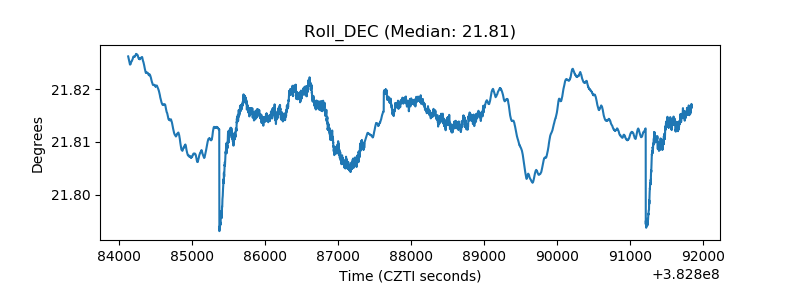 |
| _Roll_RA |  |
| Veto Counter | 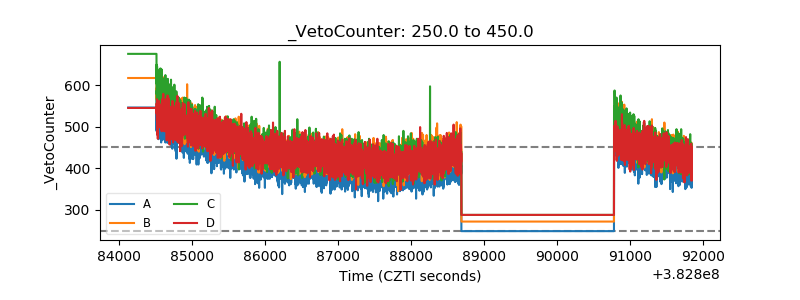 |