| Param | Original file | Final file |
|---|---|---|
| Filename | modeM0/AS1A05_167T01_9000004940_34567cztM0_level2.evt | modeM0/AS1A05_167T01_9000004940_34567cztM0_level2_quad_clean.evt |
| Size (bytes) | 465,108,480 | 57,853,440 |
| Size | 443.6 MB | 55.2 MB |
| Events in quadrant A | 2,643,916 | 363,164 |
| Events in quadrant B | 3,178,602 | 363,649 |
| Events in quadrant C | 2,810,321 | 360,340 |
| Events in quadrant D | 5,114,063 | 313,657 |
| Mode SS | |||
|---|---|---|---|
| Quadrant | BADHDUFLAG | Total packets | Discarded packets |
| A | 0 | 100 | 0 |
| B | 0 | 100 | 0 |
| C | 0 | 100 | 0 |
| D | 0 | 100 | 0 |
| Mode M9 | |||
|---|---|---|---|
| Quadrant | BADHDUFLAG | Total packets | Discarded packets |
| A | 0 | 23 | 0 |
| B | 0 | 23 | 0 |
| C | 0 | 23 | 0 |
| D | 0 | 24 | 0 |
| Mode M0 | |||
|---|---|---|---|
| Quadrant | BADHDUFLAG | Total packets | Discarded packets |
| A | 0 | 10573 | 3 |
| B | 0 | 12404 | 2 |
| C | 0 | 10969 | 2 |
| D | 0 | 18902 | 2 |
| Quadrant | Total seconds | Saturated seconds | Saturation percentage |
|---|---|---|---|
| A | 5008 | 17 | 0.339457% |
| B | 5008 | 112 | 2.236422% |
| C | 5008 | 27 | 0.539137% |
| D | 5008 | 386 | 7.707668% |
Noise dominated data is calculated using 1-second bins in cleaned event files. If a bin has >2000 counts, and if more than 50% of those come from <1% of pixels, then it is considered to be noise-dominated and hence unusable.
| Quadrant | # 1 sec bins | Bins with >0 counts | Bins with >2000 counts | High rate bins dominated by noise | Noise dominated (total time) | Noise dominated (detector-on time) | Marked lightcurve |
|---|---|---|---|---|---|---|---|
| A | 7131 | 5009 | 8 | 8 | 0.11% | 0.16% | 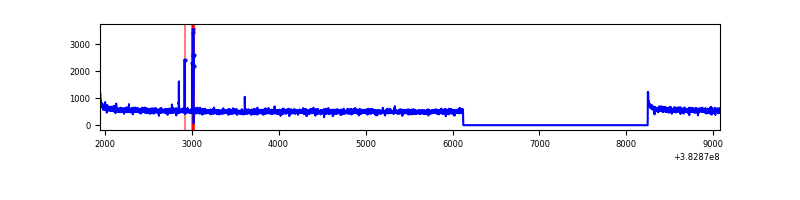 |
| B | 7131 | 5009 | 76 | 76 | 1.07% | 1.52% | 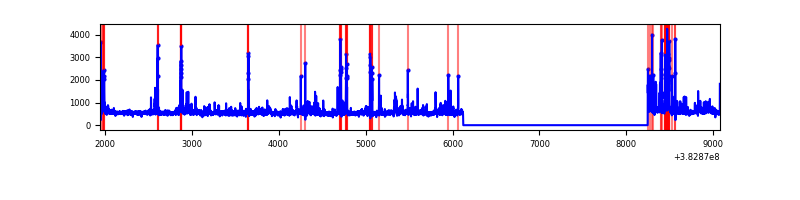 |
| C | 7131 | 5009 | 21 | 21 | 0.29% | 0.42% | 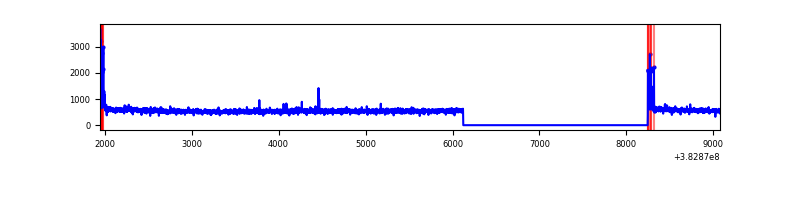 |
| D | 7131 | 5009 | 358 | 358 | 5.02% | 7.15% | 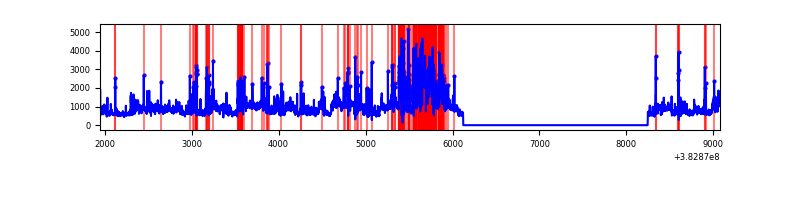 |
Top three noisy pixels from each quadrant. If the there are fewer than three noisy pixels in the level2.evt file, extra rows are filled as -1
| Pixel properties | Quadrant properties | ||||||
|---|---|---|---|---|---|---|---|
| Quadrant | DetID | PixID | Counts | Sigma | Mean | Median | Sigma |
| A | 10 | 83 | 41523 | 311.43 | 665 | 653 | 131.2 |
| A | 15 | 169 | 26575 | 197.53 | 665 | 653 | 131.2 |
| A | 13 | 254 | 9142 | 64.69 | 665 | 653 | 131.2 |
| B | 5 | 172 | 356700 | 2914.22 | 648 | 634 | 122.2 |
| B | 5 | 255 | 74123 | 601.47 | 648 | 634 | 122.2 |
| B | 0 | 229 | 55342 | 447.76 | 648 | 634 | 122.2 |
| C | 15 | 214 | 212428 | 1440.21 | 639 | 646 | 147.0 |
| C | 0 | 10 | 91472 | 617.65 | 639 | 646 | 147.0 |
| C | 15 | 159 | 11876 | 76.37 | 639 | 646 | 147.0 |
| D | 8 | 195 | 1320768 | 8648.36 | 623 | 605 | 152.6 |
| D | 7 | 80 | 939384 | 6149.92 | 623 | 605 | 152.6 |
| D | 2 | 250 | 76582 | 497.72 | 623 | 605 | 152.6 |
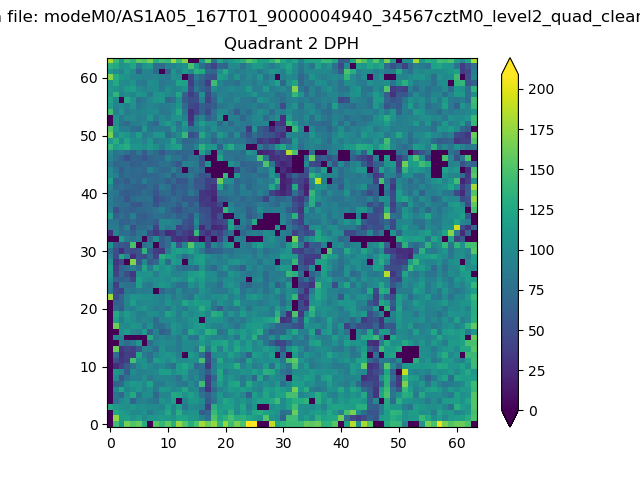
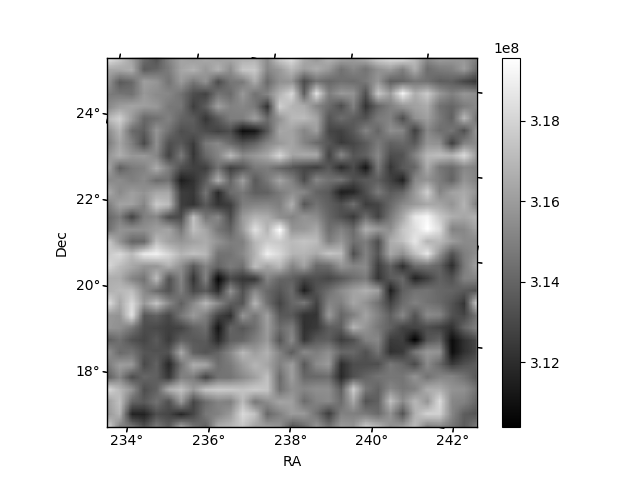
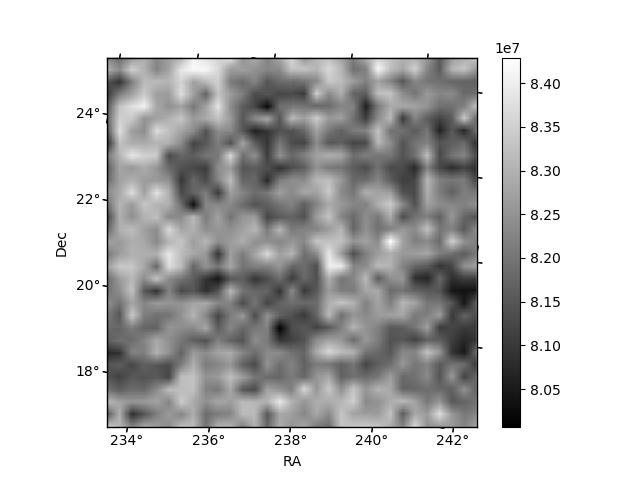
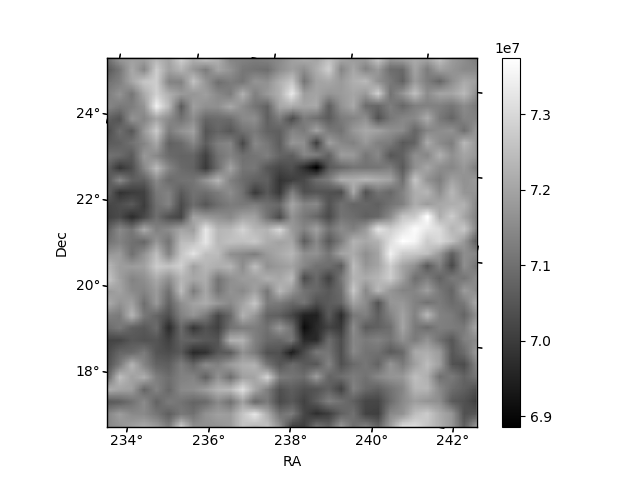
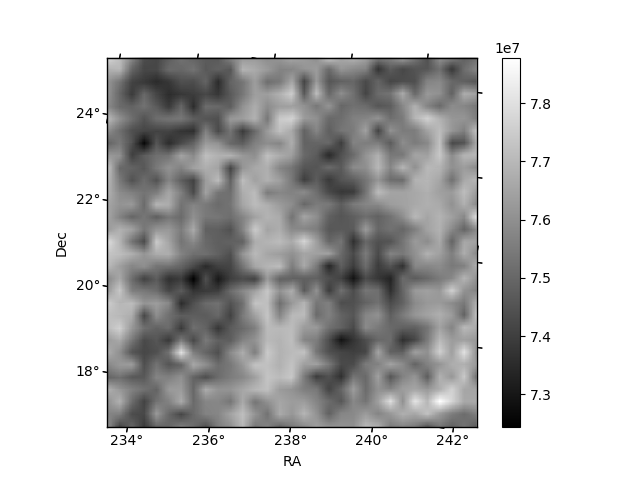
Histogram calculated using DETX and DETY for each event in the final _common_clean file
| Quadrant A | 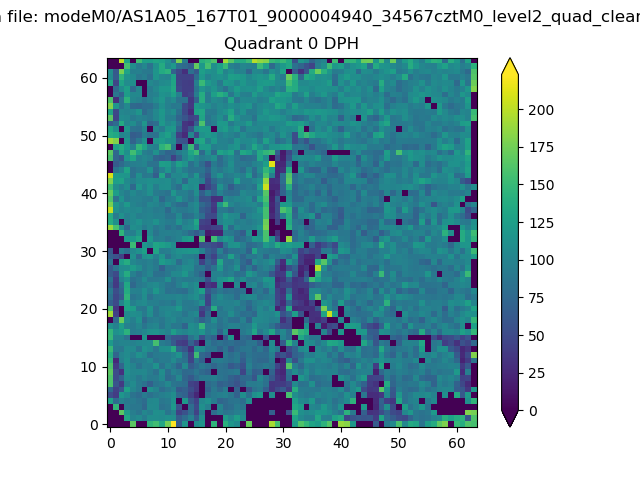 |
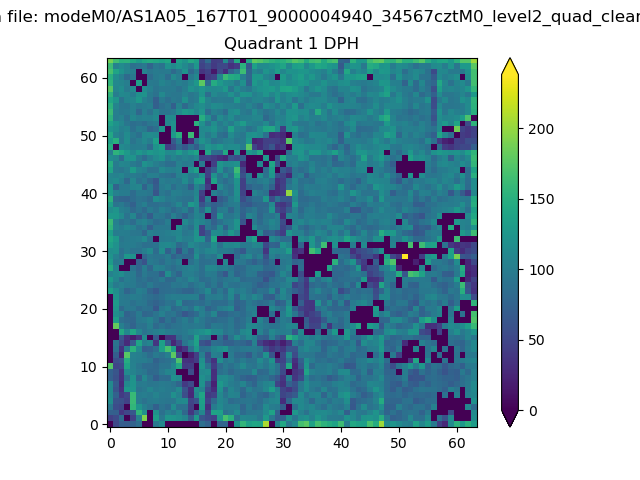 |
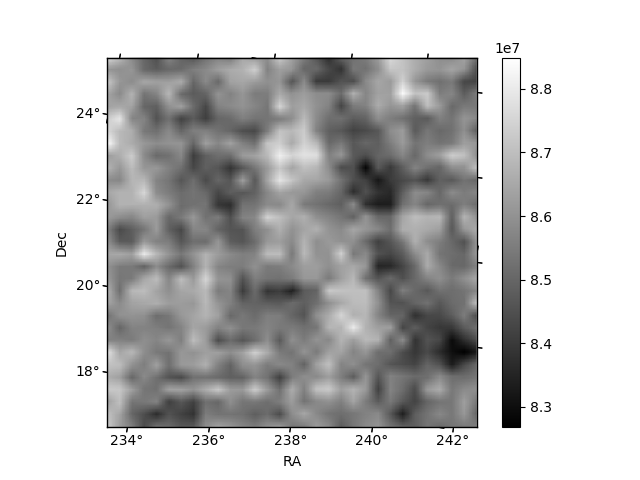
Quadrant B |
|---|---|---|---|
| Quadrant D | 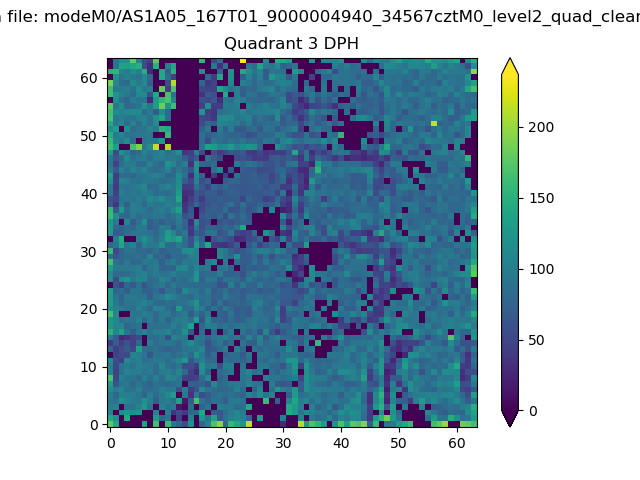 |
 |
Quadrant C |
| Plot type | Count rate plots | Images |
|---|---|---|
| Comparison with Poisson distribution Blue bars denote a histogram of data divided into 1 sec bins. Red curve is a Poisson curve with rate = median count rate of data. |
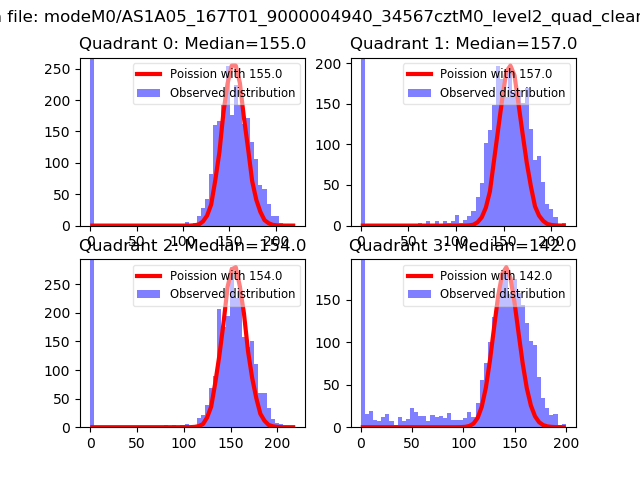 |
 |
| Quadrant-wise count rates Data is divided into 100 sec bins |
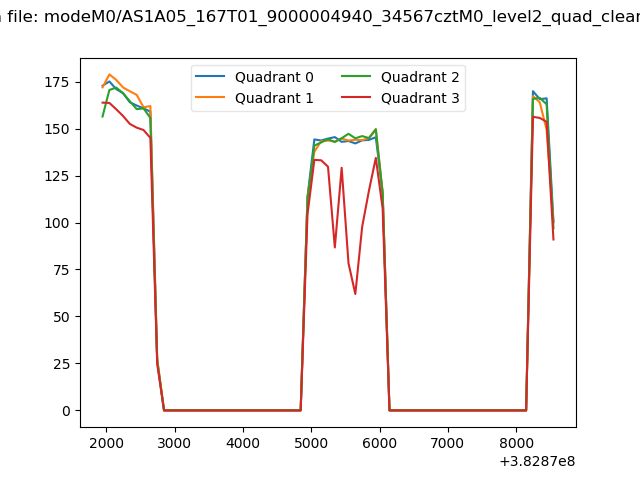 |
|
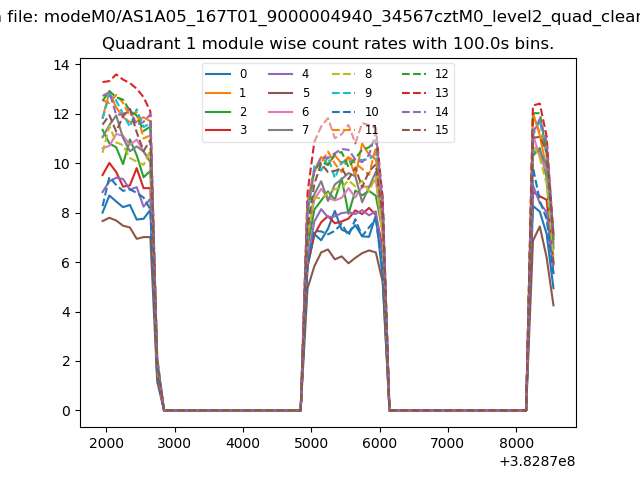
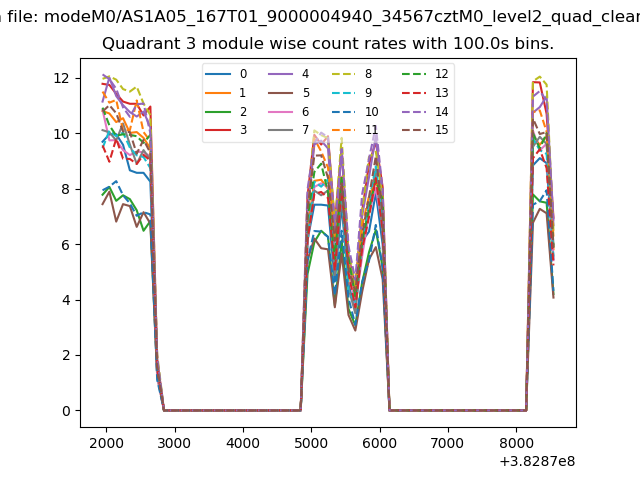
| Module-wise count rates for Quadrant A Data is divided into 100 sec bins |
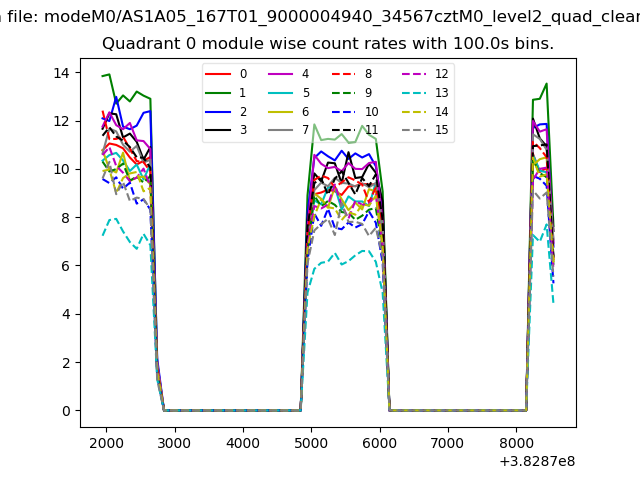 |
 |
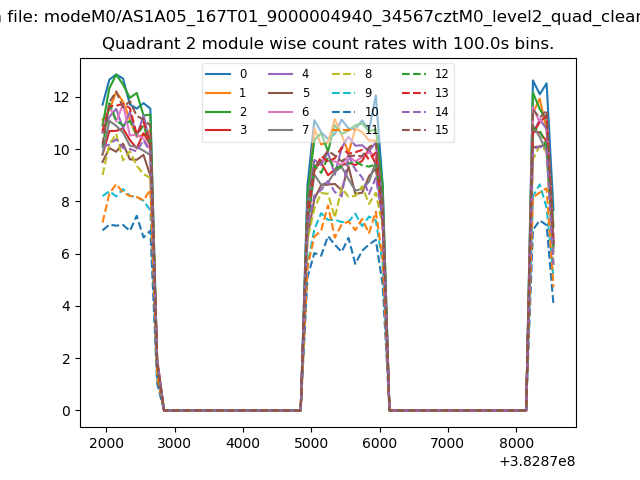
| Module-wise count rates for Quadrant B Data is divided into 100 sec bins |
 |
 |
| Module-wise count rates for Quadrant C Data is divided into 100 sec bins |
 |
 |
| Module-wise count rates for Quadrant D Data is divided into 100 sec bins |
 |
 |
| Parameter | Plot |
|---|---|
| CZT HV Monitor | 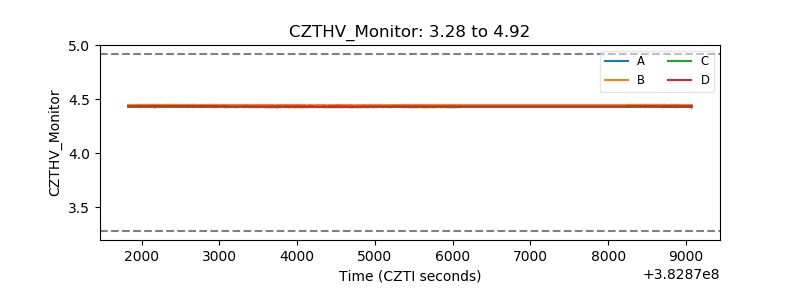 |
| D_VDD | 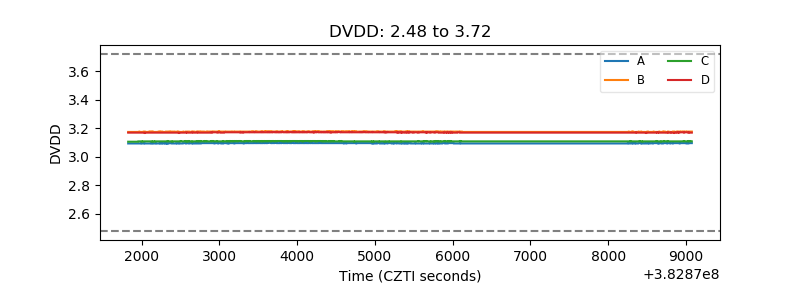 |
| Temperature 1 | 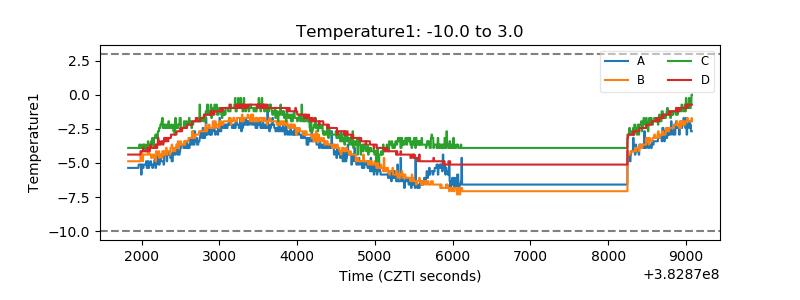 |
| Veto HV Monitor | 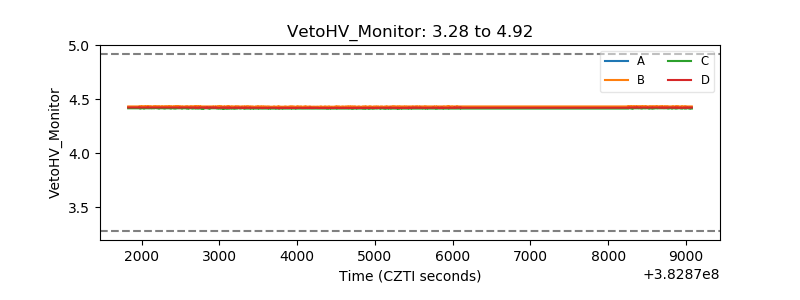 |
| Veto LLD | 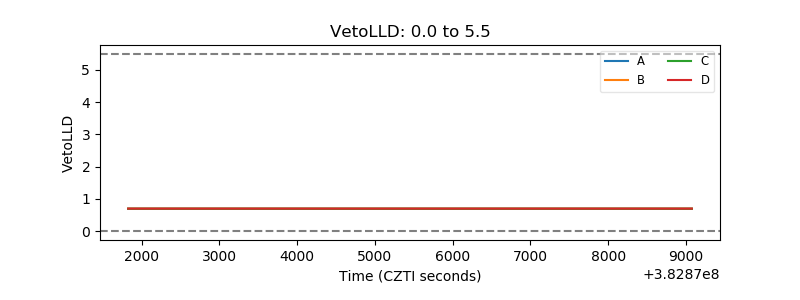 |
| Alpha Counter | 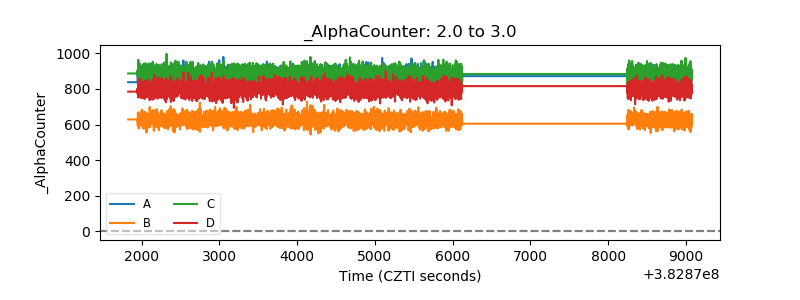 |
| _CPM_Rate | 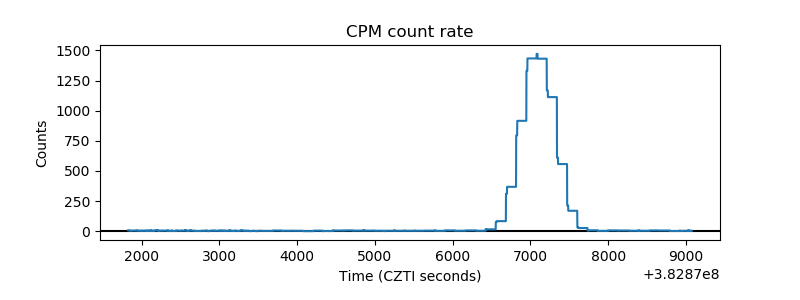 |
| CZT Counter | 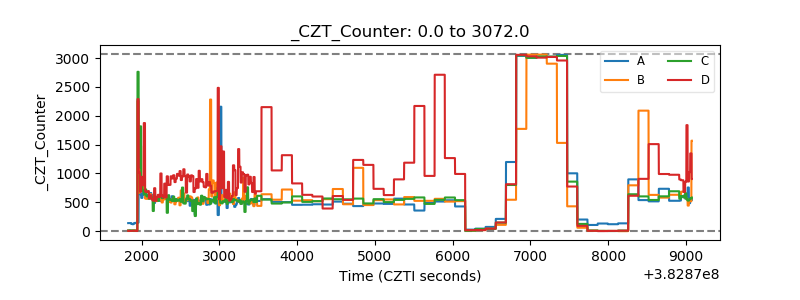 |
| +2.5 Volts monitor | 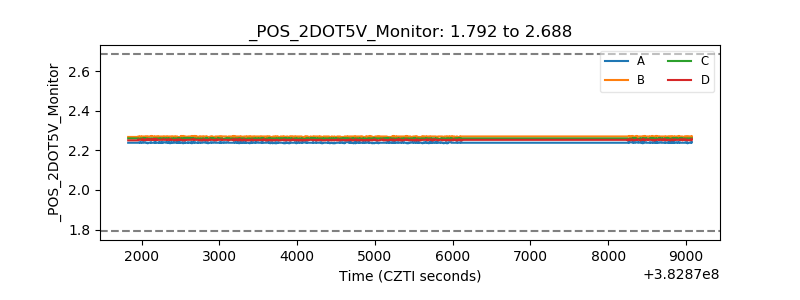 |
| +5 Volts monitor | 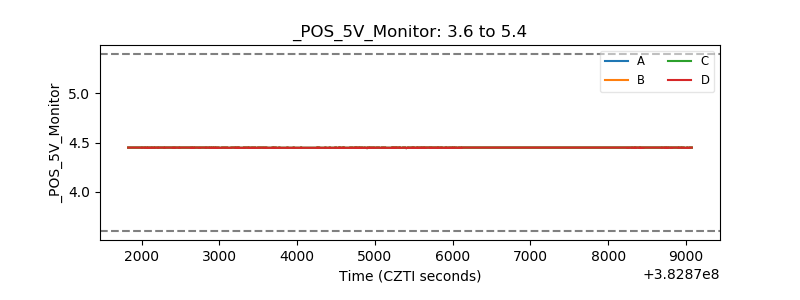 |
| _ROLL_ROT | 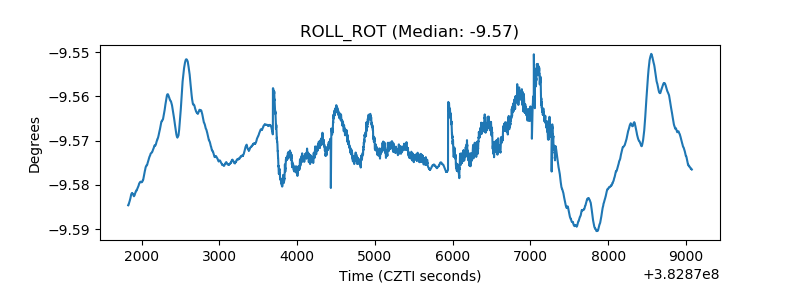 |
| _Roll_DEC | 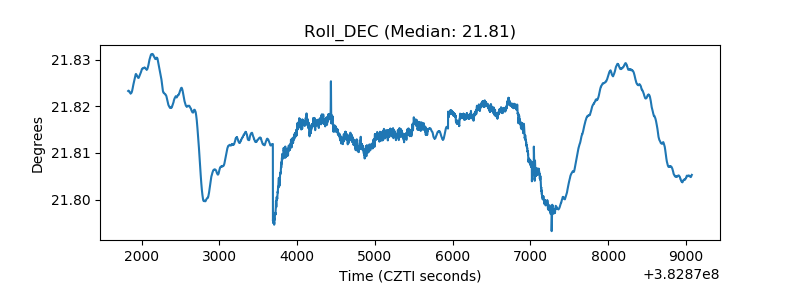 |
| _Roll_RA | 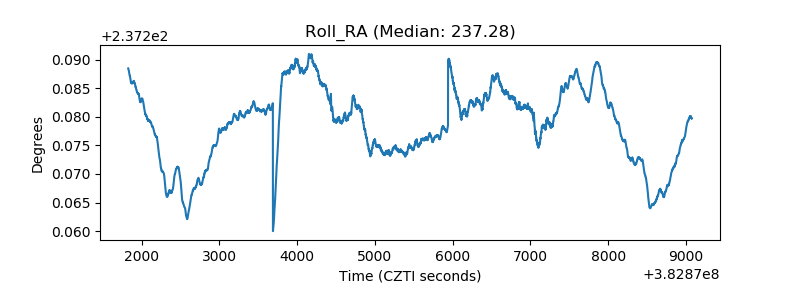 |
| Veto Counter | 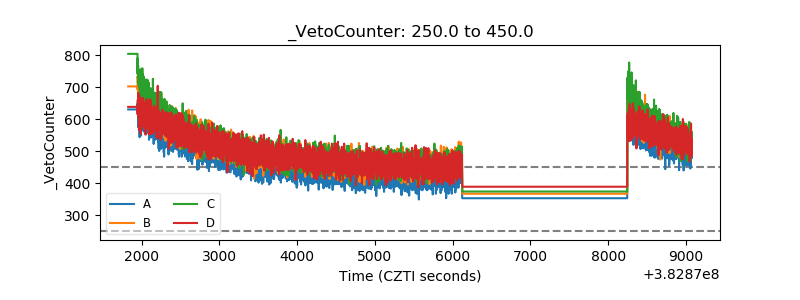 |