| Param | Original file | Final file |
|---|---|---|
| Filename | modeM0/AS1A05_167T01_9000004940_34565cztM0_level2.evt | modeM0/AS1A05_167T01_9000004940_34565cztM0_level2_quad_clean.evt |
| Size (bytes) | 474,796,800 | 70,338,240 |
| Size | 452.8 MB | 67.1 MB |
| Events in quadrant A | 2,639,203 | 451,222 |
| Events in quadrant B | 3,526,835 | 447,620 |
| Events in quadrant C | 2,805,996 | 451,074 |
| Events in quadrant D | 5,048,177 | 408,873 |
| Mode SS | |||
|---|---|---|---|
| Quadrant | BADHDUFLAG | Total packets | Discarded packets |
| A | 0 | 106 | 0 |
| B | 0 | 106 | 0 |
| C | 0 | 106 | 0 |
| D | 0 | 106 | 0 |
| Mode M9 | |||
|---|---|---|---|
| Quadrant | BADHDUFLAG | Total packets | Discarded packets |
| A | 0 | 27 | 0 |
| B | 0 | 27 | 0 |
| C | 0 | 27 | 0 |
| D | 0 | 28 | 0 |
| Mode M0 | |||
|---|---|---|---|
| Quadrant | BADHDUFLAG | Total packets | Discarded packets |
| A | 0 | 10919 | 3 |
| B | 0 | 13677 | 2 |
| C | 0 | 11140 | 2 |
| D | 0 | 18721 | 2 |
| Quadrant | Total seconds | Saturated seconds | Saturation percentage |
|---|---|---|---|
| A | 5302 | 11 | 0.207469% |
| B | 5302 | 267 | 5.035836% |
| C | 5302 | 30 | 0.565824% |
| D | 5302 | 432 | 8.147869% |
Noise dominated data is calculated using 1-second bins in cleaned event files. If a bin has >2000 counts, and if more than 50% of those come from <1% of pixels, then it is considered to be noise-dominated and hence unusable.
| Quadrant | # 1 sec bins | Bins with >0 counts | Bins with >2000 counts | High rate bins dominated by noise | Noise dominated (total time) | Noise dominated (detector-on time) | Marked lightcurve |
|---|---|---|---|---|---|---|---|
| A | 7185 | 5303 | 3 | 3 | 0.04% | 0.06% | 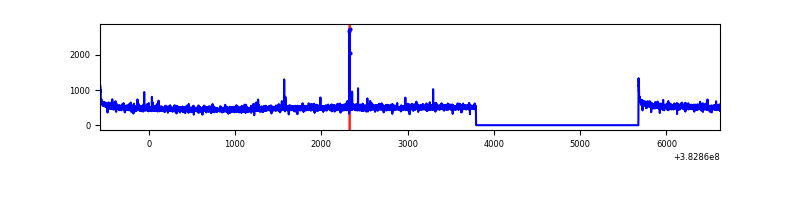 |
| B | 7185 | 5303 | 200 | 200 | 2.78% | 3.77% | 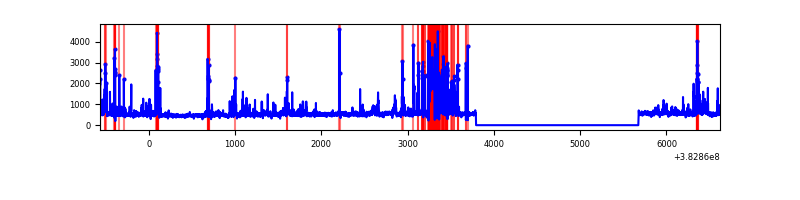 |
| C | 7185 | 5303 | 22 | 22 | 0.31% | 0.41% | 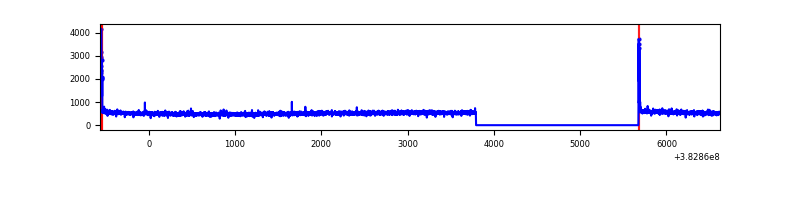 |
| D | 7185 | 5303 | 352 | 352 | 4.90% | 6.64% | 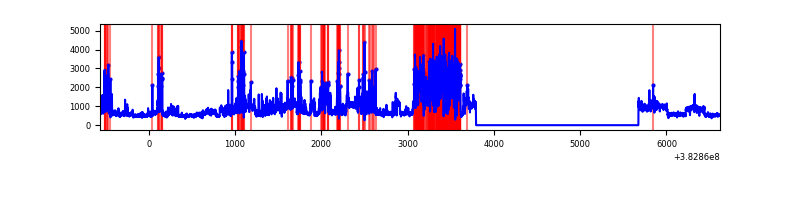 |
Top three noisy pixels from each quadrant. If the there are fewer than three noisy pixels in the level2.evt file, extra rows are filled as -1
| Pixel properties | Quadrant properties | ||||||
|---|---|---|---|---|---|---|---|
| Quadrant | DetID | PixID | Counts | Sigma | Mean | Median | Sigma |
| A | 10 | 83 | 41271 | 306.65 | 665 | 654 | 132.5 |
| A | 9 | 143 | 17933 | 130.45 | 665 | 654 | 132.5 |
| A | 13 | 254 | 9748 | 68.66 | 665 | 654 | 132.5 |
| B | 5 | 172 | 824146 | 6772.59 | 640 | 626 | 121.6 |
| B | 0 | 190 | 70763 | 576.8 | 640 | 626 | 121.6 |
| B | 0 | 189 | 59011 | 480.16 | 640 | 626 | 121.6 |
| C | 15 | 214 | 224325 | 1507.87 | 639 | 642 | 148.3 |
| C | 0 | 10 | 77179 | 515.94 | 639 | 642 | 148.3 |
| C | 14 | 67 | 11855 | 75.59 | 639 | 642 | 148.3 |
| D | 8 | 195 | 1232256 | 8070.32 | 624 | 608 | 152.6 |
| D | 2 | 207 | 603495 | 3950.39 | 624 | 608 | 152.6 |
| D | 7 | 80 | 526239 | 3444.17 | 624 | 608 | 152.6 |
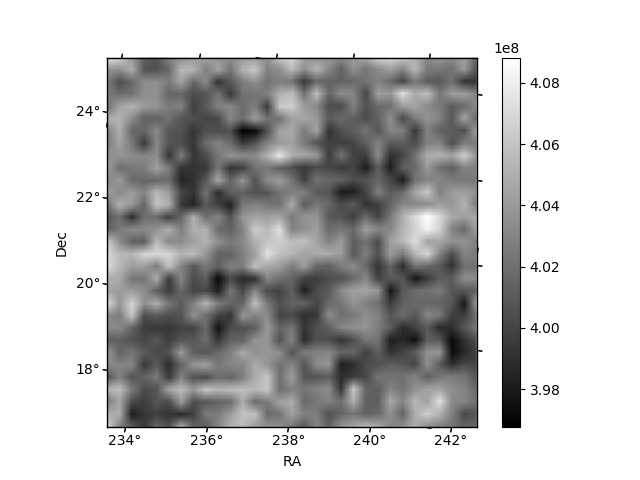
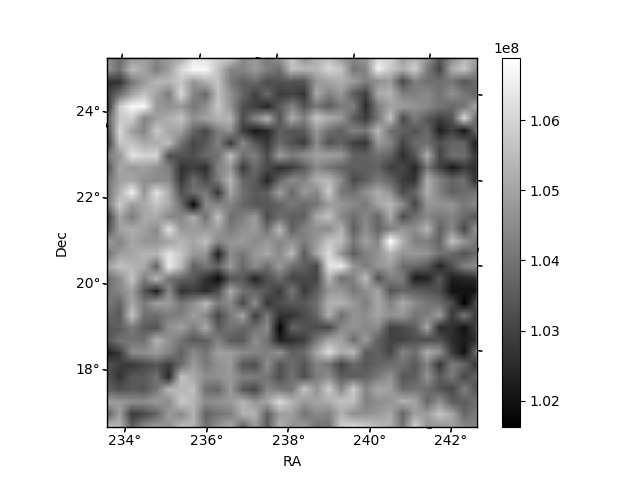
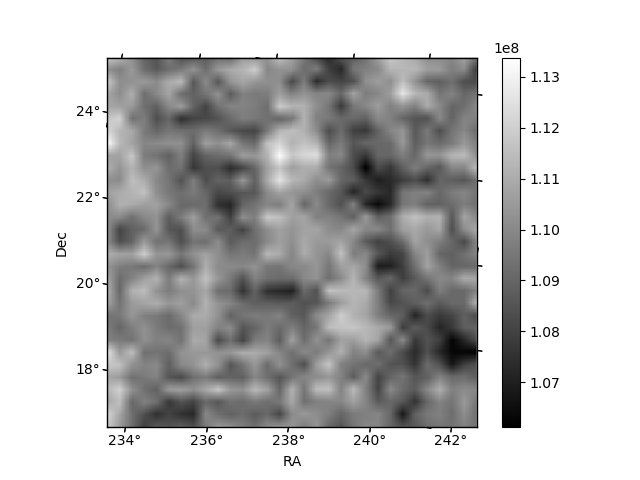
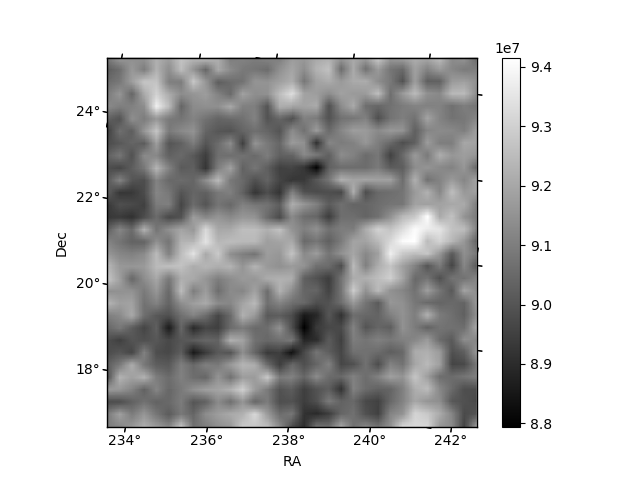
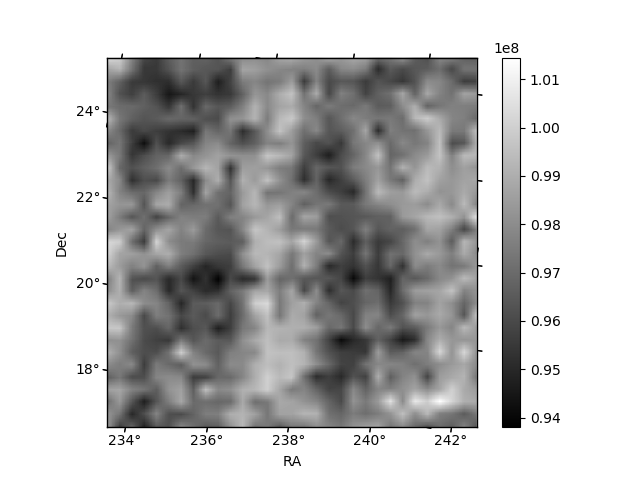
Histogram calculated using DETX and DETY for each event in the final _common_clean file
| Quadrant A | 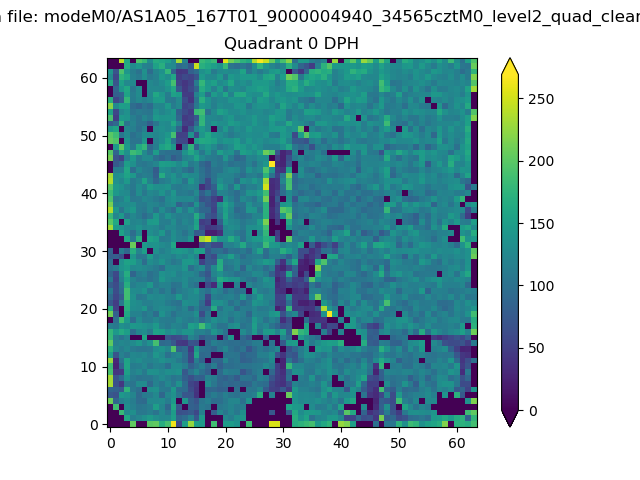 |
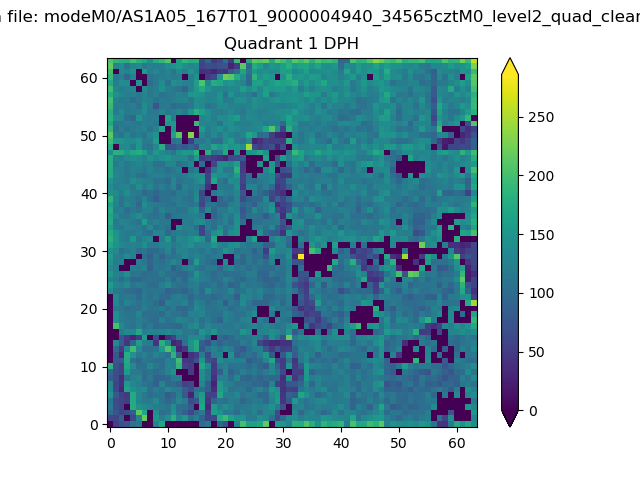 |
Quadrant B |
|---|---|---|---|
| Quadrant D | 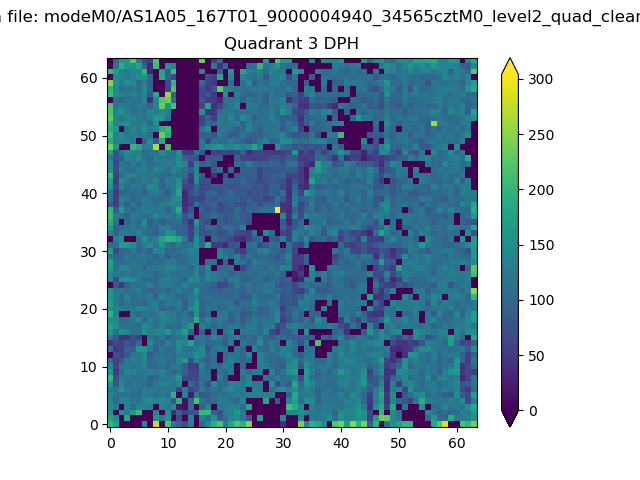 |
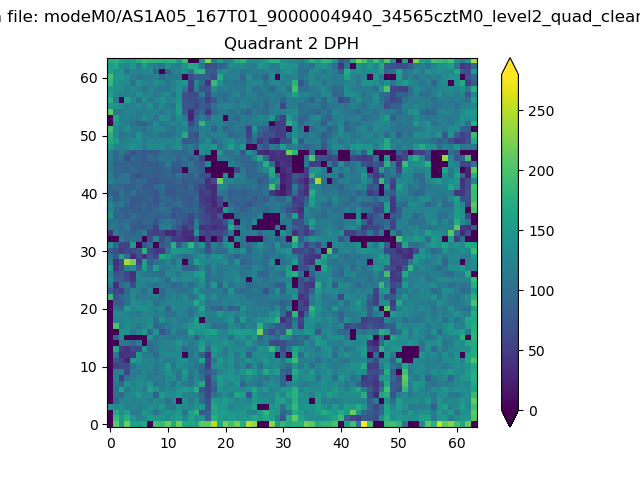 |
Quadrant C |
| Plot type | Count rate plots | Images |
|---|---|---|
| Comparison with Poisson distribution Blue bars denote a histogram of data divided into 1 sec bins. Red curve is a Poisson curve with rate = median count rate of data. |
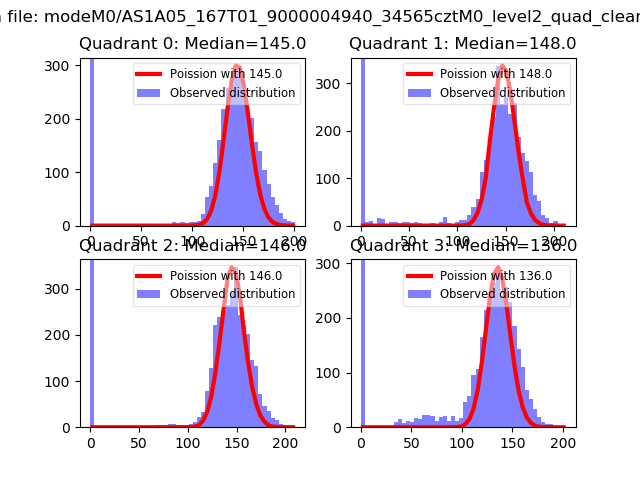 |
 |
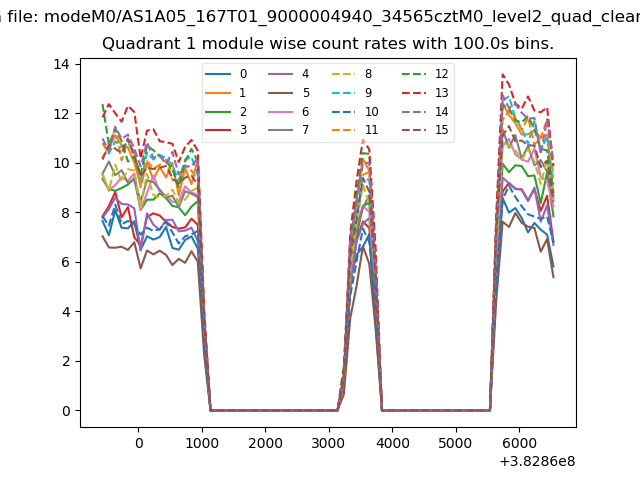
| Quadrant-wise count rates Data is divided into 100 sec bins |
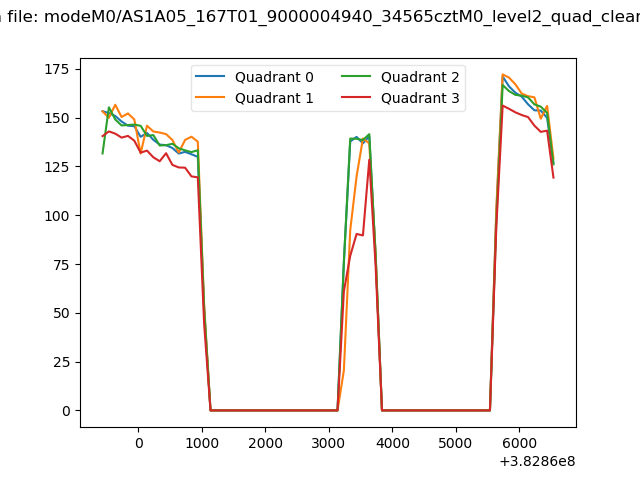 |
|
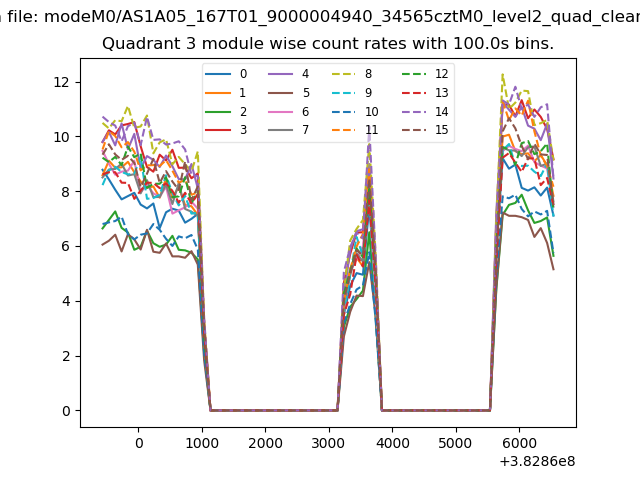
| Module-wise count rates for Quadrant A Data is divided into 100 sec bins |
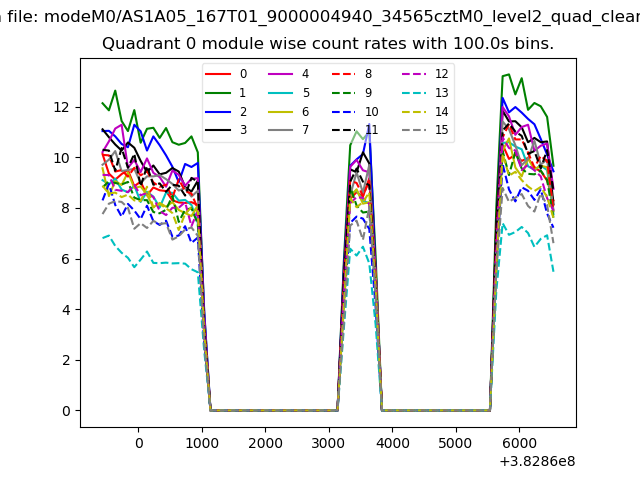 |
 |
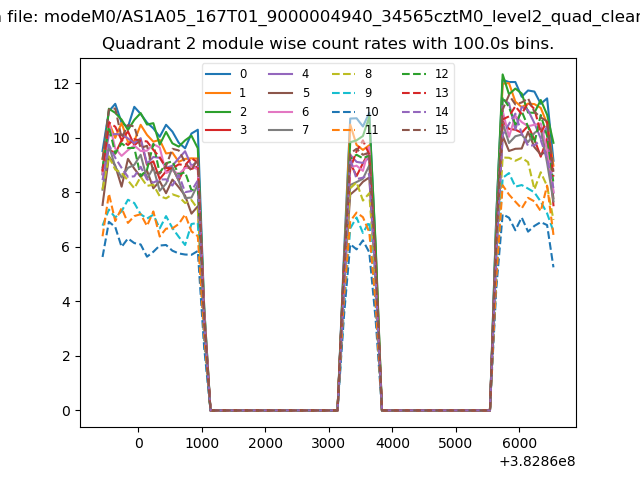
| Module-wise count rates for Quadrant B Data is divided into 100 sec bins |
 |
 |
| Module-wise count rates for Quadrant C Data is divided into 100 sec bins |
 |
 |
| Module-wise count rates for Quadrant D Data is divided into 100 sec bins |
 |
 |
| Parameter | Plot |
|---|---|
| CZT HV Monitor | 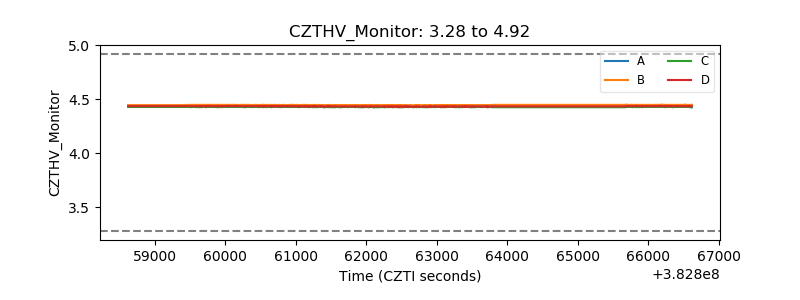 |
| D_VDD | 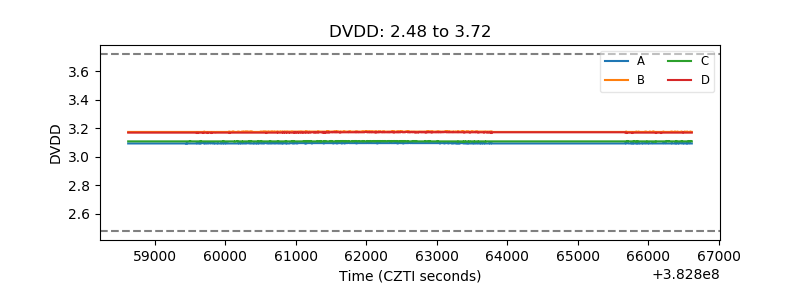 |
| Temperature 1 | 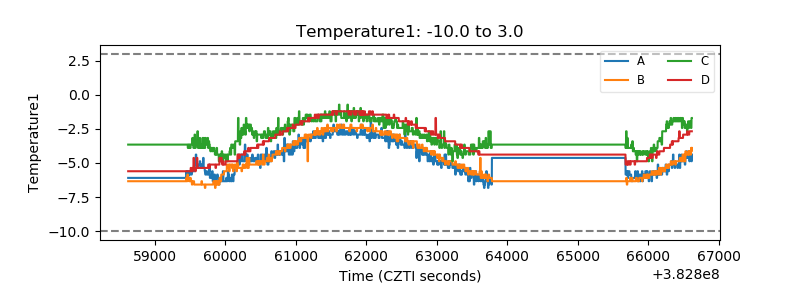 |
| Veto HV Monitor | 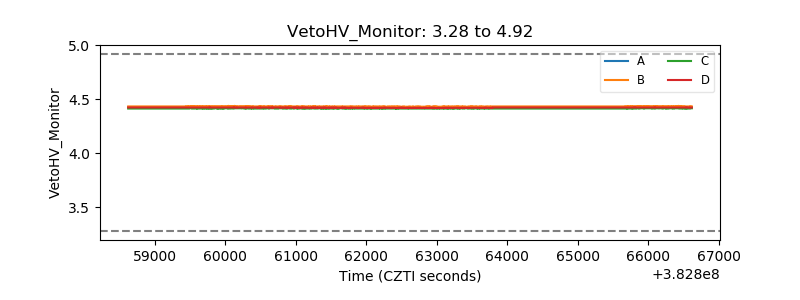 |
| Veto LLD | 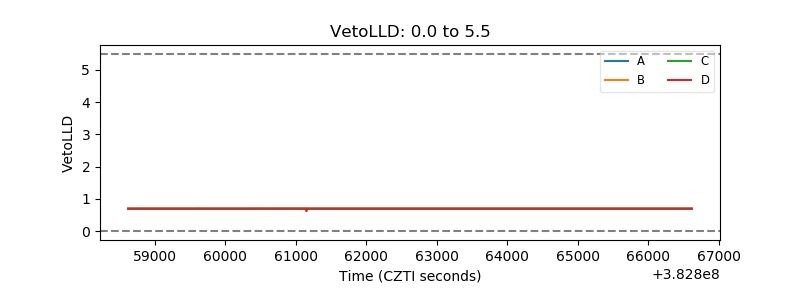 |
| Alpha Counter | 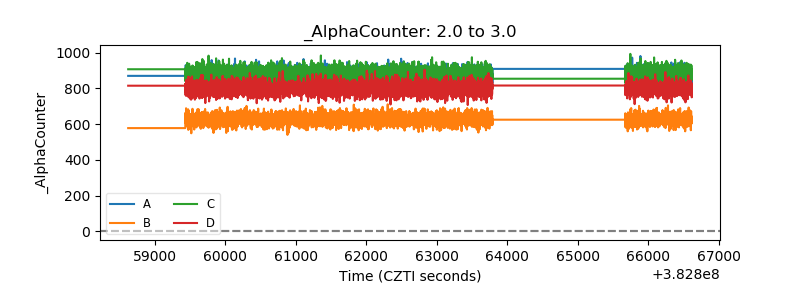 |
| _CPM_Rate | 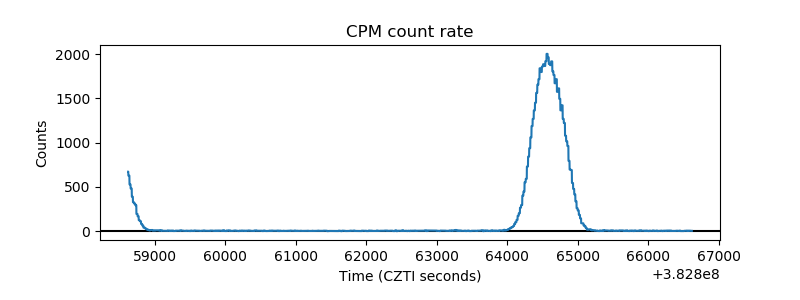 |
| CZT Counter | 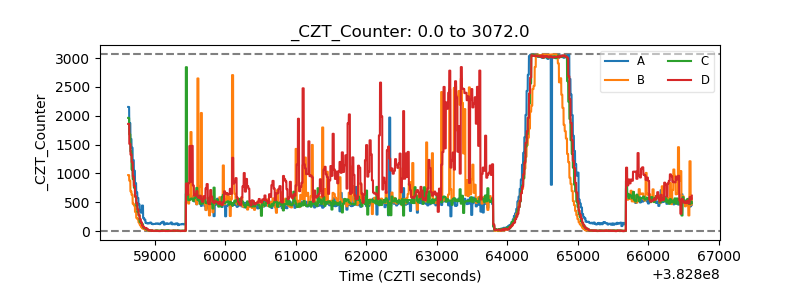 |
| +2.5 Volts monitor | 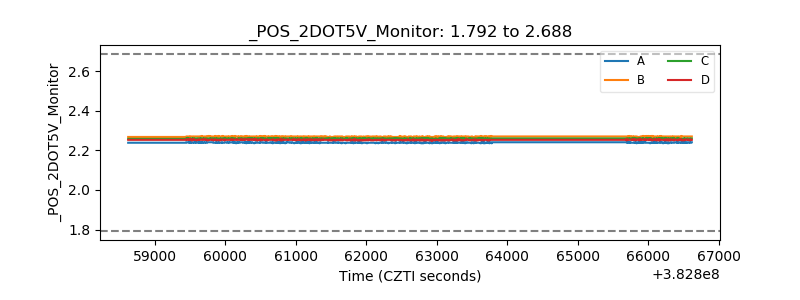 |
| +5 Volts monitor | 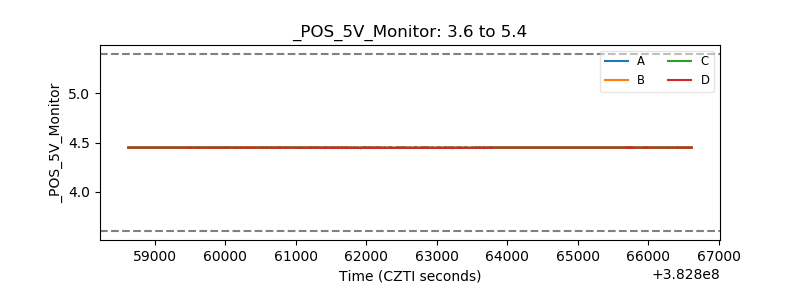 |
| _ROLL_ROT | 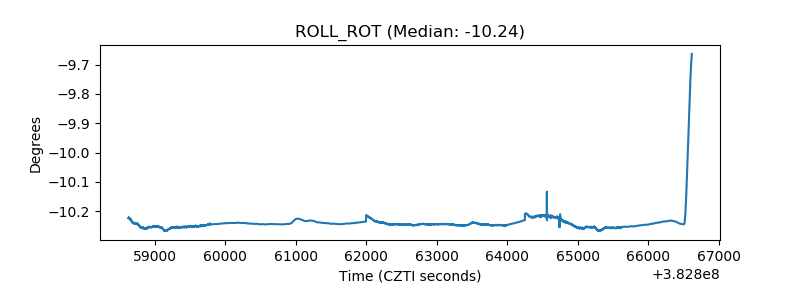 |
| _Roll_DEC | 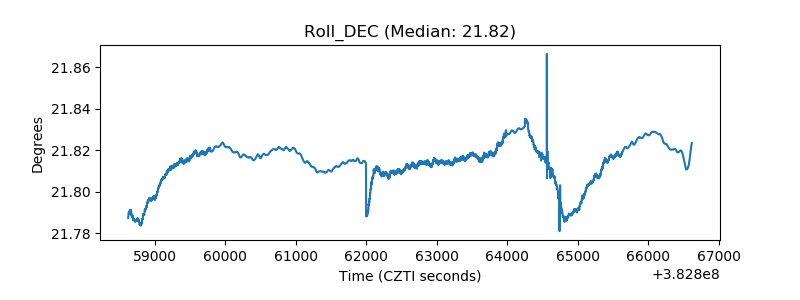 |
| _Roll_RA | 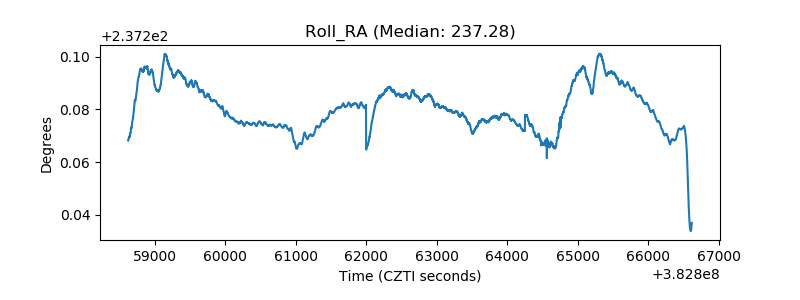 |
| Veto Counter | 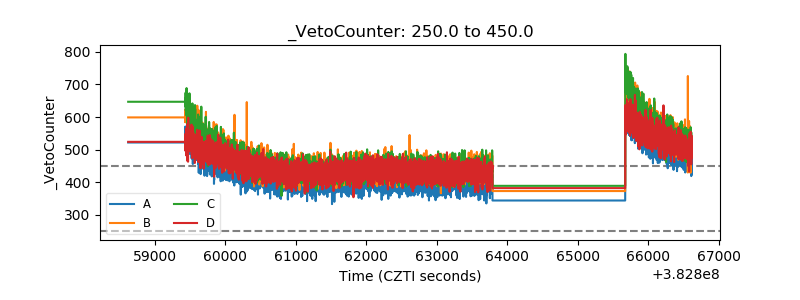 |