| Param | Original file | Final file |
|---|---|---|
| Filename | modeM0/AS1A05_167T01_9000004940_34564cztM0_level2.evt | modeM0/AS1A05_167T01_9000004940_34564cztM0_level2_quad_clean.evt |
| Size (bytes) | 467,786,880 | 70,361,280 |
| Size | 446.1 MB | 67.1 MB |
| Events in quadrant A | 2,629,005 | 441,747 |
| Events in quadrant B | 3,316,645 | 446,946 |
| Events in quadrant C | 2,808,248 | 442,861 |
| Events in quadrant D | 5,040,180 | 414,406 |
| Mode SS | |||
|---|---|---|---|
| Quadrant | BADHDUFLAG | Total packets | Discarded packets |
| A | 0 | 112 | 0 |
| B | 0 | 112 | 0 |
| C | 0 | 112 | 0 |
| D | 0 | 112 | 0 |
| Mode M9 | |||
|---|---|---|---|
| Quadrant | BADHDUFLAG | Total packets | Discarded packets |
| A | 0 | 30 | 0 |
| B | 0 | 30 | 0 |
| C | 0 | 30 | 0 |
| D | 0 | 31 | 0 |
| Mode M0 | |||
|---|---|---|---|
| Quadrant | BADHDUFLAG | Total packets | Discarded packets |
| A | 0 | 11265 | 3 |
| B | 0 | 13261 | 2 |
| C | 0 | 11462 | 2 |
| D | 0 | 18800 | 2 |
| Quadrant | Total seconds | Saturated seconds | Saturation percentage |
|---|---|---|---|
| A | 5493 | 12 | 0.218460% |
| B | 5493 | 166 | 3.022028% |
| C | 5493 | 30 | 0.546150% |
| D | 5493 | 385 | 7.008920% |
Noise dominated data is calculated using 1-second bins in cleaned event files. If a bin has >2000 counts, and if more than 50% of those come from <1% of pixels, then it is considered to be noise-dominated and hence unusable.
| Quadrant | # 1 sec bins | Bins with >0 counts | Bins with >2000 counts | High rate bins dominated by noise | Noise dominated (total time) | Noise dominated (detector-on time) | Marked lightcurve |
|---|---|---|---|---|---|---|---|
| A | 7286 | 5494 | 2 | 2 | 0.03% | 0.04% | 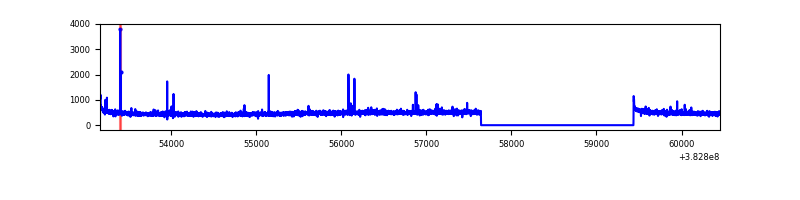 |
| B | 7286 | 5494 | 115 | 115 | 1.58% | 2.09% | 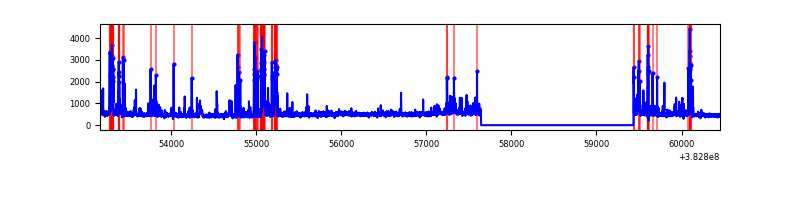 |
| C | 7286 | 5494 | 22 | 22 | 0.30% | 0.40% |  |
| D | 7286 | 5494 | 315 | 315 | 4.32% | 5.73% | 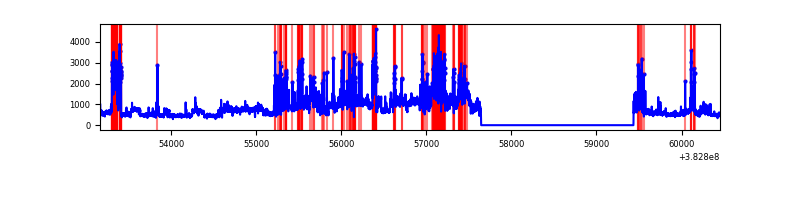 |
Top three noisy pixels from each quadrant. If the there are fewer than three noisy pixels in the level2.evt file, extra rows are filled as -1
| Pixel properties | Quadrant properties | ||||||
|---|---|---|---|---|---|---|---|
| Quadrant | DetID | PixID | Counts | Sigma | Mean | Median | Sigma |
| A | 10 | 83 | 41684 | 311.56 | 656 | 645 | 131.7 |
| A | 9 | 143 | 20267 | 148.97 | 656 | 645 | 131.7 |
| A | 15 | 169 | 15096 | 109.71 | 656 | 645 | 131.7 |
| B | 5 | 172 | 628835 | 5120.27 | 645 | 629 | 122.7 |
| B | 0 | 190 | 46815 | 376.44 | 645 | 629 | 122.7 |
| B | 4 | 232 | 23834 | 189.13 | 645 | 629 | 122.7 |
| C | 15 | 214 | 231826 | 1575.98 | 632 | 638 | 146.7 |
| C | 0 | 10 | 87749 | 593.82 | 632 | 638 | 146.7 |
| C | 14 | 67 | 19577 | 129.1 | 632 | 638 | 146.7 |
| D | 8 | 195 | 1363288 | 9121.06 | 618 | 602 | 149.4 |
| D | 7 | 80 | 403931 | 2699.66 | 618 | 602 | 149.4 |
| D | 2 | 249 | 309279 | 2066.11 | 618 | 602 | 149.4 |
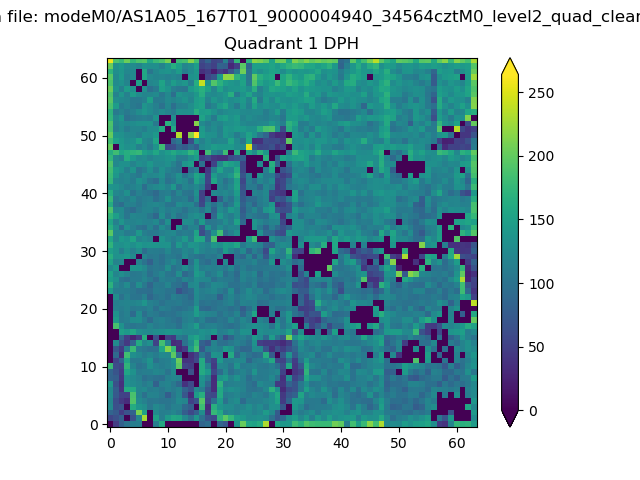
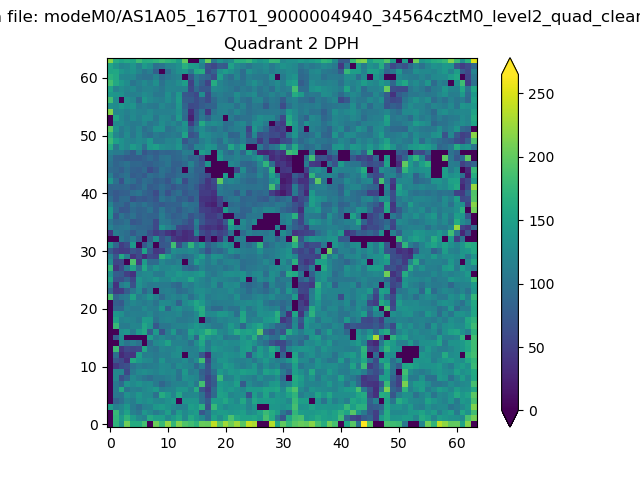
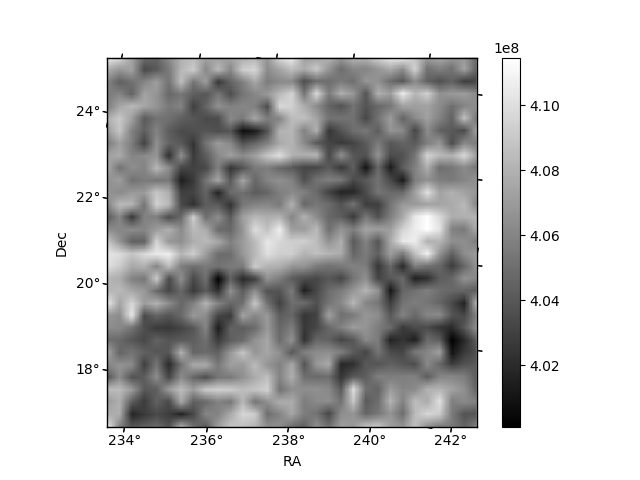
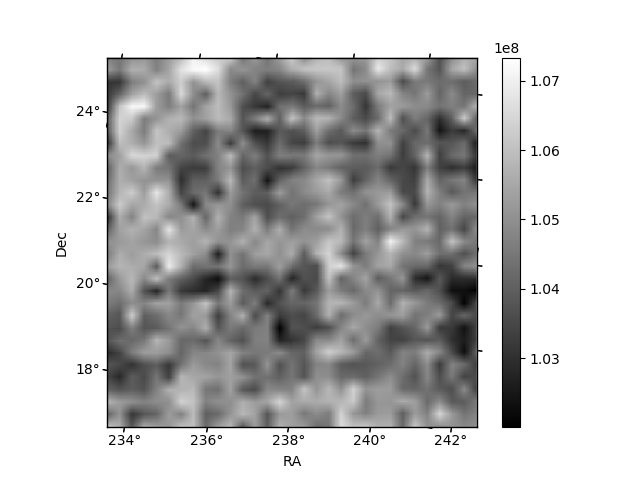
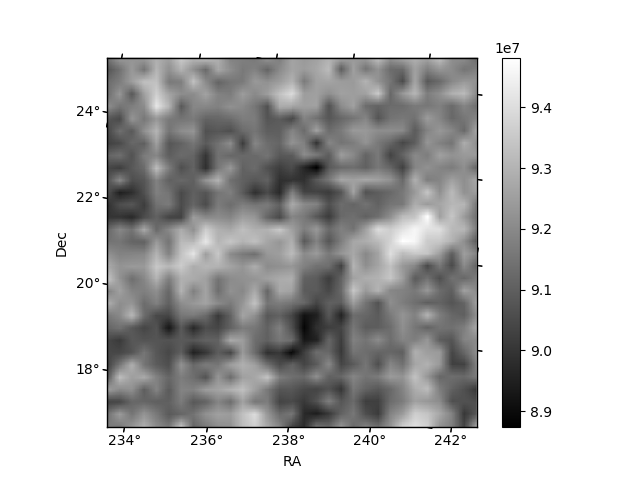
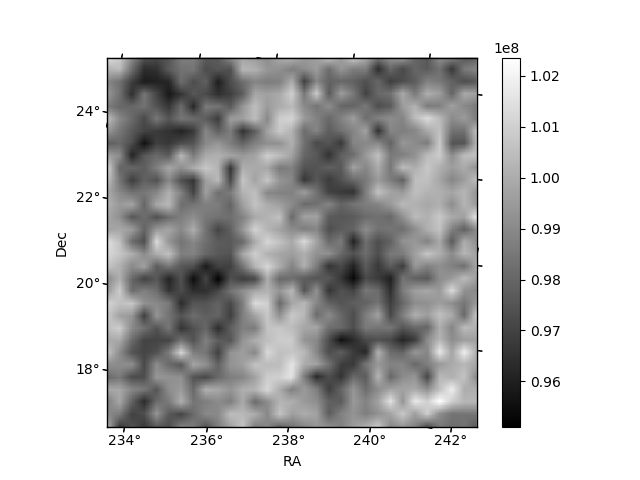
Histogram calculated using DETX and DETY for each event in the final _common_clean file
| Quadrant A | 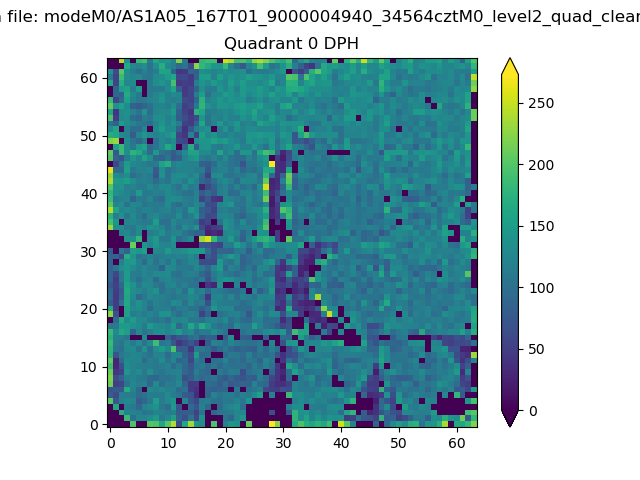 |
 |
Quadrant B |
|---|---|---|---|
| Quadrant D | 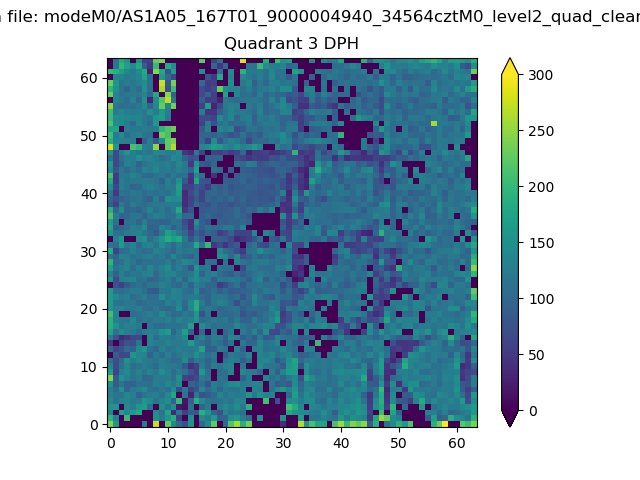 |
 |
Quadrant C |
| Plot type | Count rate plots | Images |
|---|---|---|
| Comparison with Poisson distribution Blue bars denote a histogram of data divided into 1 sec bins. Red curve is a Poisson curve with rate = median count rate of data. |
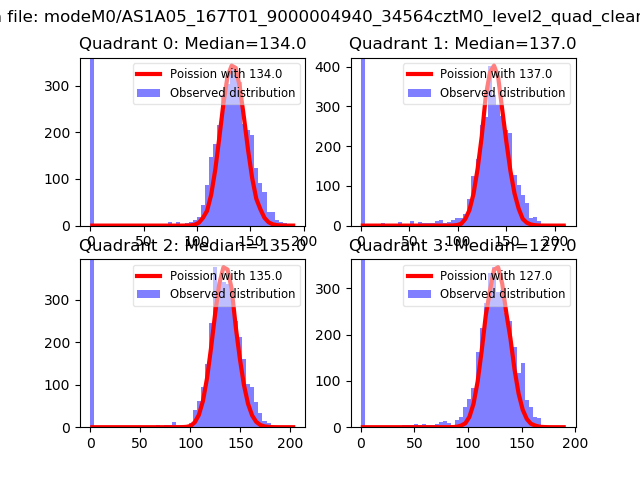 |
 |
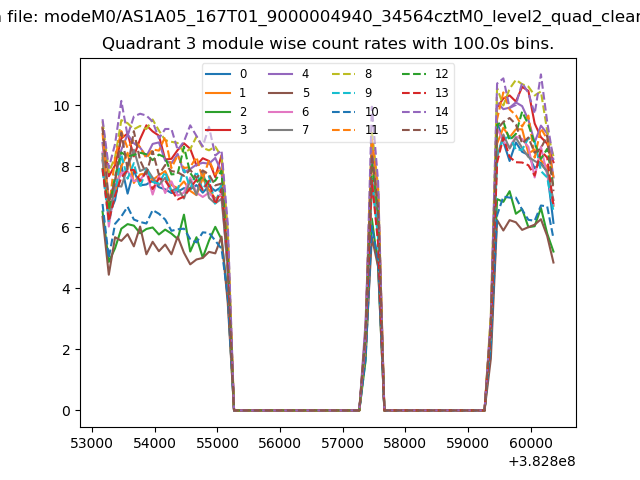
| Quadrant-wise count rates Data is divided into 100 sec bins |
 |
|
| Module-wise count rates for Quadrant A Data is divided into 100 sec bins |
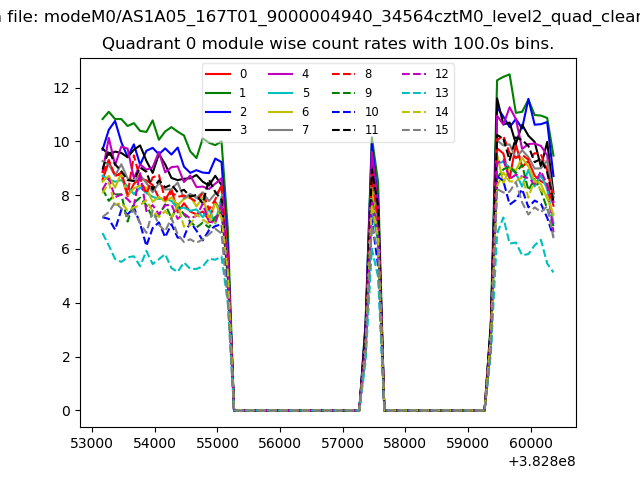 |
 |
| Module-wise count rates for Quadrant B Data is divided into 100 sec bins |
 |
 |
| Module-wise count rates for Quadrant C Data is divided into 100 sec bins |
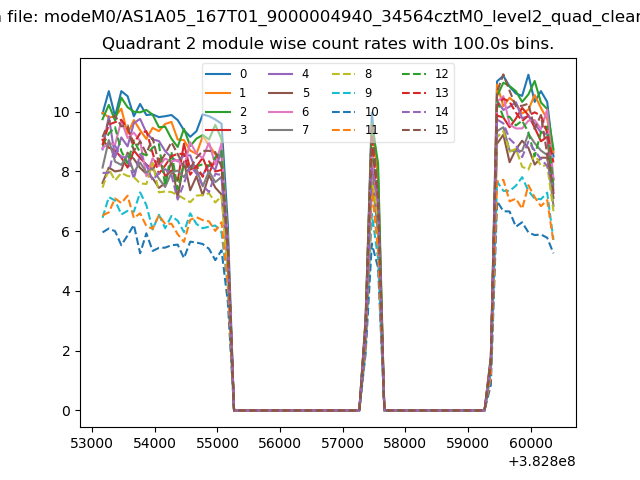 |
 |
| Module-wise count rates for Quadrant D Data is divided into 100 sec bins |
 |
 |
| Parameter | Plot |
|---|---|
| CZT HV Monitor | 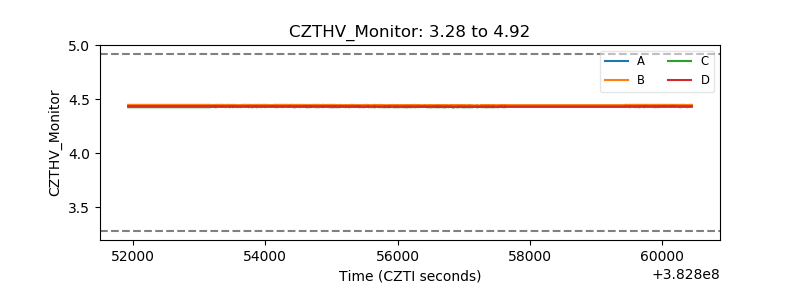 |
| D_VDD | 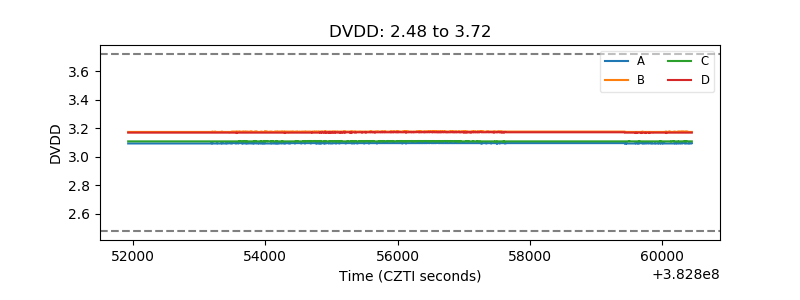 |
| Temperature 1 | 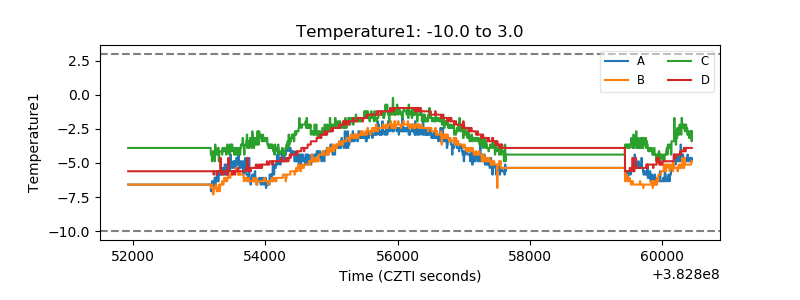 |
| Veto HV Monitor | 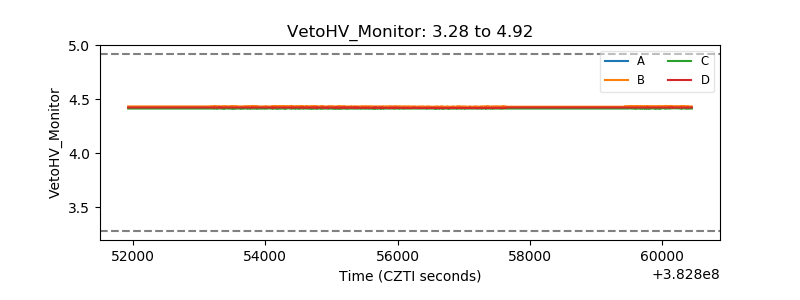 |
| Veto LLD | 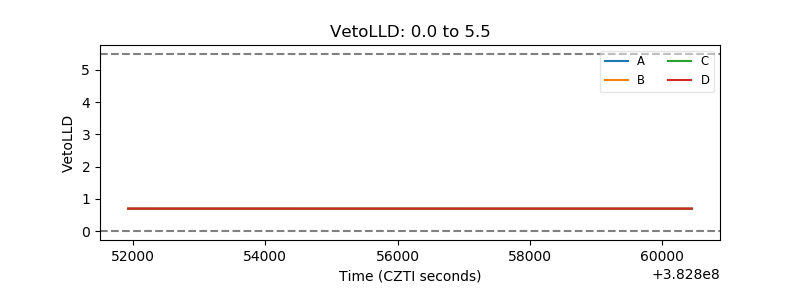 |
| Alpha Counter |  |
| _CPM_Rate | 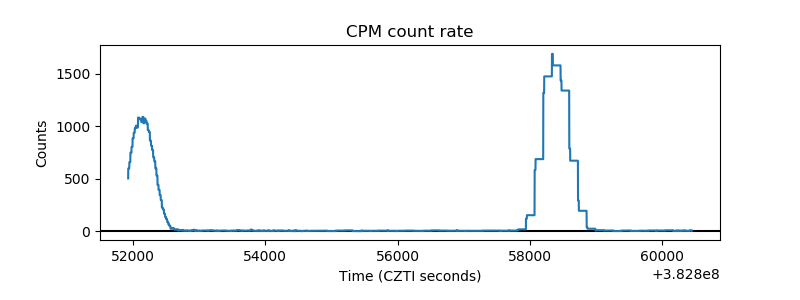 |
| CZT Counter | 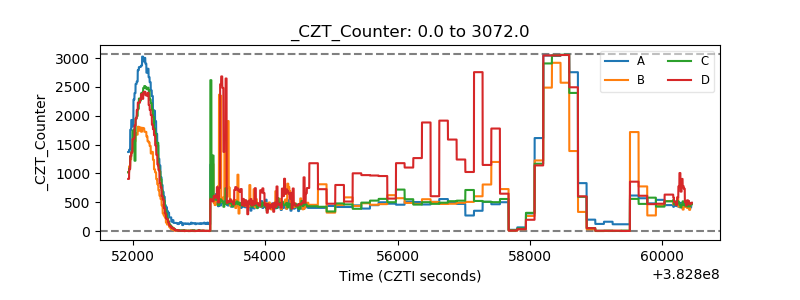 |
| +2.5 Volts monitor | 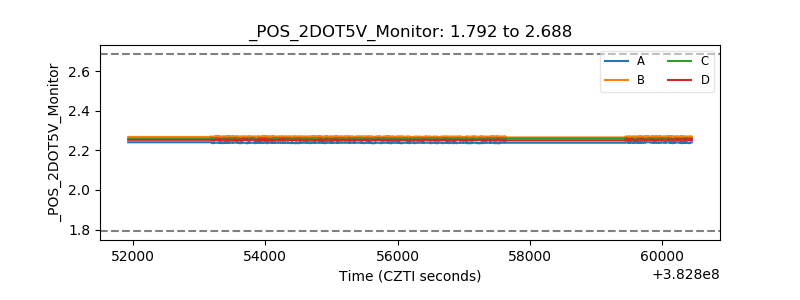 |
| +5 Volts monitor | 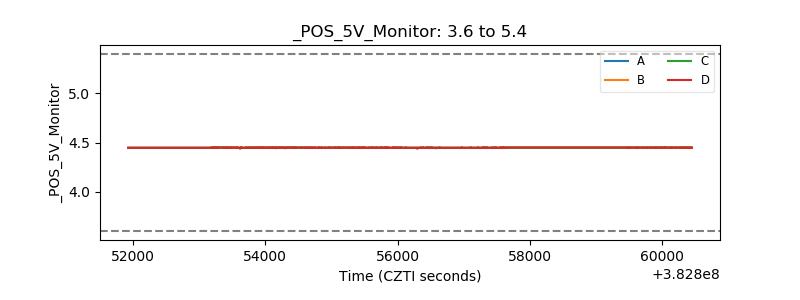 |
| _ROLL_ROT | 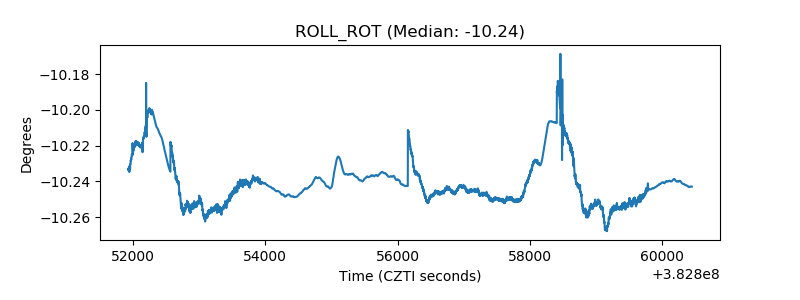 |
| _Roll_DEC | 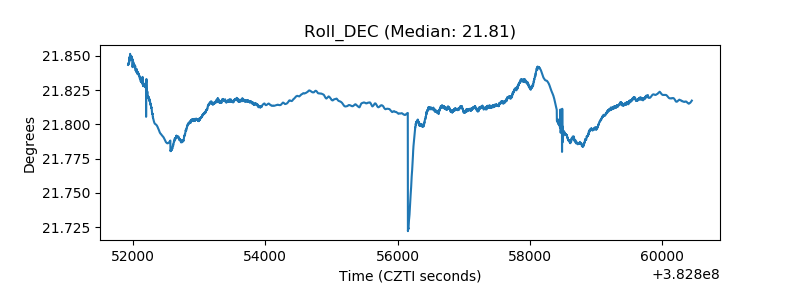 |
| _Roll_RA | 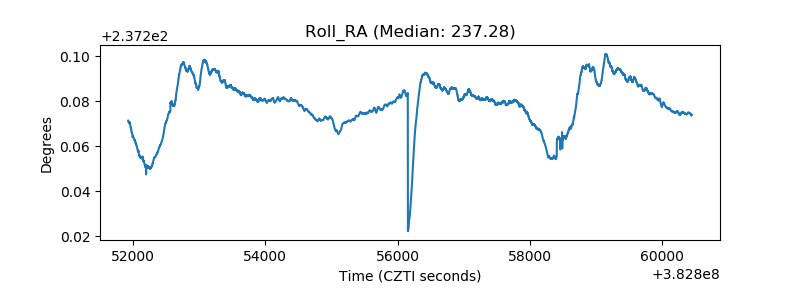 |
| Veto Counter | 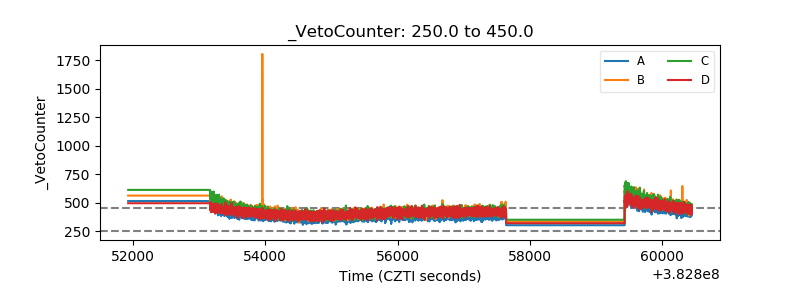 |