| Param | Original file | Final file |
|---|---|---|
| Filename | modeM0/AS1A05_167T01_9000004940cztM0_level2_bc.evt | modeM0/AS1A05_167T01_9000004940cztM0_level2_quad_clean.evt |
| Size (bytes) | 4,582,062,720 | 1,057,394,880 |
| Size | 4.3 GB | 1008.4 MB |
| Events in quadrant A | 19,965,882 | 6,640,427 |
| Events in quadrant B | 29,272,681 | 6,616,673 |
| Events in quadrant C | 22,450,198 | 6,700,467 |
| Events in quadrant D | 61,214,905 | 6,145,997 |
| Mode SS | |||
|---|---|---|---|
| Quadrant | BADHDUFLAG | Total packets | Discarded packets |
| A | 0 | 1764 | 0 |
| B | 0 | 1764 | 0 |
| C | 0 | 1764 | 0 |
| D | 0 | 1764 | 0 |
| Mode M9 | |||
|---|---|---|---|
| Quadrant | BADHDUFLAG | Total packets | Discarded packets |
| A | 0 | 325 | 0 |
| B | 0 | 325 | 0 |
| C | 0 | 325 | 0 |
| D | 0 | 325 | 0 |
| Mode M0 | |||
|---|---|---|---|
| Quadrant | BADHDUFLAG | Total packets | Discarded packets |
| A | 0 | 182072 | 0 |
| B | 0 | 221136 | 0 |
| C | 0 | 181593 | 0 |
| D | 0 | 319569 | 0 |
| Quadrant | Total seconds | Saturated seconds | Saturation percentage |
|---|---|---|---|
| A | 86425 | 550 | 0.636390% |
| B | 86417 | 3714 | 4.297765% |
| C | 86412 | 274 | 0.317086% |
| D | 86400 | 6020 | 6.967593% |
Noise dominated data is calculated using 1-second bins in cleaned event files. If a bin has >2000 counts, and if more than 50% of those come from <1% of pixels, then it is considered to be noise-dominated and hence unusable.
| Quadrant | # 1 sec bins | Bins with >0 counts | Bins with >2000 counts | High rate bins dominated by noise | Noise dominated (total time) | Noise dominated (detector-on time) | Marked lightcurve |
|---|---|---|---|---|---|---|---|
| A | 121861 | 86477 | 35 | 35 | 0.03% | 0.04% | 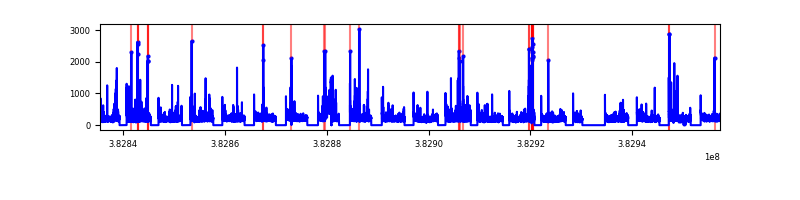 |
| B | 121861 | 86471 | 287 | 287 | 0.24% | 0.33% | 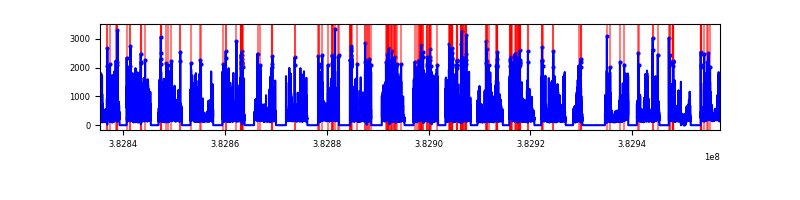 |
| C | 121861 | 86457 | 58 | 58 | 0.05% | 0.07% | 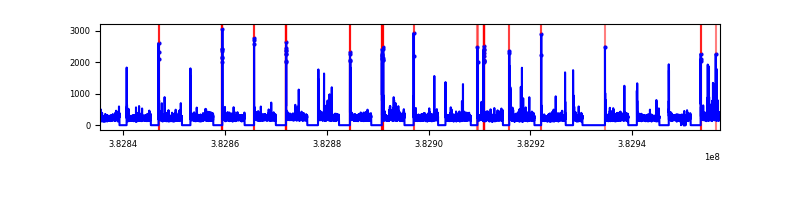 |
| D | 121861 | 86453 | 1416 | 1416 | 1.16% | 1.64% | 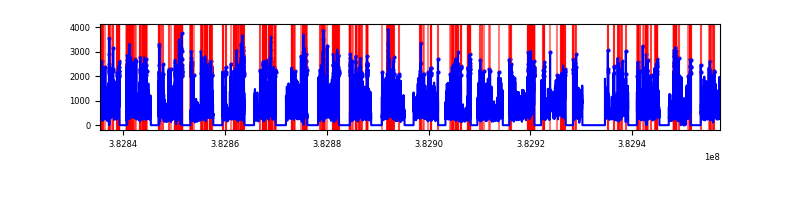 |
Top three noisy pixels from each quadrant. If the there are fewer than three noisy pixels in the level2.evt file, extra rows are filled as -1
| Pixel properties | Quadrant properties | ||||||
|---|---|---|---|---|---|---|---|
| Quadrant | DetID | PixID | Counts | Sigma | Mean | Median | Sigma |
| A | 15 | 169 | 690655 | 683.31 | 4603 | 4535 | 1004.1 |
| A | 10 | 83 | 438622 | 432.31 | 4603 | 4535 | 1004.1 |
| A | 9 | 143 | 292966 | 287.25 | 4603 | 4535 | 1004.1 |
| B | 5 | 172 | 7719967 | 8651.84 | 4577 | 4497 | 891.8 |
| B | 0 | 229 | 810567 | 903.9 | 4577 | 4497 | 891.8 |
| B | 5 | 255 | 730278 | 813.86 | 4577 | 4497 | 891.8 |
| C | 15 | 214 | 3435524 | 3346.79 | 4512 | 4484 | 1025.2 |
| C | 0 | 10 | 655374 | 634.91 | 4512 | 4484 | 1025.2 |
| C | 14 | 67 | 279127 | 267.9 | 4512 | 4484 | 1025.2 |
| D | 8 | 195 | 27927501 | 26396.31 | 4411 | 4279 | 1057.8 |
| D | 7 | 80 | 5258994 | 4967.37 | 4411 | 4279 | 1057.8 |
| D | 2 | 250 | 1468733 | 1384.37 | 4411 | 4279 | 1057.8 |
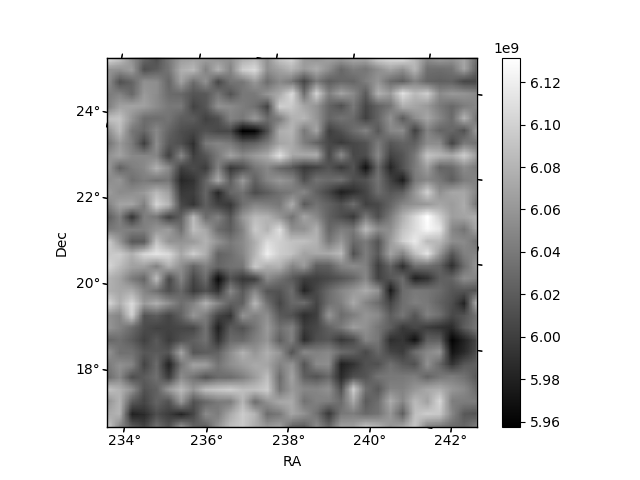
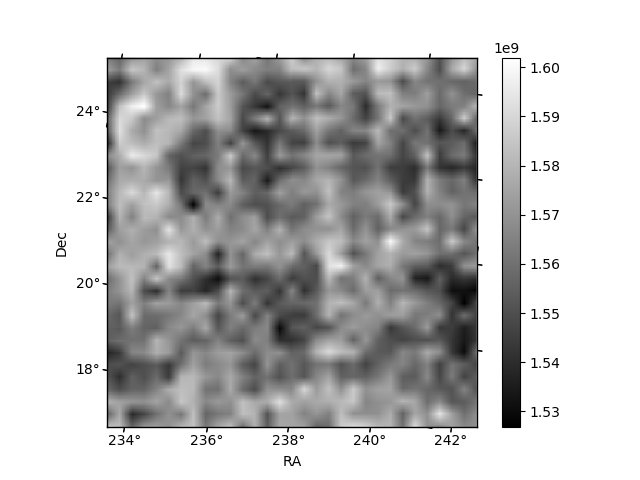
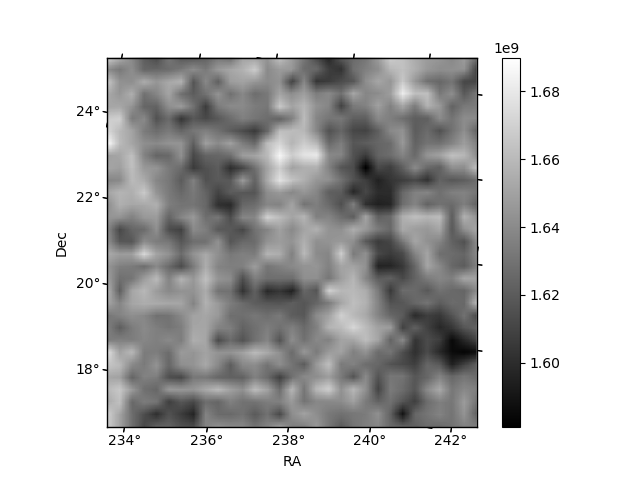
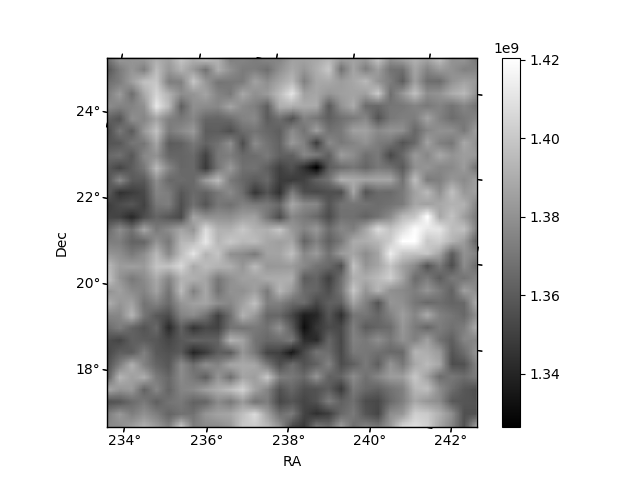
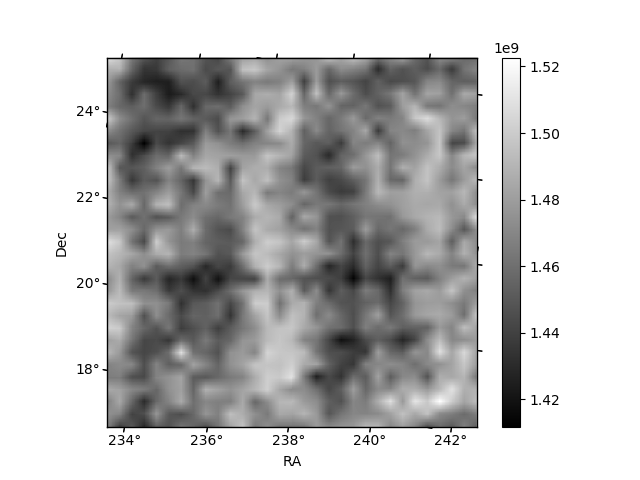
Histogram calculated using DETX and DETY for each event in the final _common_clean file
| Quadrant A | 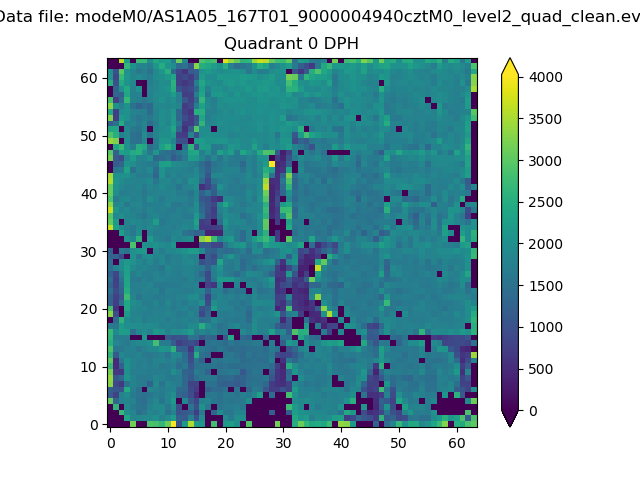 |
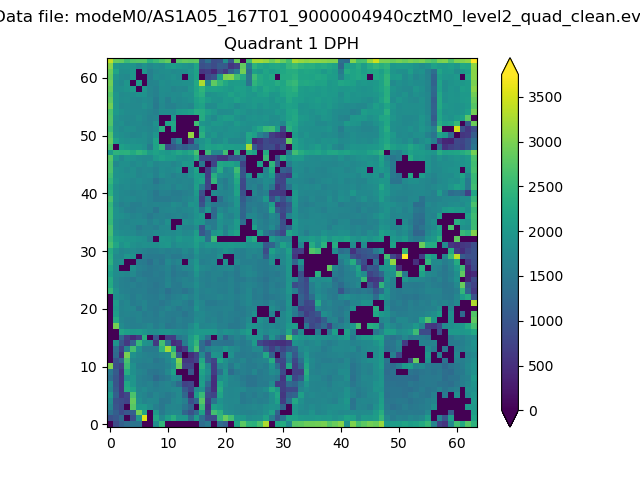 |
Quadrant B |
|---|---|---|---|
| Quadrant D | 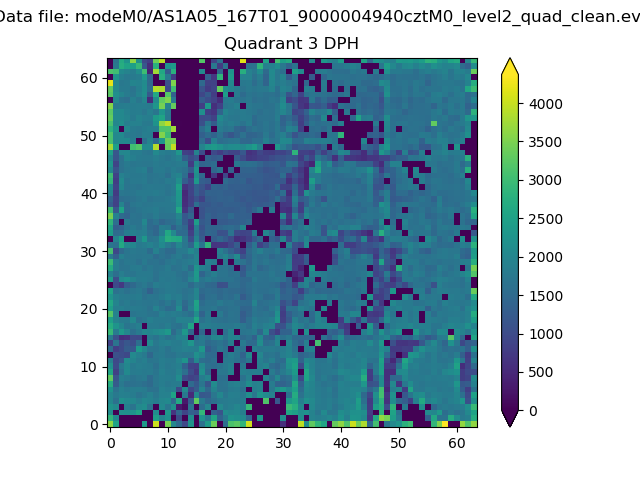 |
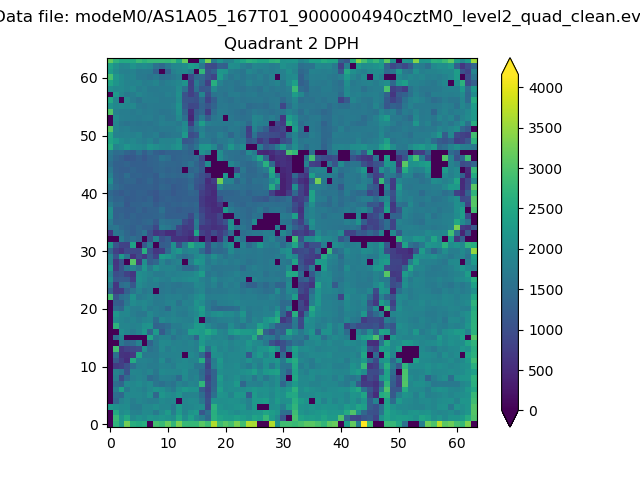 |
Quadrant C |
| Plot type | Count rate plots | Images |
|---|---|---|
| Comparison with Poisson distribution Blue bars denote a histogram of data divided into 1 sec bins. Red curve is a Poisson curve with rate = median count rate of data. |
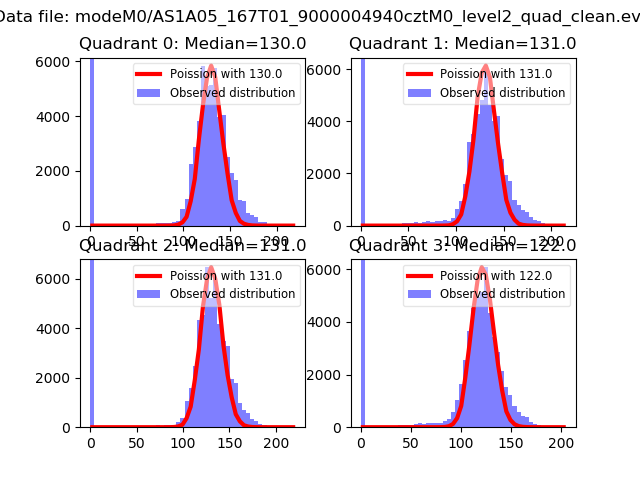 |
 |
| Quadrant-wise count rates Data is divided into 100 sec bins |
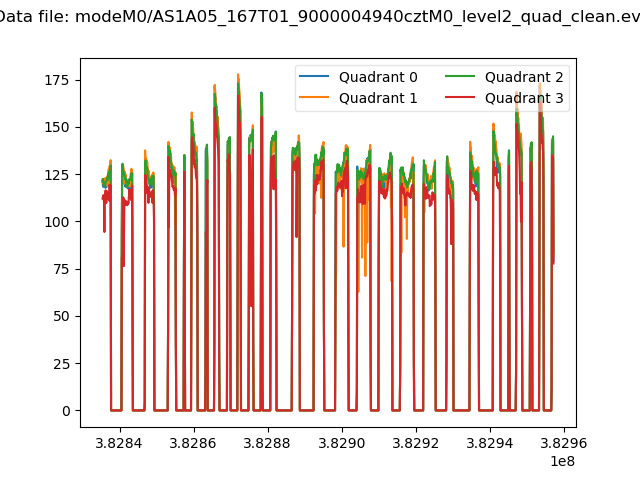 |
|
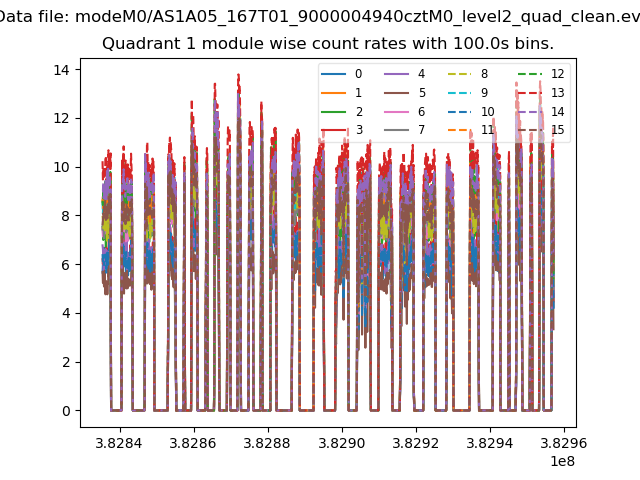
| Module-wise count rates for Quadrant A Data is divided into 100 sec bins |
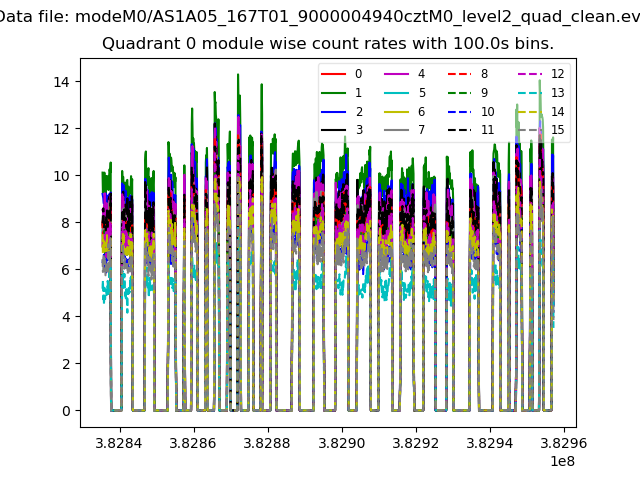 |
 |
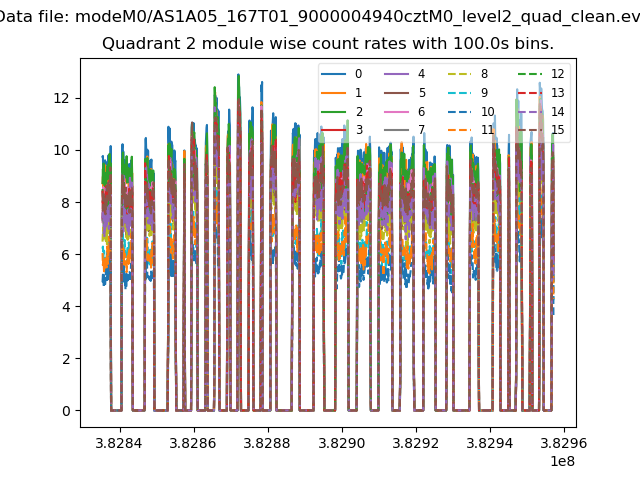
| Module-wise count rates for Quadrant B Data is divided into 100 sec bins |
 |
 |
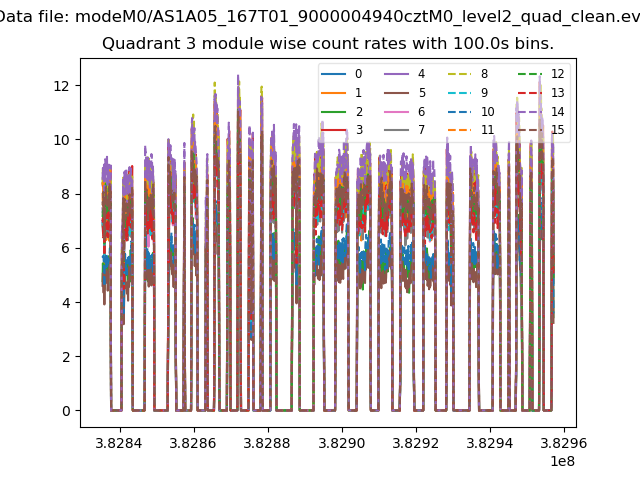
| Module-wise count rates for Quadrant C Data is divided into 100 sec bins |
 |
 |
| Module-wise count rates for Quadrant D Data is divided into 100 sec bins |
 |
 |
| Parameter | Plot |
|---|---|
| CZT HV Monitor | 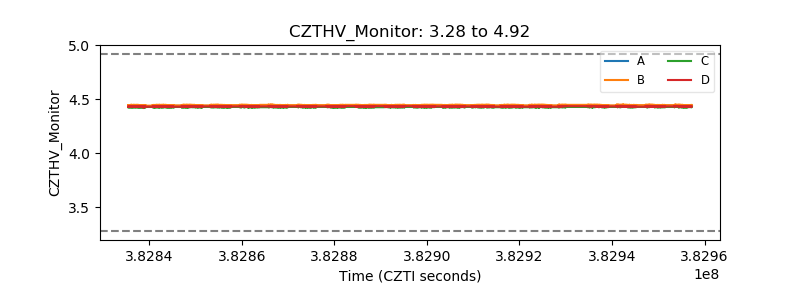 |
| D_VDD | 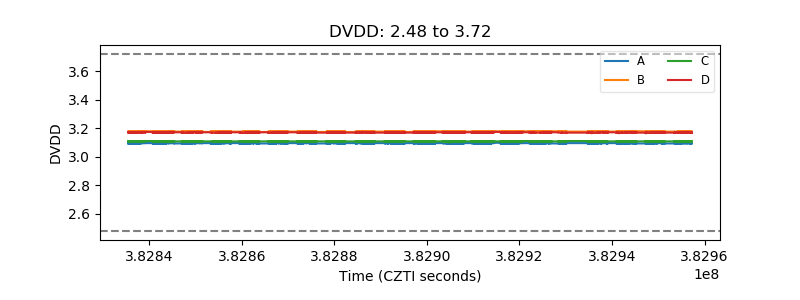 |
| Temperature 1 |  |
| Veto HV Monitor | 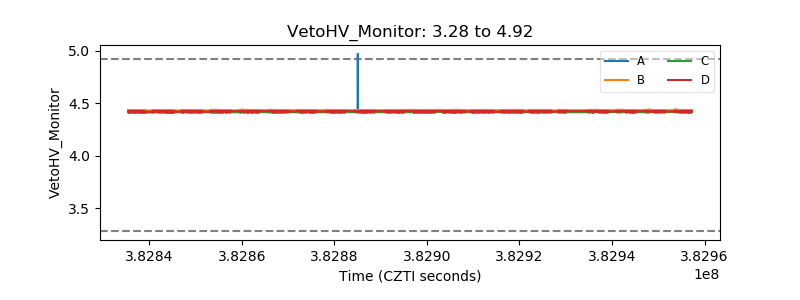 |
| Veto LLD | 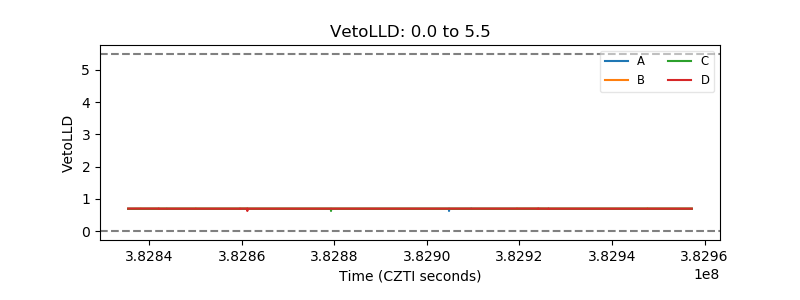 |
| Alpha Counter | 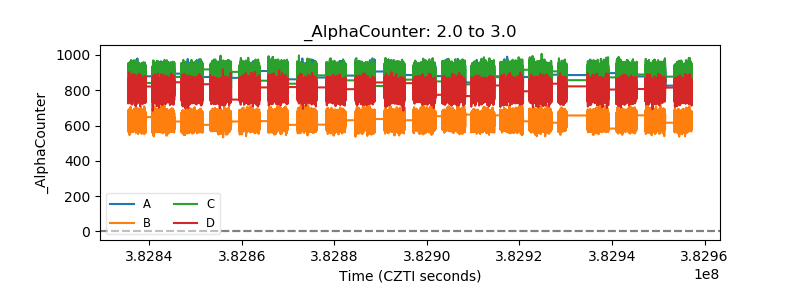 |
| _CPM_Rate | 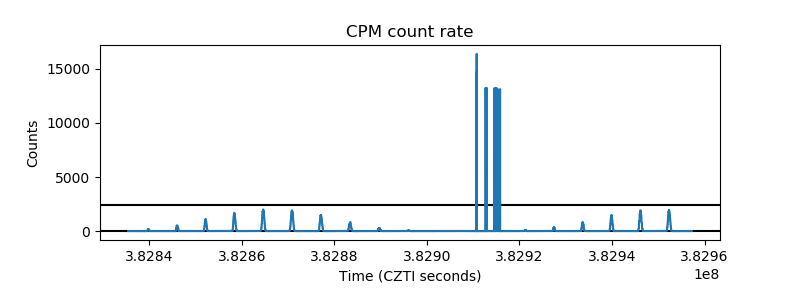 |
| CZT Counter | 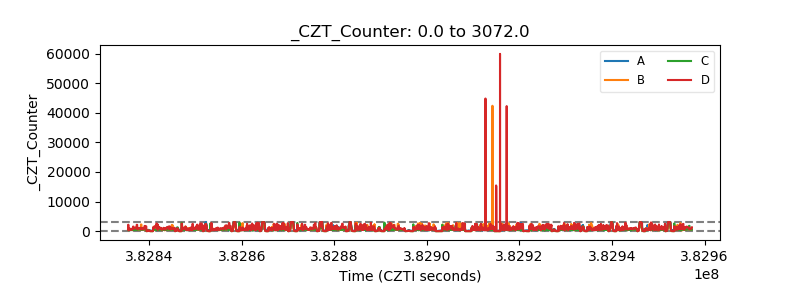 |
| +2.5 Volts monitor | 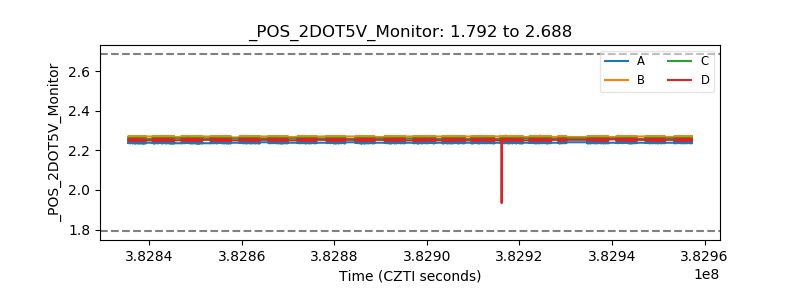 |
| +5 Volts monitor | 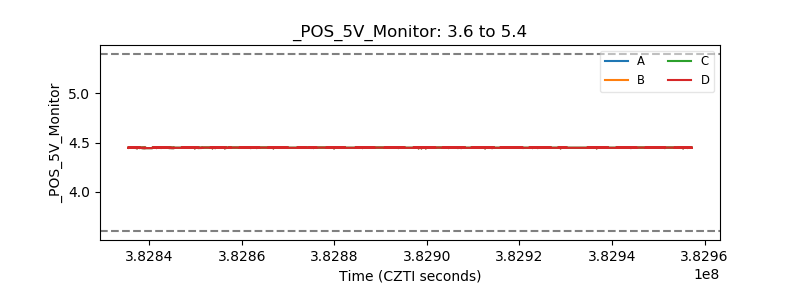 |
| _ROLL_ROT | 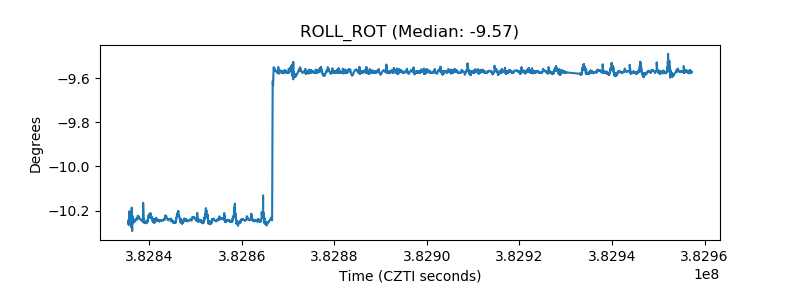 |
| _Roll_DEC | 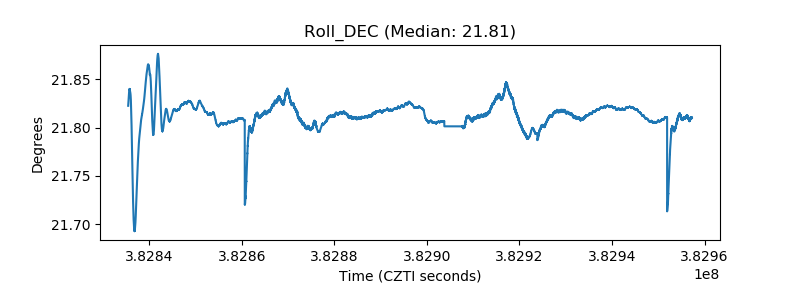 |
| _Roll_RA | 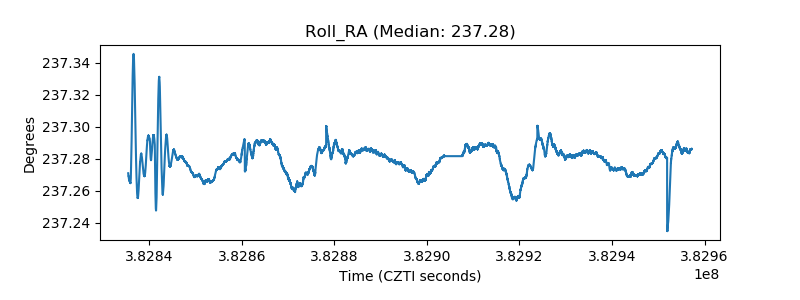 |
| Veto Counter | 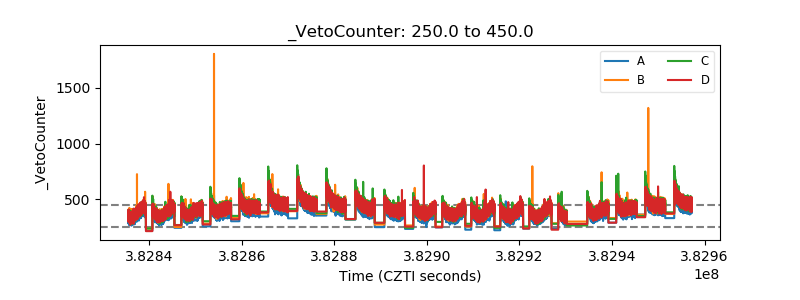 |