| Param | Original file | Final file |
|---|---|---|
| Filename | modeM0/AS1A05_103T05_9000004938_34562cztM0_level2.evt | modeM0/AS1A05_103T05_9000004938_34562cztM0_level2_quad_clean.evt |
| Size (bytes) | 150,863,040 | 9,279,360 |
| Size | 143.9 MB | 8.8 MB |
| Events in quadrant A | 740,331 | 48,373 |
| Events in quadrant B | 1,171,975 | 44,967 |
| Events in quadrant C | 906,280 | 41,698 |
| Events in quadrant D | 1,655,621 | 43,503 |
| Mode M9 | |||
|---|---|---|---|
| Quadrant | BADHDUFLAG | Total packets | Discarded packets |
| A | 0 | 14 | 0 |
| B | 0 | 14 | 0 |
| C | 0 | 14 | 0 |
| D | 0 | 14 | 0 |
| Mode SS | |||
|---|---|---|---|
| Quadrant | BADHDUFLAG | Total packets | Discarded packets |
| A | 0 | 28 | 0 |
| B | 0 | 28 | 0 |
| C | 0 | 28 | 0 |
| D | 0 | 28 | 0 |
| Mode M0 | |||
|---|---|---|---|
| Quadrant | BADHDUFLAG | Total packets | Discarded packets |
| A | 0 | 2962 | 1 |
| B | 0 | 4408 | 1 |
| C | 0 | 3452 | 1 |
| D | 0 | 5893 | 1 |
| Quadrant | Total seconds | Saturated seconds | Saturation percentage |
|---|---|---|---|
| A | 1365 | 5 | 0.366300% |
| B | 1365 | 158 | 11.575092% |
| C | 1365 | 69 | 5.054945% |
| D | 1365 | 182 | 13.333333% |
Noise dominated data is calculated using 1-second bins in cleaned event files. If a bin has >2000 counts, and if more than 50% of those come from <1% of pixels, then it is considered to be noise-dominated and hence unusable.
| Quadrant | # 1 sec bins | Bins with >0 counts | Bins with >2000 counts | High rate bins dominated by noise | Noise dominated (total time) | Noise dominated (detector-on time) | Marked lightcurve |
|---|---|---|---|---|---|---|---|
| A | 2708 | 1366 | 0 | 0 | 0.00% | 0.00% | 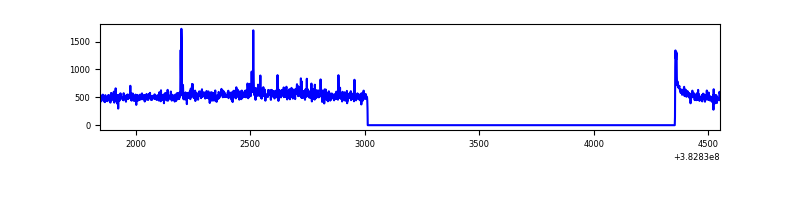 |
| B | 2708 | 1366 | 86 | 86 | 3.18% | 6.30% | 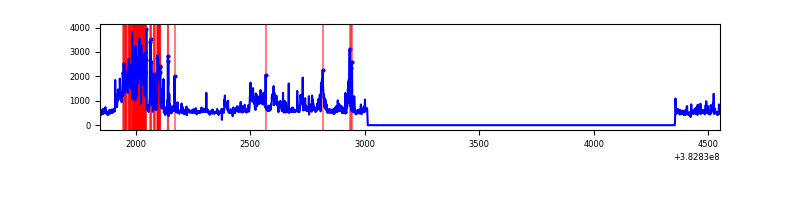 |
| C | 2708 | 1366 | 51 | 51 | 1.88% | 3.73% | 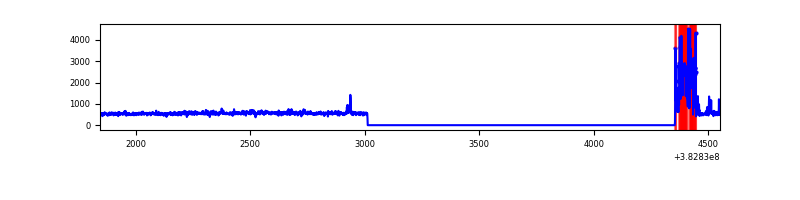 |
| D | 2708 | 1366 | 117 | 117 | 4.32% | 8.57% | 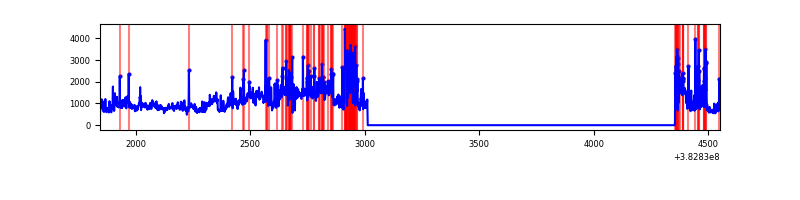 |
Top three noisy pixels from each quadrant. If the there are fewer than three noisy pixels in the level2.evt file, extra rows are filled as -1
| Pixel properties | Quadrant properties | ||||||
|---|---|---|---|---|---|---|---|
| Quadrant | DetID | PixID | Counts | Sigma | Mean | Median | Sigma |
| A | 10 | 83 | 18531 | 475.43 | 179 | 175 | 38.6 |
| A | 0 | 31 | 13983 | 357.63 | 179 | 175 | 38.6 |
| A | 9 | 143 | 11004 | 280.47 | 179 | 175 | 38.6 |
| B | 5 | 172 | 391351 | 11280.85 | 170 | 165 | 34.7 |
| B | 0 | 229 | 37966 | 1090.09 | 170 | 165 | 34.7 |
| B | 0 | 190 | 35667 | 1023.79 | 170 | 165 | 34.7 |
| C | 0 | 10 | 181054 | 4469.32 | 166 | 167 | 40.5 |
| C | 15 | 214 | 57154 | 1408.02 | 166 | 167 | 40.5 |
| C | 3 | 233 | 7697 | 186.05 | 166 | 167 | 40.5 |
| D | 8 | 195 | 510488 | 11438.57 | 166 | 162 | 44.6 |
| D | 7 | 80 | 116832 | 2615.07 | 166 | 162 | 44.6 |
| D | 1 | 47 | 60228 | 1346.33 | 166 | 162 | 44.6 |
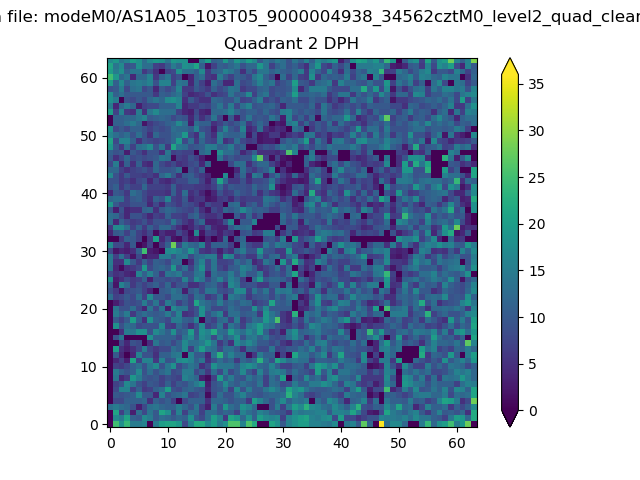
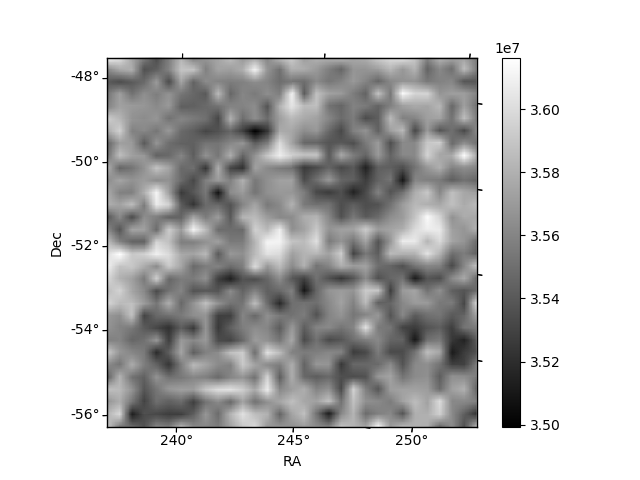
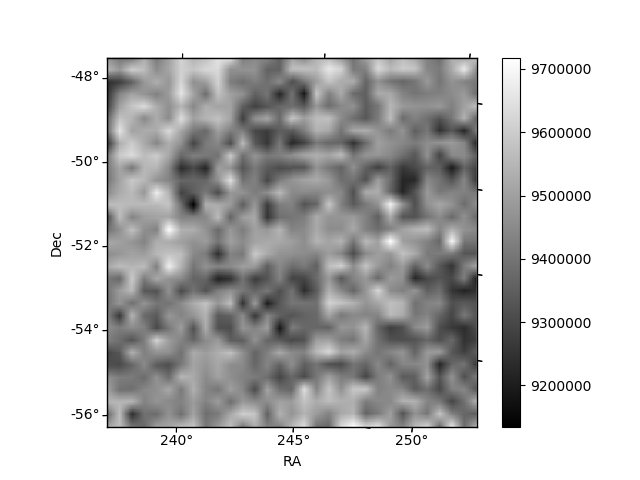
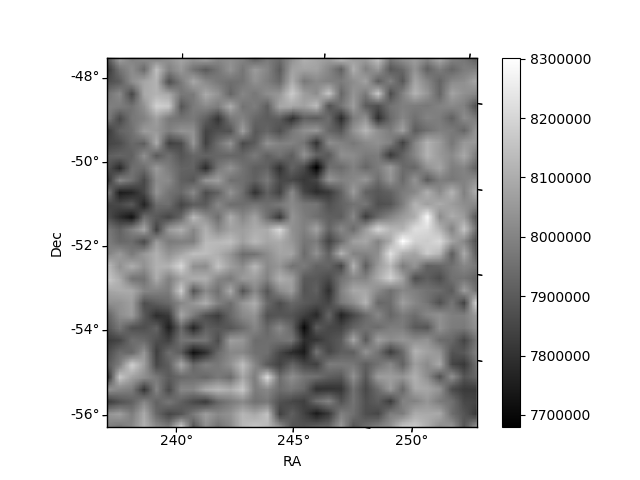
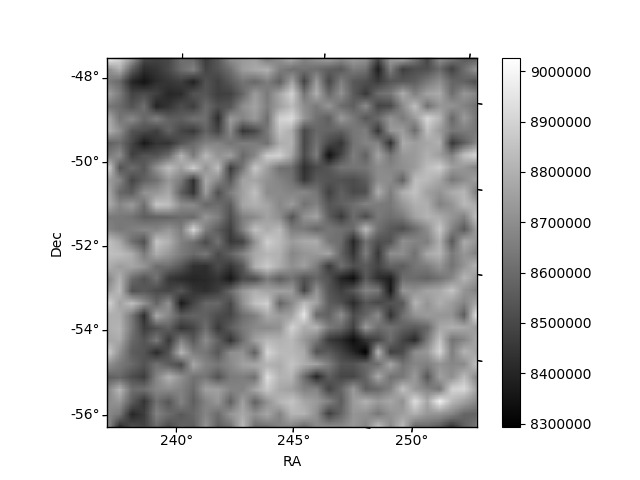
Histogram calculated using DETX and DETY for each event in the final _common_clean file
| Quadrant A | 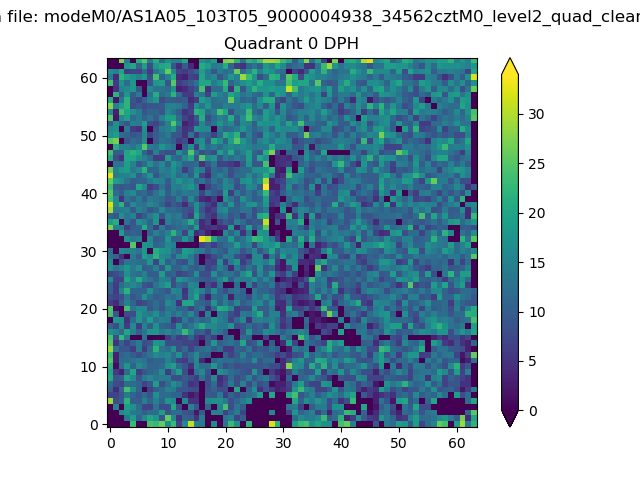 |
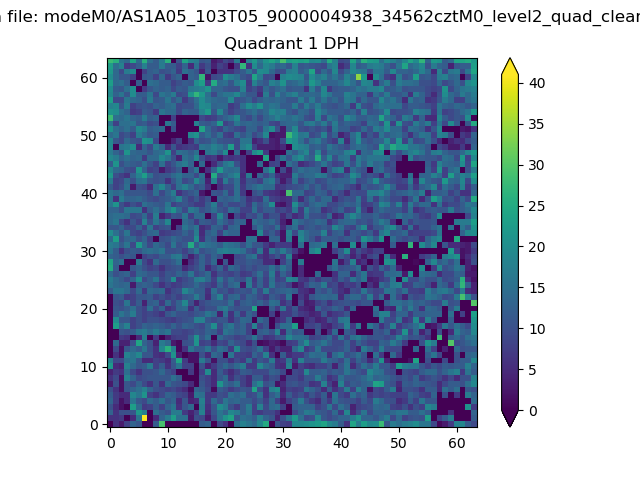 |
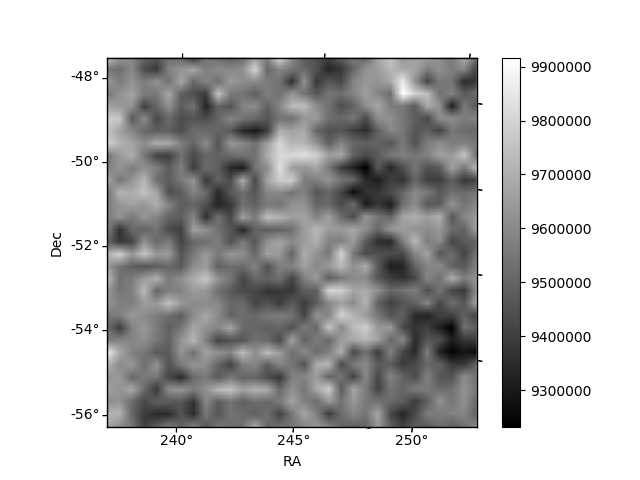
Quadrant B |
|---|---|---|---|
| Quadrant D | 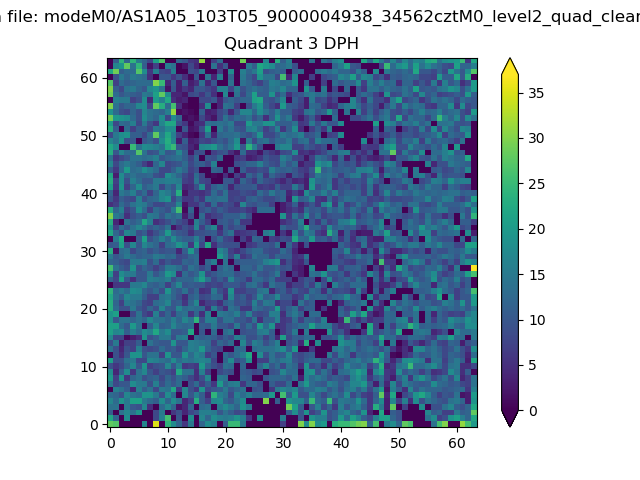 |
 |
Quadrant C |
| Plot type | Count rate plots | Images |
|---|---|---|
| Comparison with Poisson distribution Blue bars denote a histogram of data divided into 1 sec bins. Red curve is a Poisson curve with rate = median count rate of data. |
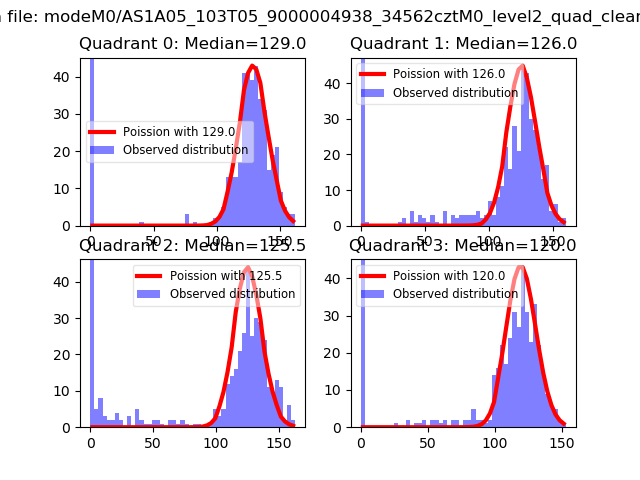 |
 |
| Quadrant-wise count rates Data is divided into 100 sec bins |
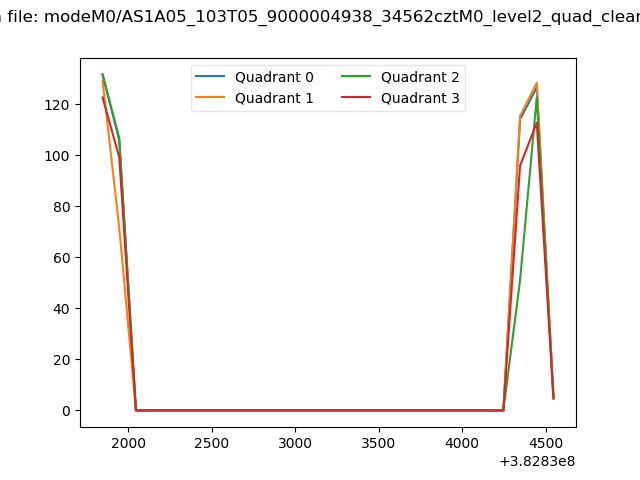 |
|
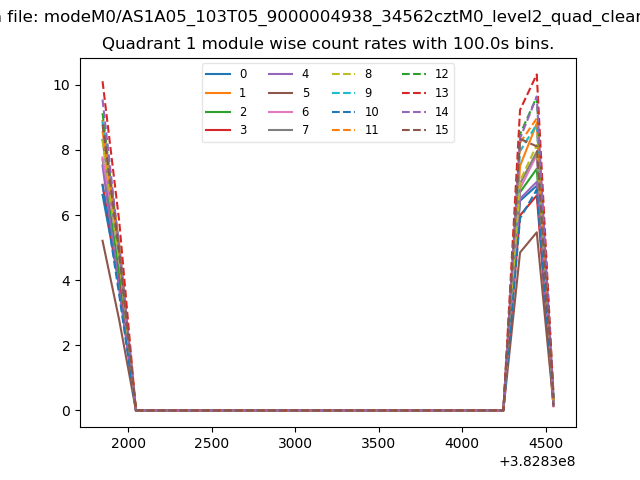
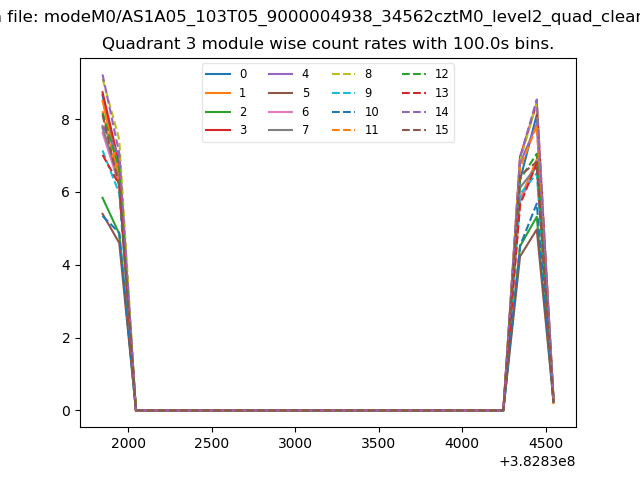
| Module-wise count rates for Quadrant A Data is divided into 100 sec bins |
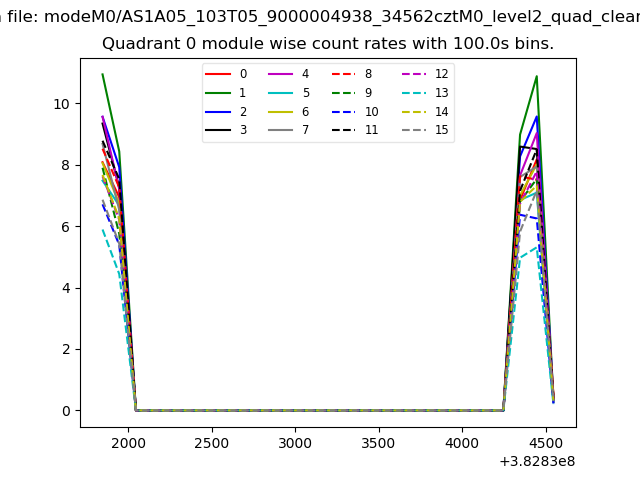 |
 |
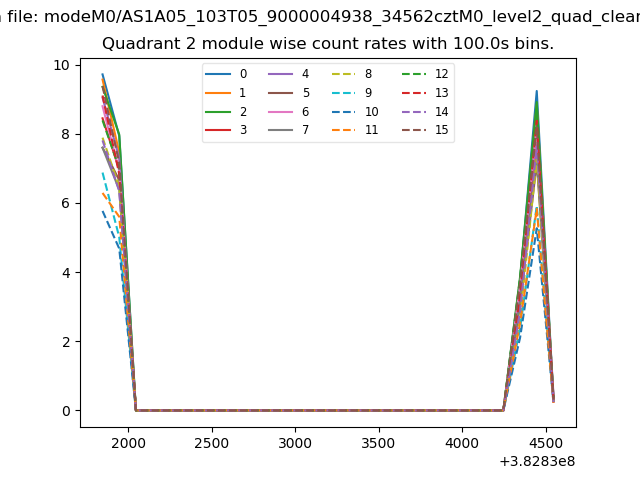
| Module-wise count rates for Quadrant B Data is divided into 100 sec bins |
 |
 |
| Module-wise count rates for Quadrant C Data is divided into 100 sec bins |
 |
 |
| Module-wise count rates for Quadrant D Data is divided into 100 sec bins |
 |
 |
| Parameter | Plot |
|---|---|
| CZT HV Monitor | 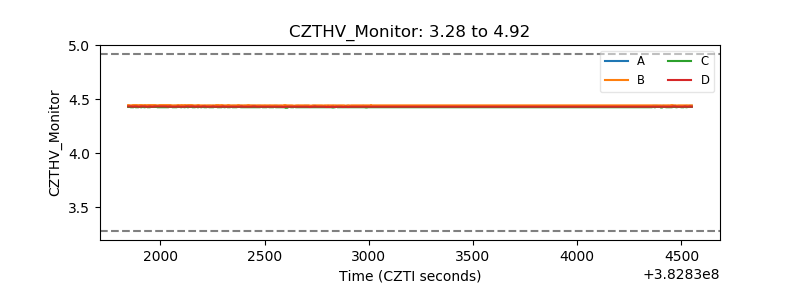 |
| D_VDD | 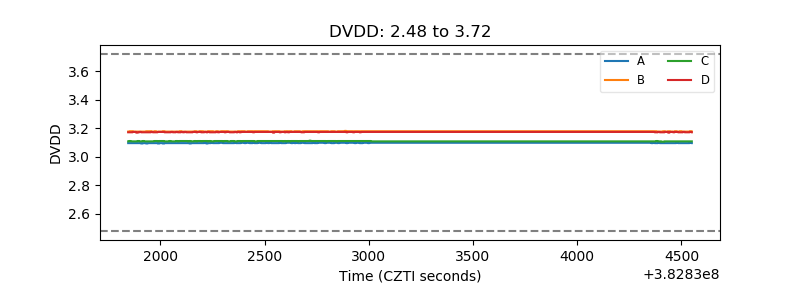 |
| Temperature 1 | 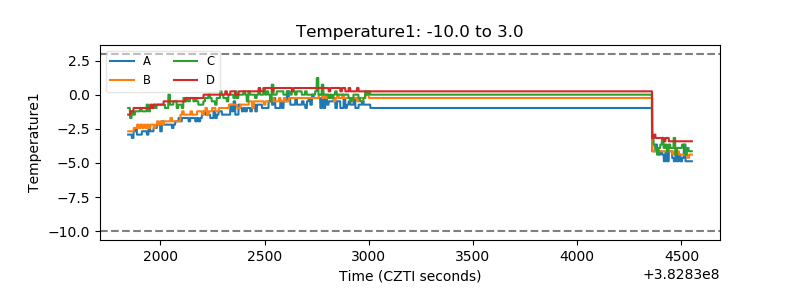 |
| Veto HV Monitor | 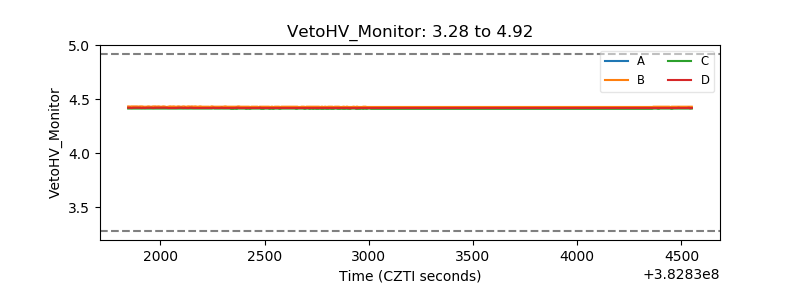 |
| Veto LLD | 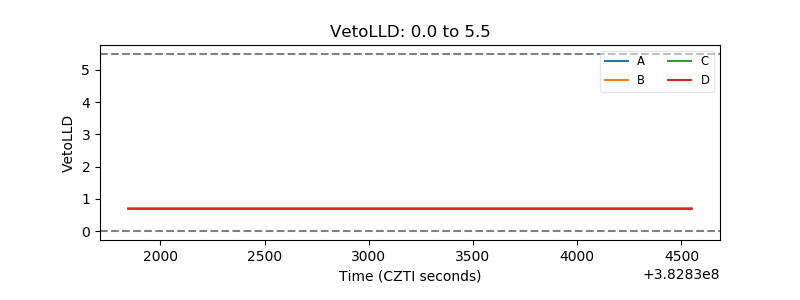 |
| Alpha Counter | 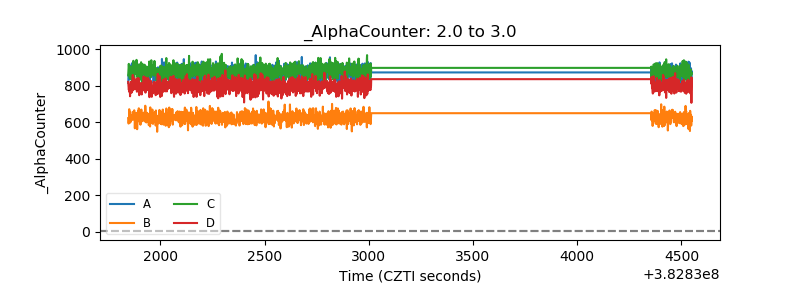 |
| _CPM_Rate | 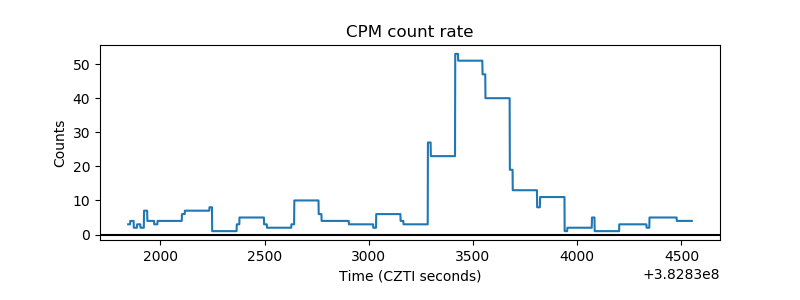 |
| CZT Counter | 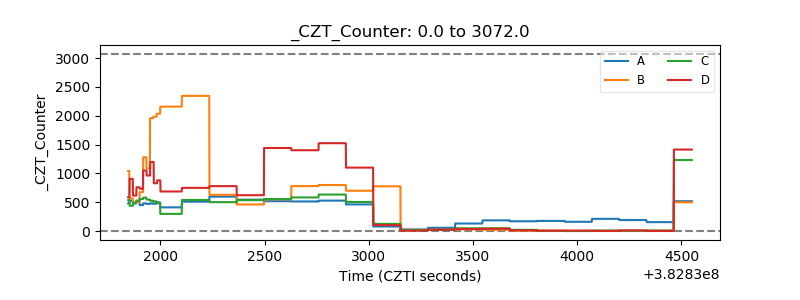 |
| +2.5 Volts monitor | 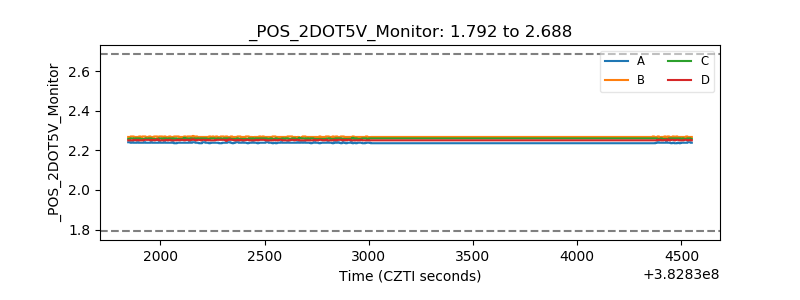 |
| +5 Volts monitor | 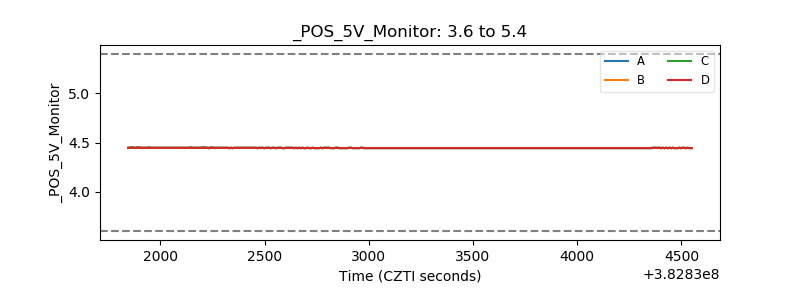 |
| _ROLL_ROT | 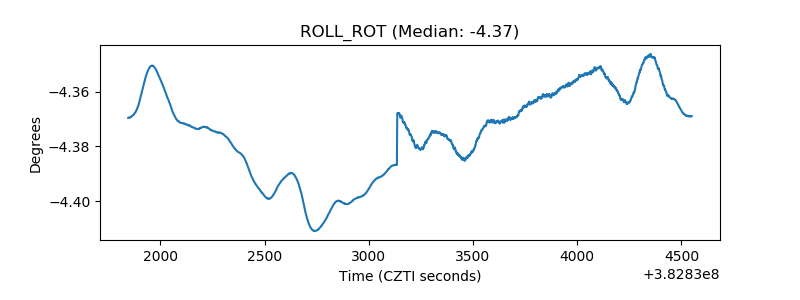 |
| _Roll_DEC | 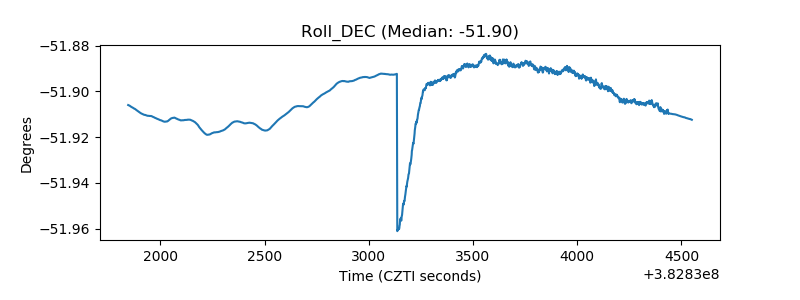 |
| _Roll_RA | 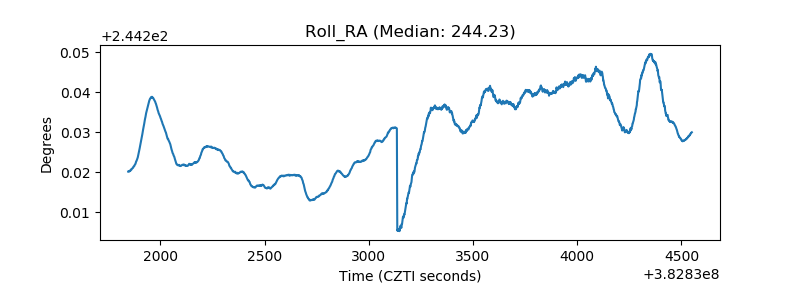 |
| Veto Counter | 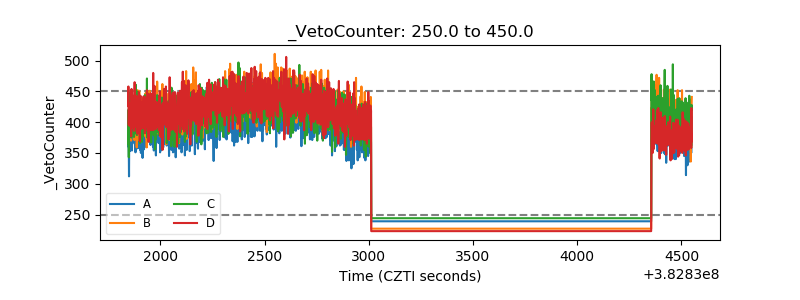 |