| Param | Original file | Final file |
|---|---|---|
| Filename | modeM0/AS1A05_103T05_9000004938_34561cztM0_level2.evt | modeM0/AS1A05_103T05_9000004938_34561cztM0_level2_quad_clean.evt |
| Size (bytes) | 386,144,640 | 69,528,960 |
| Size | 368.3 MB | 66.3 MB |
| Events in quadrant A | 1,760,355 | 483,140 |
| Events in quadrant B | 2,451,068 | 476,073 |
| Events in quadrant C | 1,905,052 | 478,169 |
| Events in quadrant D | 5,310,836 | 390,565 |
| Mode M9 | |||
|---|---|---|---|
| Quadrant | BADHDUFLAG | Total packets | Discarded packets |
| A | 0 | 12 | 0 |
| B | 0 | 12 | 0 |
| C | 0 | 12 | 0 |
| D | 0 | 12 | 0 |
| Mode SS | |||
|---|---|---|---|
| Quadrant | BADHDUFLAG | Total packets | Discarded packets |
| A | 0 | 78 | 0 |
| B | 0 | 78 | 0 |
| C | 0 | 78 | 0 |
| D | 0 | 78 | 0 |
| Mode M0 | |||
|---|---|---|---|
| Quadrant | BADHDUFLAG | Total packets | Discarded packets |
| A | 0 | 7985 | 2 |
| B | 0 | 9908 | 1 |
| C | 0 | 8027 | 1 |
| D | 0 | 18495 | 1 |
| Quadrant | Total seconds | Saturated seconds | Saturation percentage |
|---|---|---|---|
| A | 3924 | 2 | 0.050968% |
| B | 3924 | 172 | 4.383282% |
| C | 3924 | 8 | 0.203874% |
| D | 3924 | 903 | 23.012232% |
Noise dominated data is calculated using 1-second bins in cleaned event files. If a bin has >2000 counts, and if more than 50% of those come from <1% of pixels, then it is considered to be noise-dominated and hence unusable.
| Quadrant | # 1 sec bins | Bins with >0 counts | Bins with >2000 counts | High rate bins dominated by noise | Noise dominated (total time) | Noise dominated (detector-on time) | Marked lightcurve |
|---|---|---|---|---|---|---|---|
| A | 3924 | 3924 | 0 | 0 | 0.00% | 0.00% | 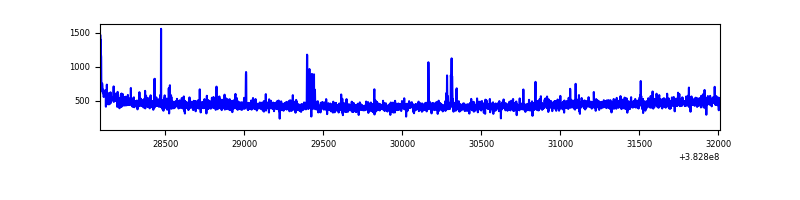 |
| B | 3924 | 3924 | 94 | 94 | 2.40% | 2.40% | 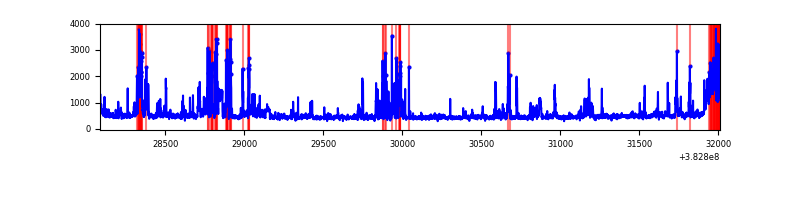 |
| C | 3924 | 3924 | 8 | 8 | 0.20% | 0.20% | 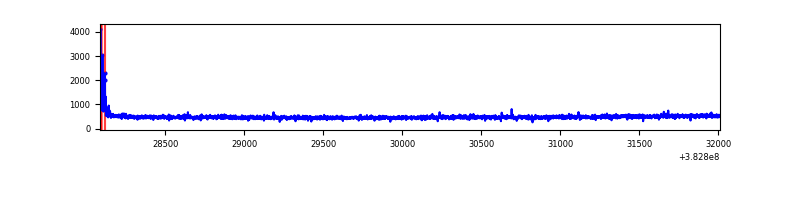 |
| D | 3924 | 3924 | 780 | 780 | 19.88% | 19.88% | 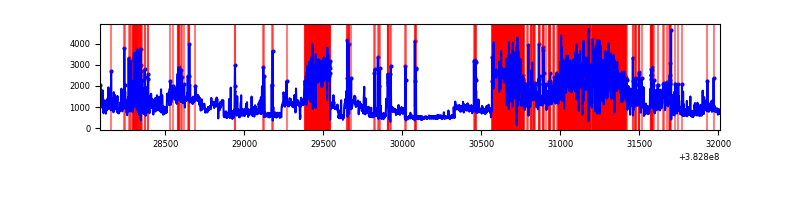 |
Top three noisy pixels from each quadrant. If the there are fewer than three noisy pixels in the level2.evt file, extra rows are filled as -1
| Pixel properties | Quadrant properties | ||||||
|---|---|---|---|---|---|---|---|
| Quadrant | DetID | PixID | Counts | Sigma | Mean | Median | Sigma |
| A | 10 | 83 | 24182 | 262.85 | 439 | 431 | 90.4 |
| A | 15 | 174 | 17593 | 189.93 | 439 | 431 | 90.4 |
| A | 0 | 31 | 11347 | 120.81 | 439 | 431 | 90.4 |
| B | 5 | 172 | 618481 | 7418.98 | 434 | 422 | 83.3 |
| B | 4 | 81 | 27781 | 328.41 | 434 | 422 | 83.3 |
| B | 0 | 245 | 18531 | 217.37 | 434 | 422 | 83.3 |
| C | 15 | 214 | 161322 | 1586.99 | 432 | 436 | 101.4 |
| C | 0 | 10 | 44677 | 436.4 | 432 | 436 | 101.4 |
| C | 14 | 67 | 11523 | 109.36 | 432 | 436 | 101.4 |
| D | 10 | 118 | 1601621 | 16053.48 | 381 | 371 | 99.7 |
| D | 8 | 195 | 1273832 | 12767.2 | 381 | 371 | 99.7 |
| D | 12 | 6 | 320238 | 3206.86 | 381 | 371 | 99.7 |
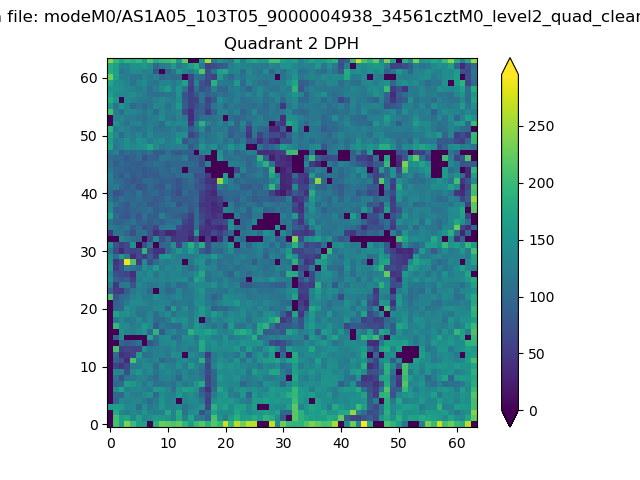
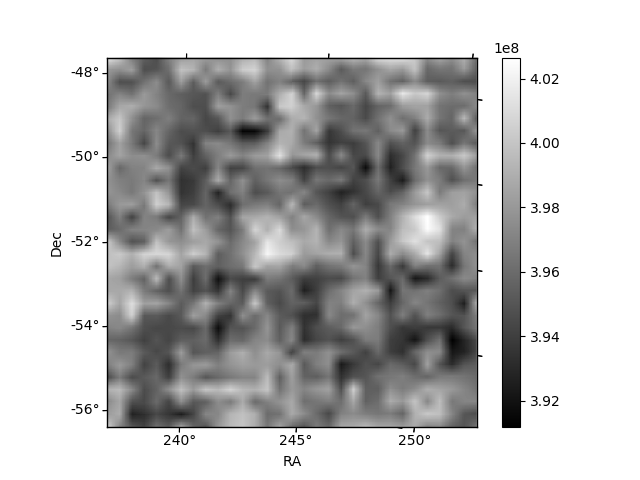
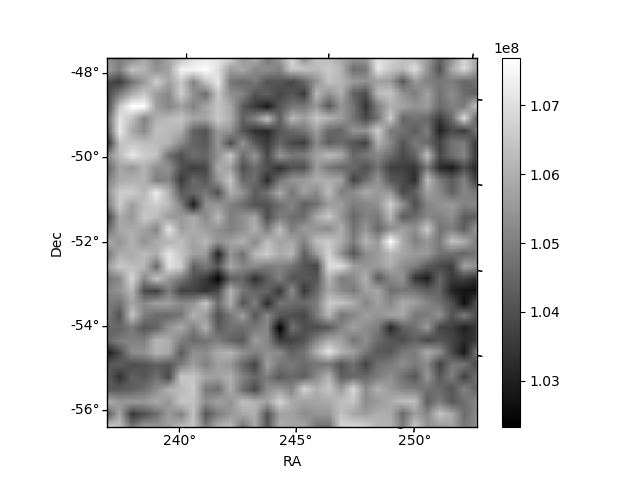
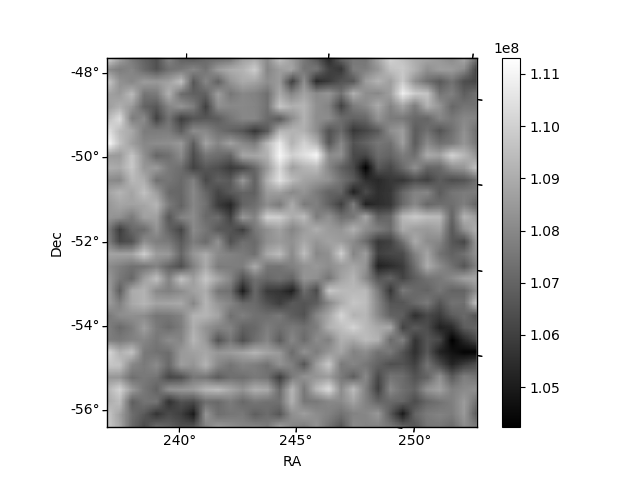
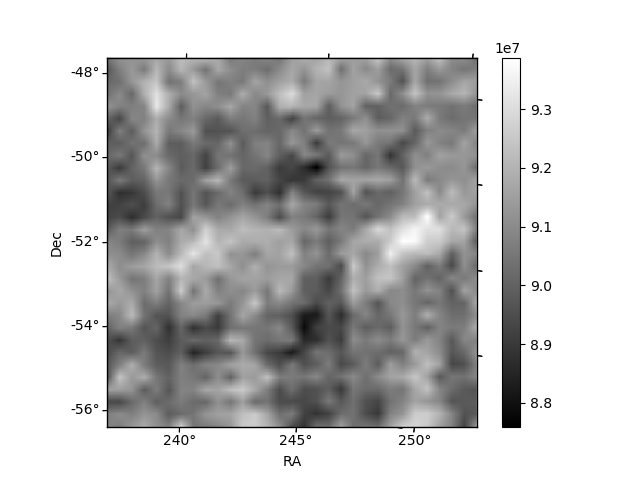
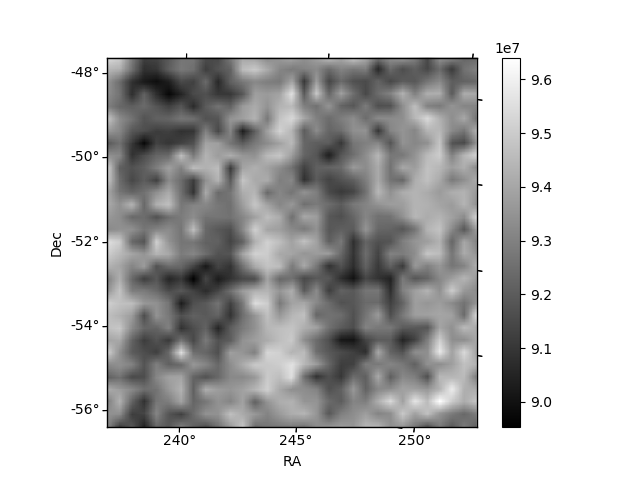
Histogram calculated using DETX and DETY for each event in the final _common_clean file
| Quadrant A | 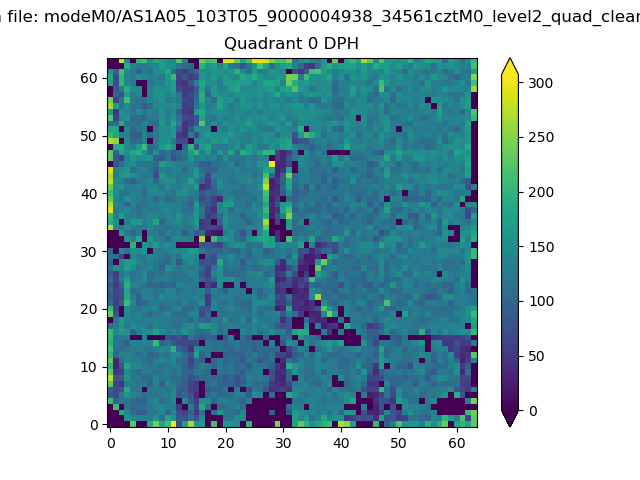 |
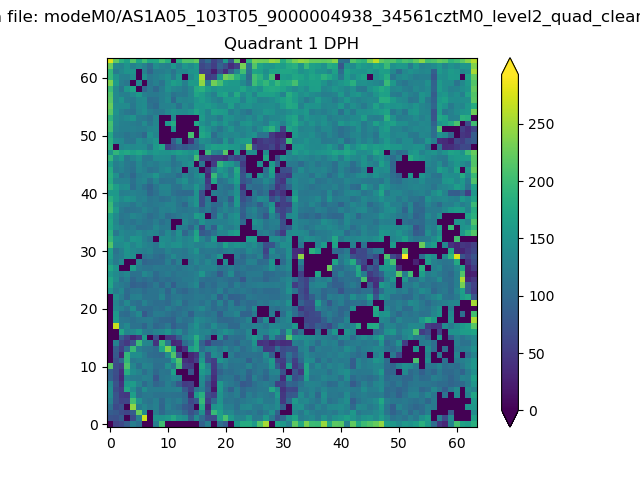 |
Quadrant B |
|---|---|---|---|
| Quadrant D | 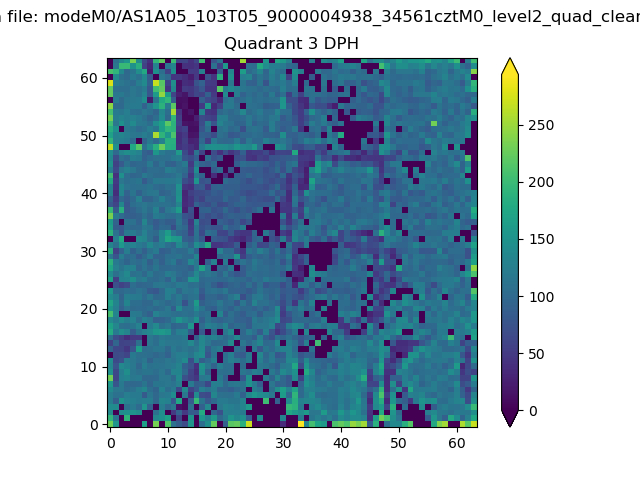 |
 |
Quadrant C |
| Plot type | Count rate plots | Images |
|---|---|---|
| Comparison with Poisson distribution Blue bars denote a histogram of data divided into 1 sec bins. Red curve is a Poisson curve with rate = median count rate of data. |
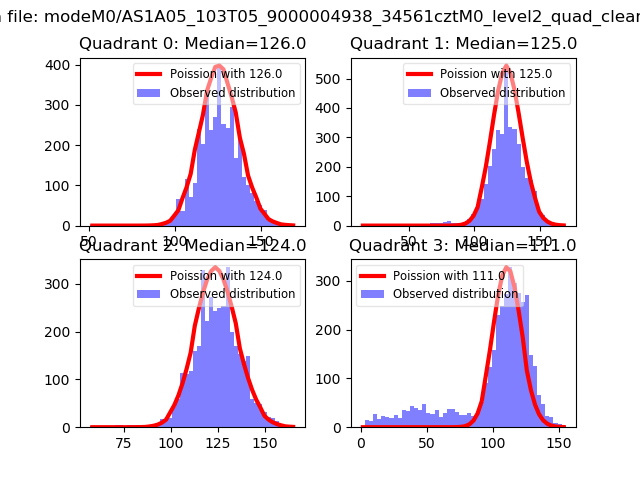 |
 |
| Quadrant-wise count rates Data is divided into 100 sec bins |
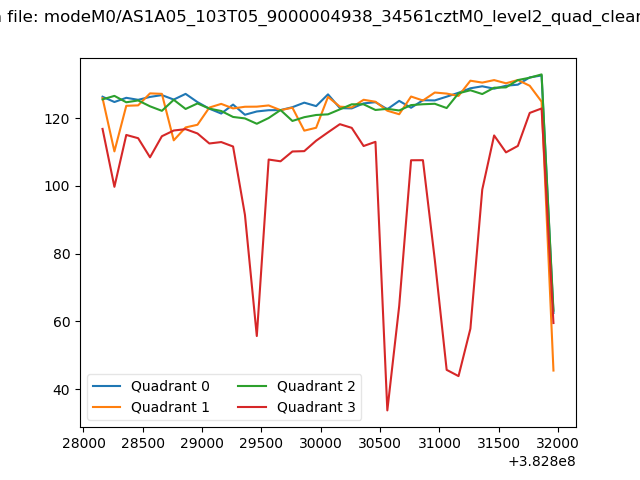 |
|
| Module-wise count rates for Quadrant A Data is divided into 100 sec bins |
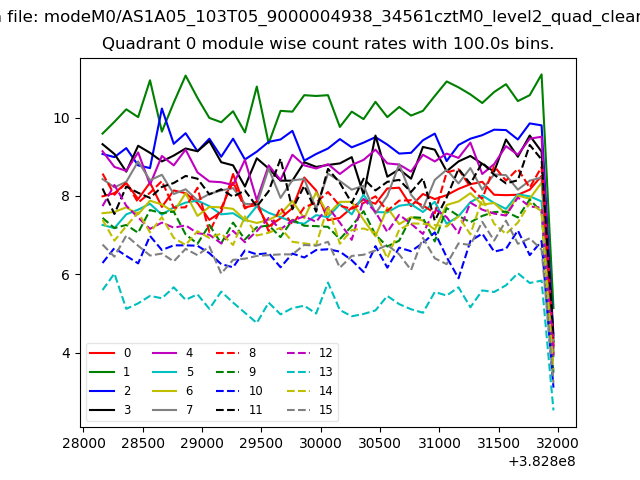 |
 |
| Module-wise count rates for Quadrant B Data is divided into 100 sec bins |
 |
 |
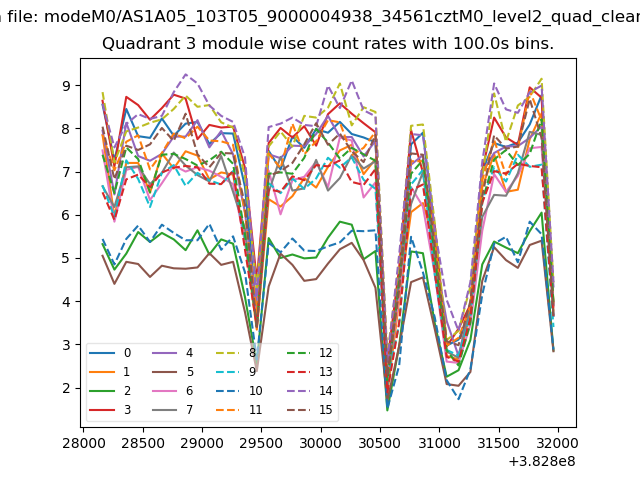
| Module-wise count rates for Quadrant C Data is divided into 100 sec bins |
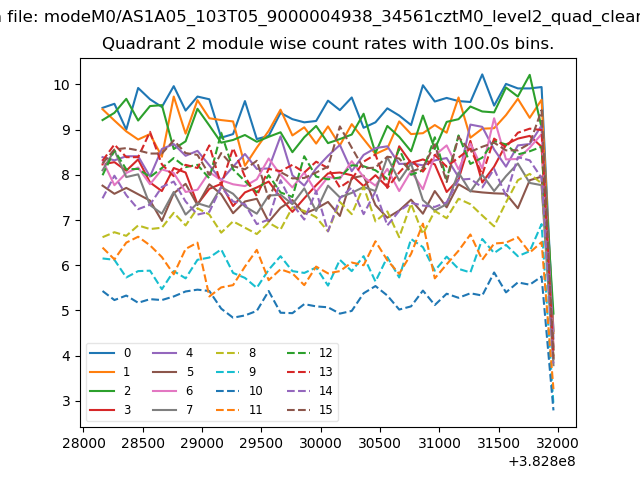 |
 |
| Module-wise count rates for Quadrant D Data is divided into 100 sec bins |
 |
 |
| Parameter | Plot |
|---|---|
| CZT HV Monitor | 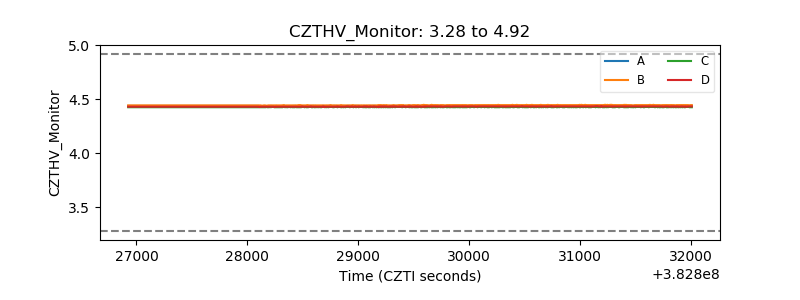 |
| D_VDD | 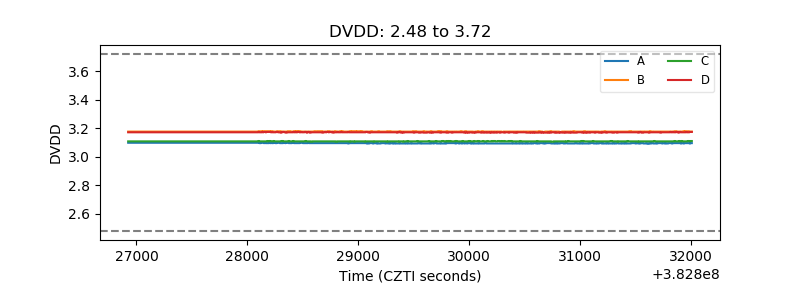 |
| Temperature 1 | 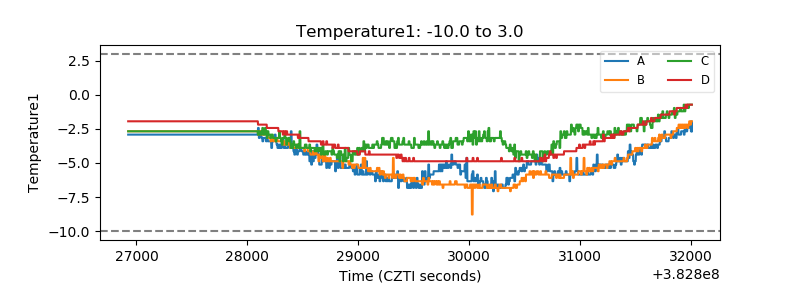 |
| Veto HV Monitor | 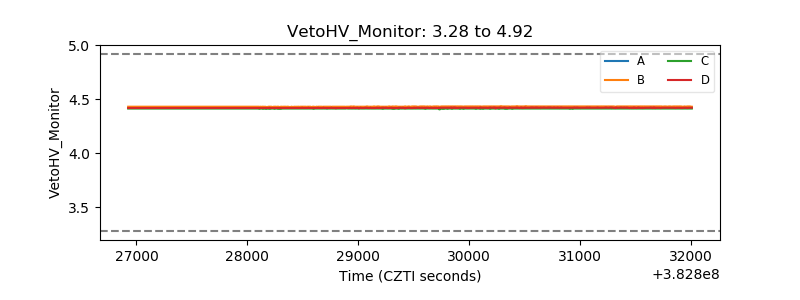 |
| Veto LLD | 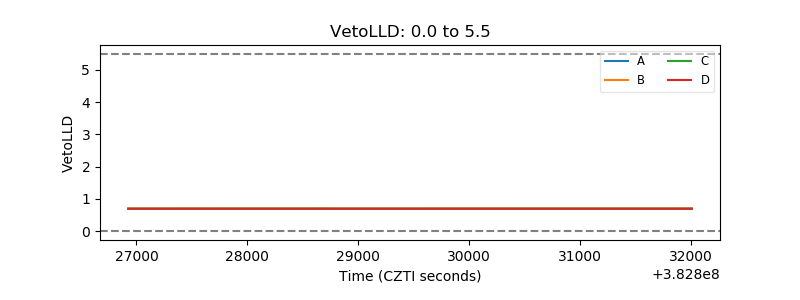 |
| Alpha Counter | 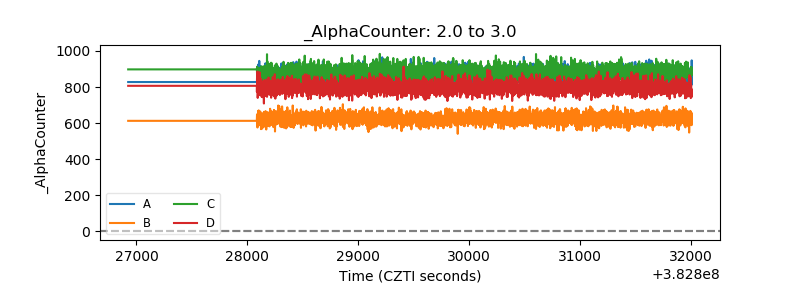 |
| _CPM_Rate | 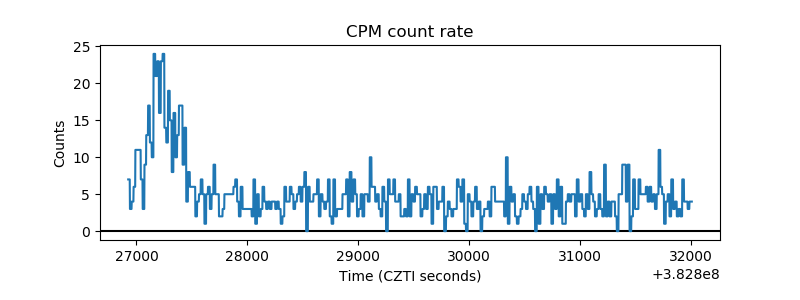 |
| CZT Counter | 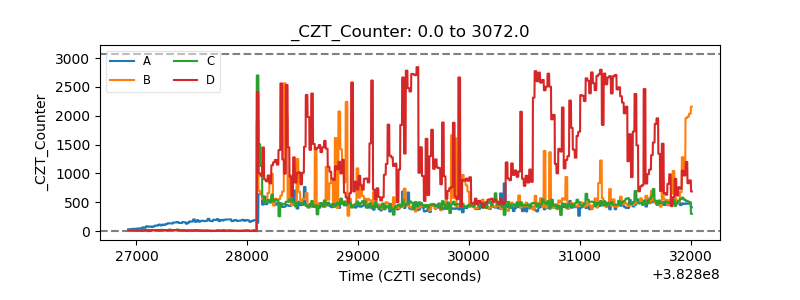 |
| +2.5 Volts monitor | 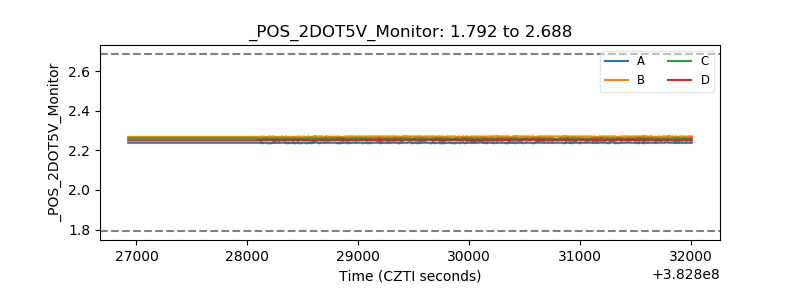 |
| +5 Volts monitor | 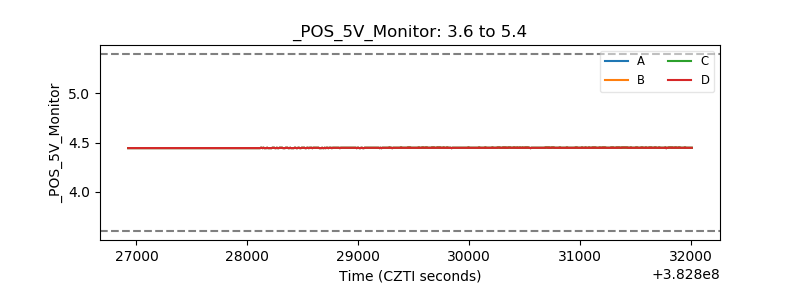 |
| _ROLL_ROT | 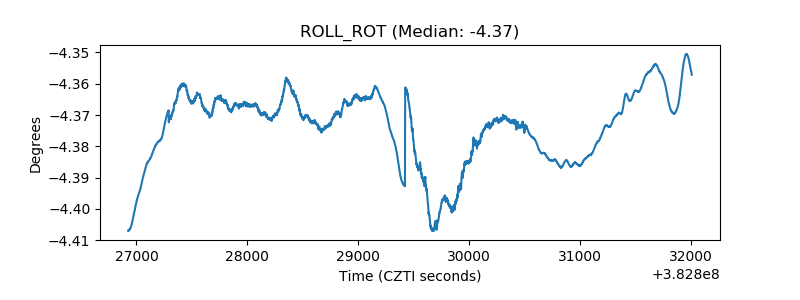 |
| _Roll_DEC | 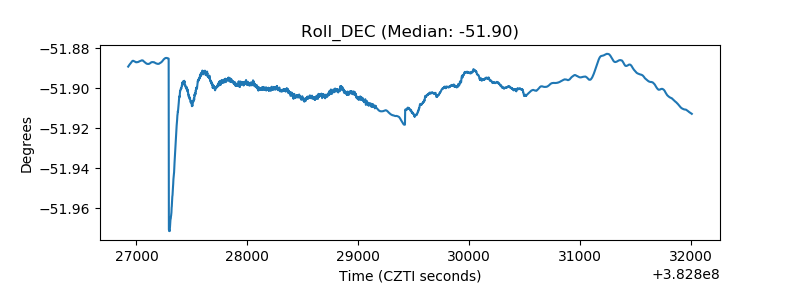 |
| _Roll_RA | 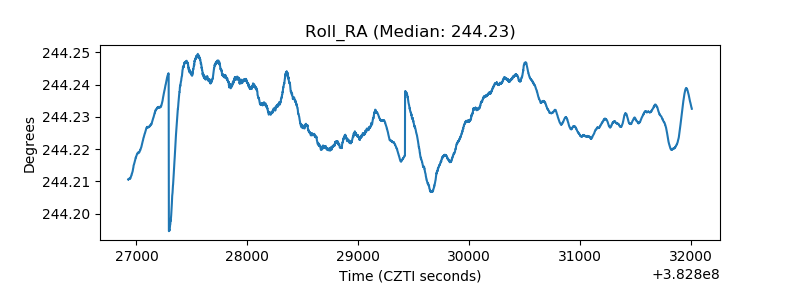 |
| Veto Counter | 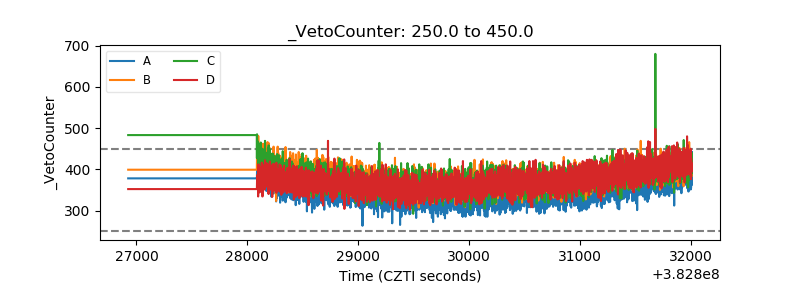 |