| Param | Original file | Final file |
|---|---|---|
| Filename | modeM0/AS1A05_103T05_9000004938_34558cztM0_level2.evt | modeM0/AS1A05_103T05_9000004938_34558cztM0_level2_quad_clean.evt |
| Size (bytes) | 563,993,280 | 90,774,720 |
| Size | 537.9 MB | 86.6 MB |
| Events in quadrant A | 2,780,303 | 604,653 |
| Events in quadrant B | 3,877,491 | 594,724 |
| Events in quadrant C | 2,992,504 | 596,227 |
| Events in quadrant D | 7,028,894 | 538,694 |
| Mode M9 | |||
|---|---|---|---|
| Quadrant | BADHDUFLAG | Total packets | Discarded packets |
| A | 0 | 23 | 0 |
| B | 0 | 23 | 0 |
| C | 0 | 23 | 0 |
| D | 0 | 24 | 0 |
| Mode SS | |||
|---|---|---|---|
| Quadrant | BADHDUFLAG | Total packets | Discarded packets |
| A | 0 | 122 | 0 |
| B | 0 | 122 | 0 |
| C | 0 | 122 | 0 |
| D | 0 | 122 | 0 |
| Mode M0 | |||
|---|---|---|---|
| Quadrant | BADHDUFLAG | Total packets | Discarded packets |
| A | 0 | 12186 | 3 |
| B | 0 | 15446 | 2 |
| C | 0 | 12344 | 2 |
| D | 0 | 25180 | 2 |
| Quadrant | Total seconds | Saturated seconds | Saturation percentage |
|---|---|---|---|
| A | 5928 | 11 | 0.185560% |
| B | 5928 | 225 | 3.795547% |
| C | 5928 | 25 | 0.421727% |
| D | 5928 | 626 | 10.560054% |
Noise dominated data is calculated using 1-second bins in cleaned event files. If a bin has >2000 counts, and if more than 50% of those come from <1% of pixels, then it is considered to be noise-dominated and hence unusable.
| Quadrant | # 1 sec bins | Bins with >0 counts | Bins with >2000 counts | High rate bins dominated by noise | Noise dominated (total time) | Noise dominated (detector-on time) | Marked lightcurve |
|---|---|---|---|---|---|---|---|
| A | 7241 | 5929 | 1 | 1 | 0.01% | 0.02% | 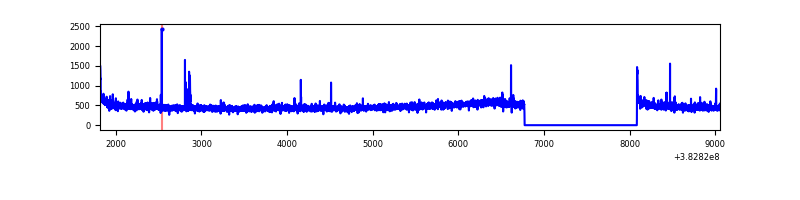 |
| B | 7241 | 5929 | 132 | 132 | 1.82% | 2.23% | 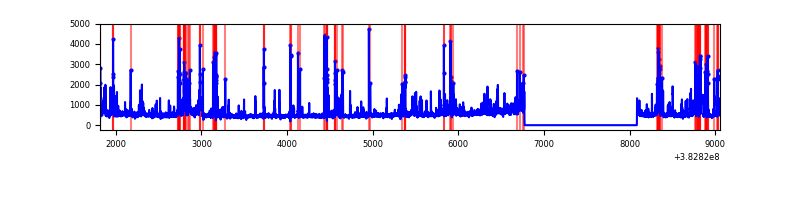 |
| C | 7241 | 5929 | 17 | 17 | 0.23% | 0.29% | 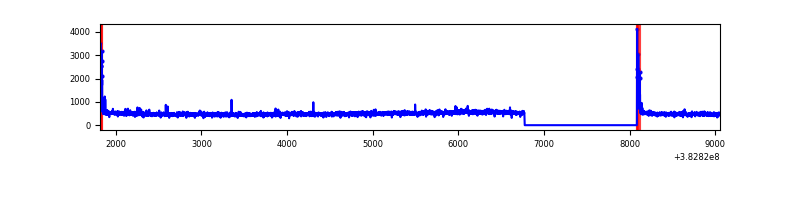 |
| D | 7241 | 5929 | 590 | 590 | 8.15% | 9.95% | 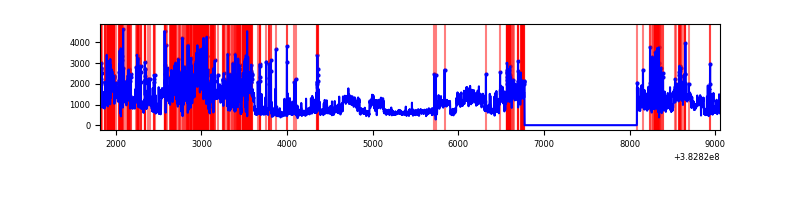 |
Top three noisy pixels from each quadrant. If the there are fewer than three noisy pixels in the level2.evt file, extra rows are filled as -1
| Pixel properties | Quadrant properties | ||||||
|---|---|---|---|---|---|---|---|
| Quadrant | DetID | PixID | Counts | Sigma | Mean | Median | Sigma |
| A | 10 | 83 | 46840 | 332.92 | 689 | 676 | 138.7 |
| A | 4 | 48 | 22730 | 159.05 | 689 | 676 | 138.7 |
| A | 9 | 143 | 18697 | 129.96 | 689 | 676 | 138.7 |
| B | 5 | 172 | 790165 | 6113.79 | 678 | 662 | 129.1 |
| B | 0 | 190 | 139260 | 1073.28 | 678 | 662 | 129.1 |
| B | 0 | 245 | 69338 | 531.82 | 678 | 662 | 129.1 |
| C | 15 | 214 | 249150 | 1583.6 | 671 | 676 | 156.9 |
| C | 0 | 10 | 88015 | 556.64 | 671 | 676 | 156.9 |
| C | 14 | 67 | 34611 | 216.28 | 671 | 676 | 156.9 |
| D | 8 | 195 | 2237055 | 13571.79 | 642 | 625 | 164.8 |
| D | 2 | 249 | 455871 | 2762.66 | 642 | 625 | 164.8 |
| D | 2 | 250 | 365764 | 2215.85 | 642 | 625 | 164.8 |
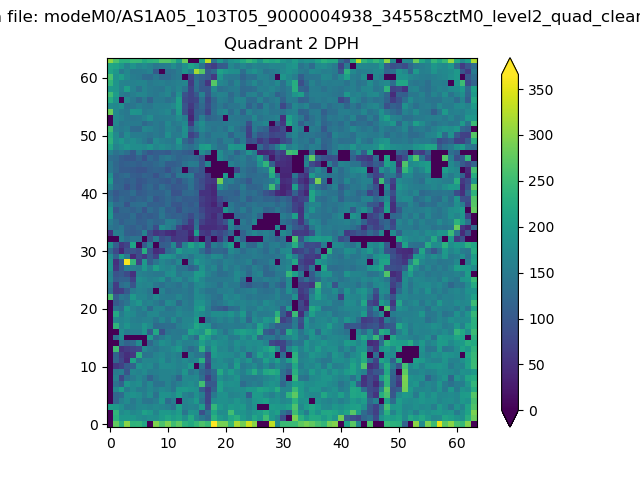
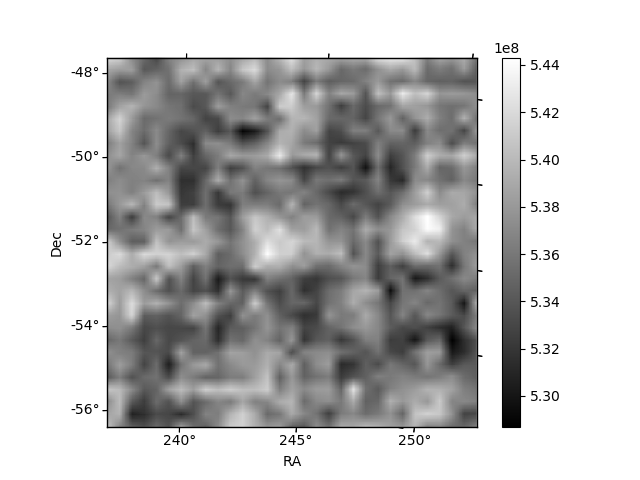
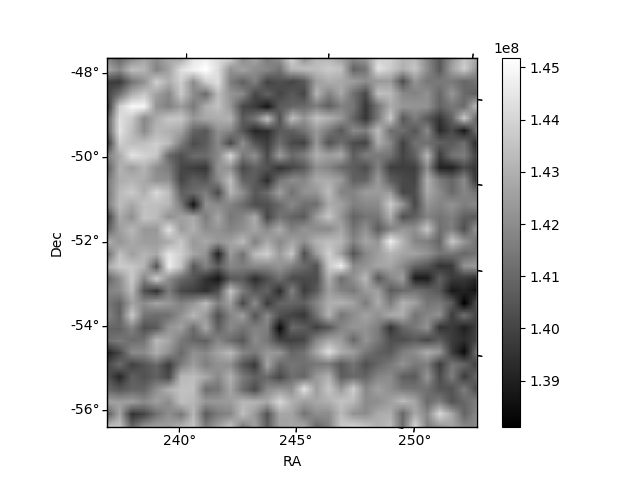
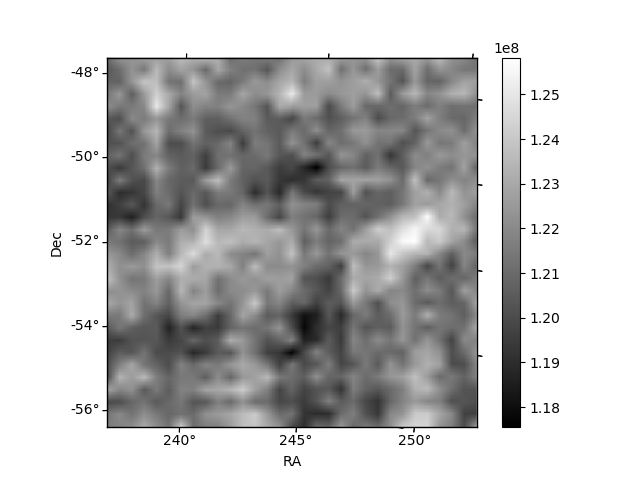
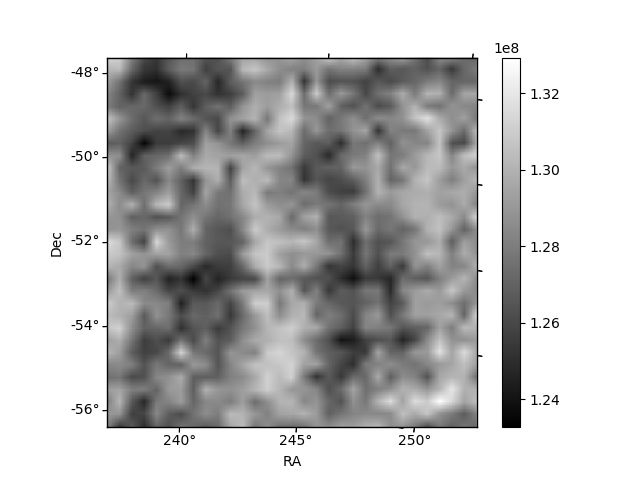
Histogram calculated using DETX and DETY for each event in the final _common_clean file
| Quadrant A | 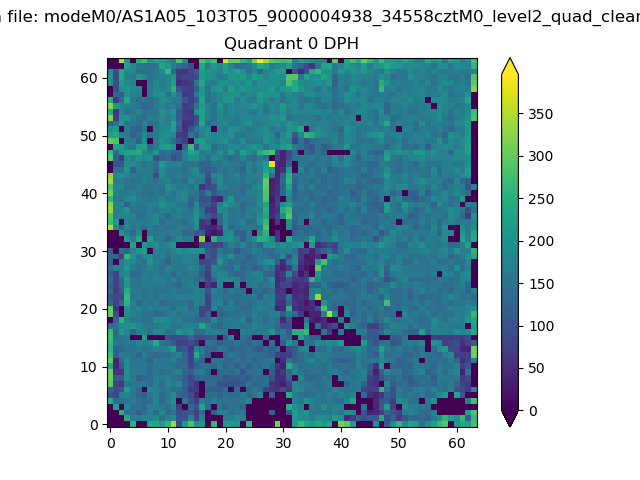 |
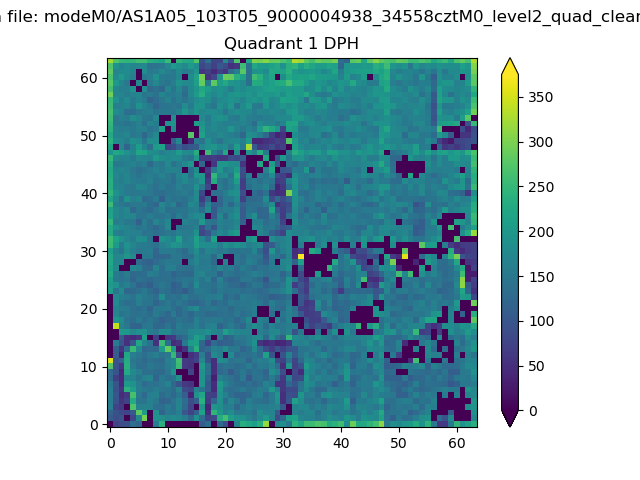 |
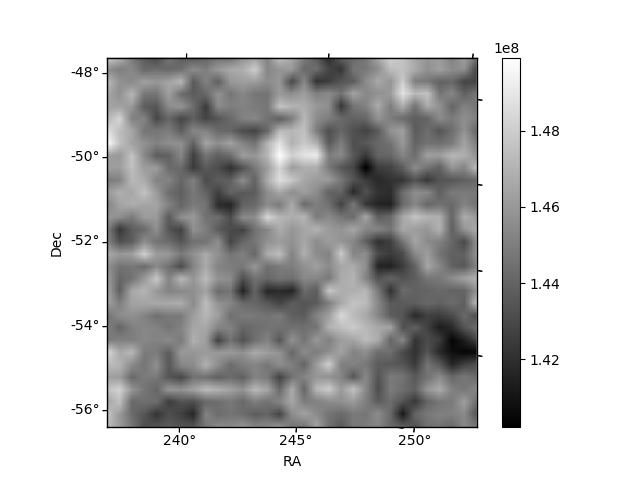
Quadrant B |
|---|---|---|---|
| Quadrant D | 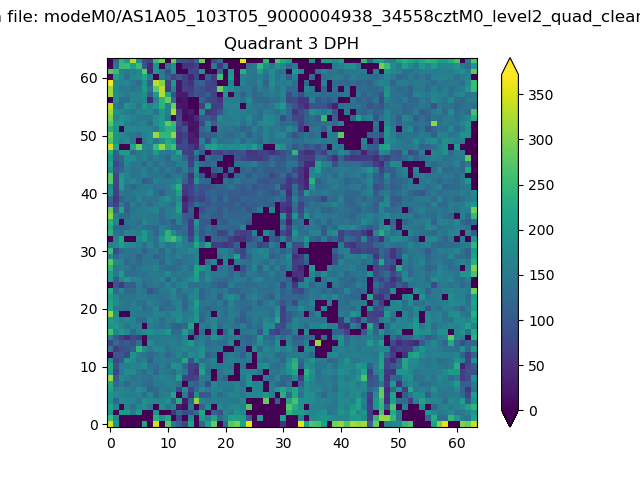 |
 |
Quadrant C |
| Plot type | Count rate plots | Images |
|---|---|---|
| Comparison with Poisson distribution Blue bars denote a histogram of data divided into 1 sec bins. Red curve is a Poisson curve with rate = median count rate of data. |
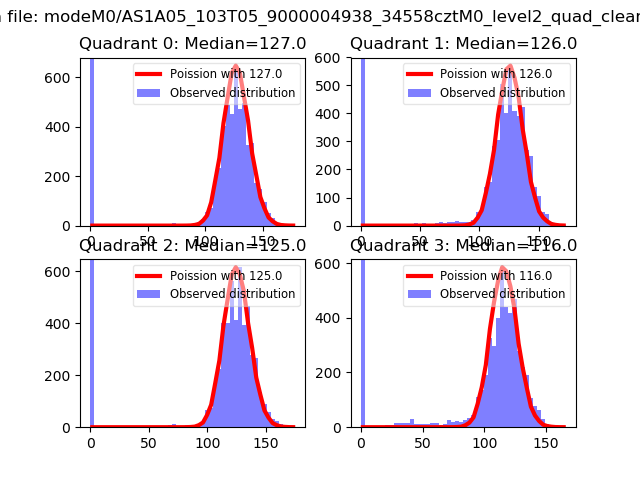 |
 |
| Quadrant-wise count rates Data is divided into 100 sec bins |
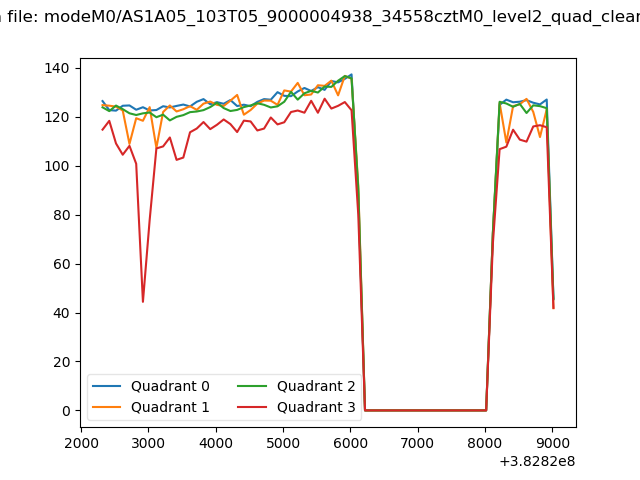 |
|
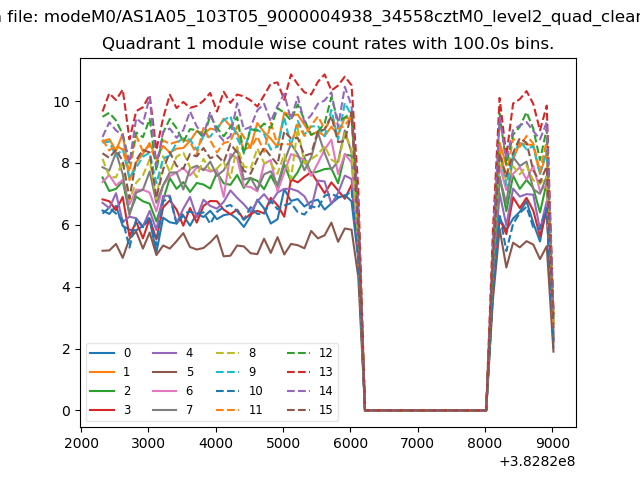
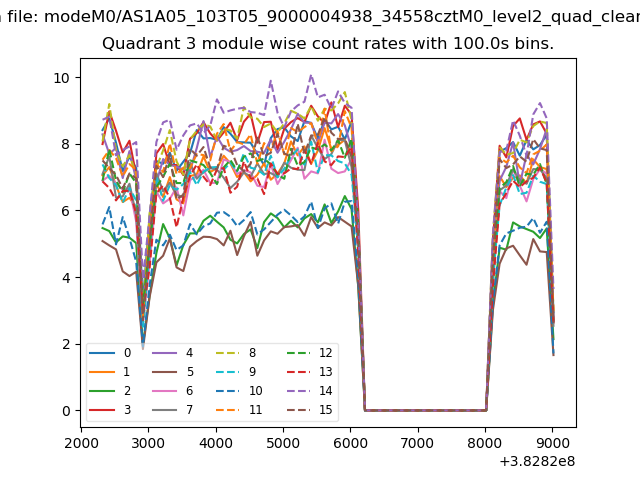
| Module-wise count rates for Quadrant A Data is divided into 100 sec bins |
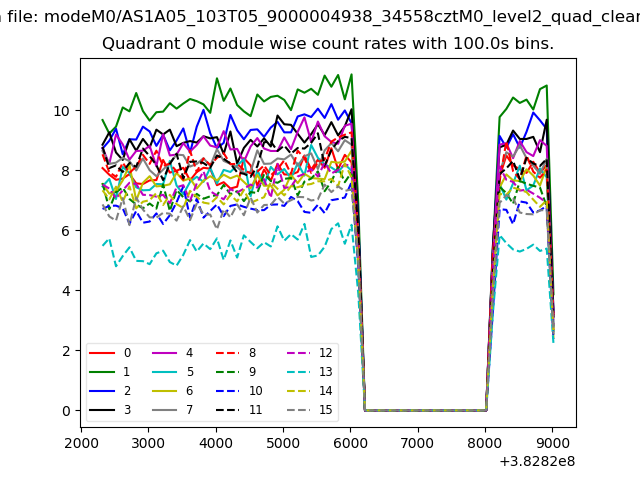 |
 |
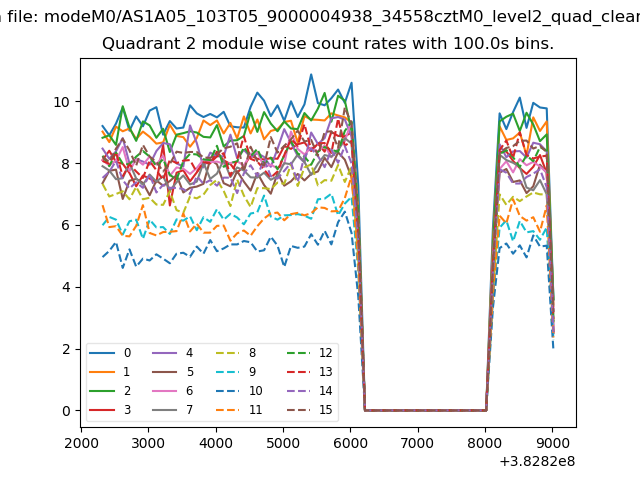
| Module-wise count rates for Quadrant B Data is divided into 100 sec bins |
 |
 |
| Module-wise count rates for Quadrant C Data is divided into 100 sec bins |
 |
 |
| Module-wise count rates for Quadrant D Data is divided into 100 sec bins |
 |
 |
| Parameter | Plot |
|---|---|
| CZT HV Monitor |  |
| D_VDD | 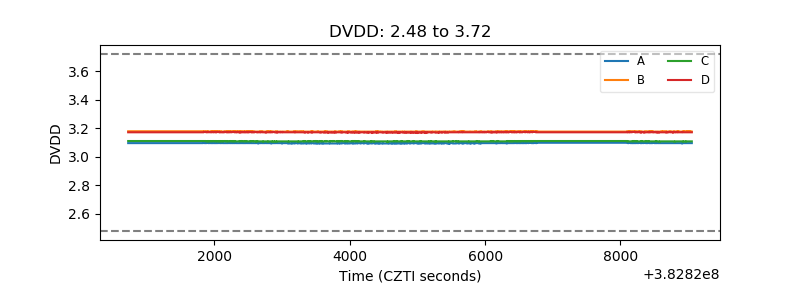 |
| Temperature 1 | 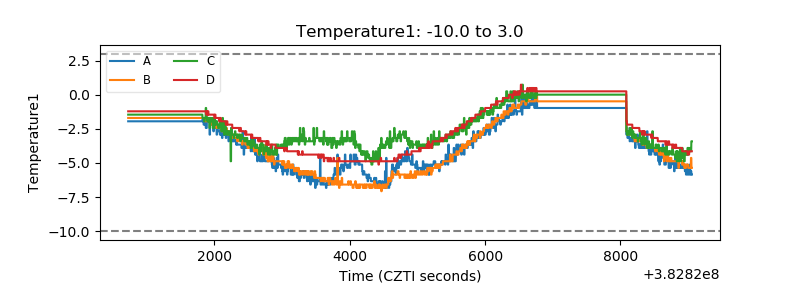 |
| Veto HV Monitor | 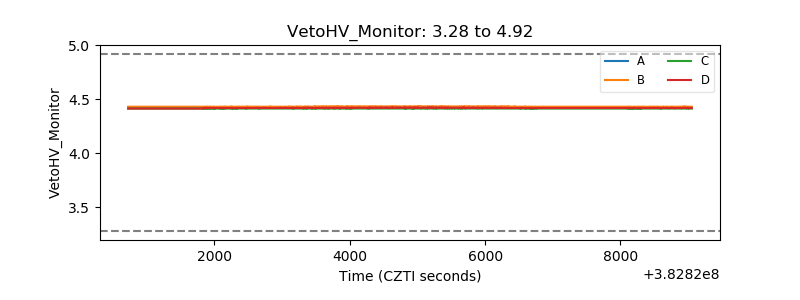 |
| Veto LLD | 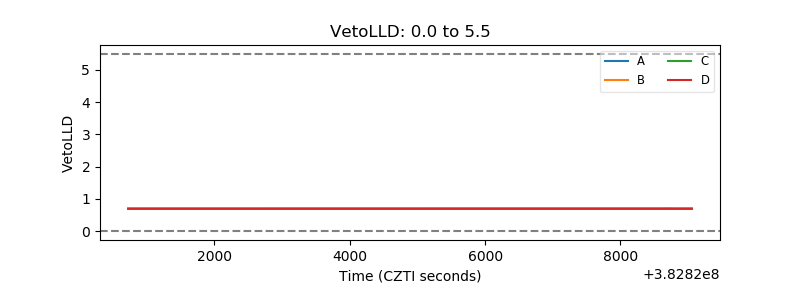 |
| Alpha Counter | 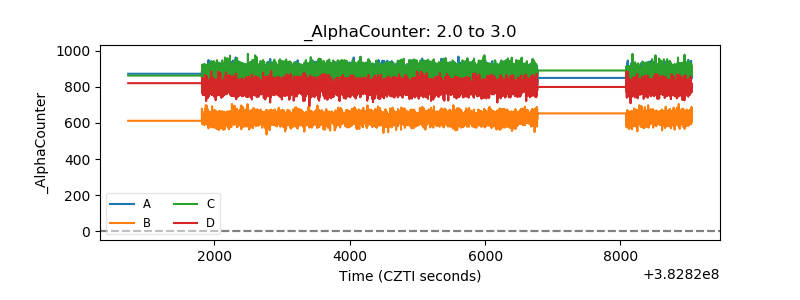 |
| _CPM_Rate | 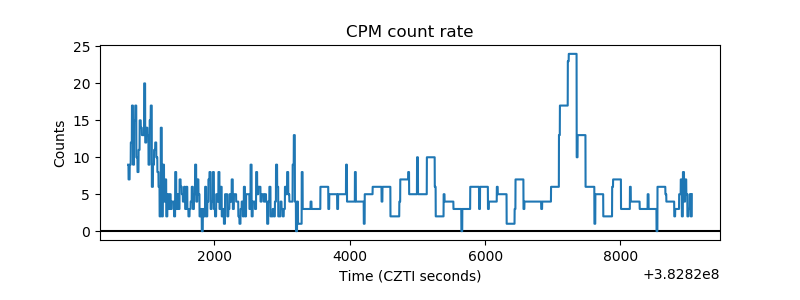 |
| CZT Counter | 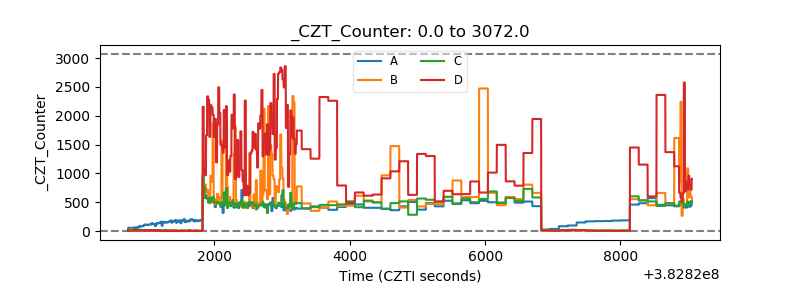 |
| +2.5 Volts monitor | 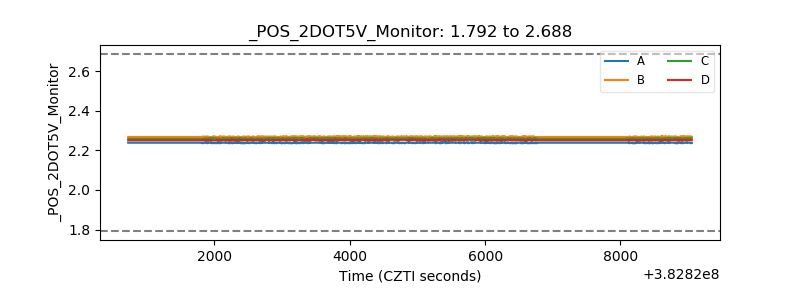 |
| +5 Volts monitor | 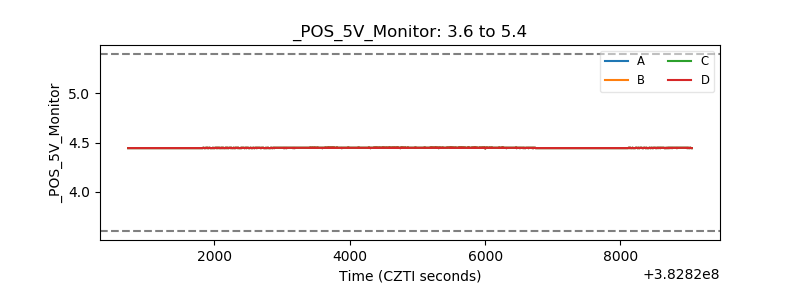 |
| _ROLL_ROT | 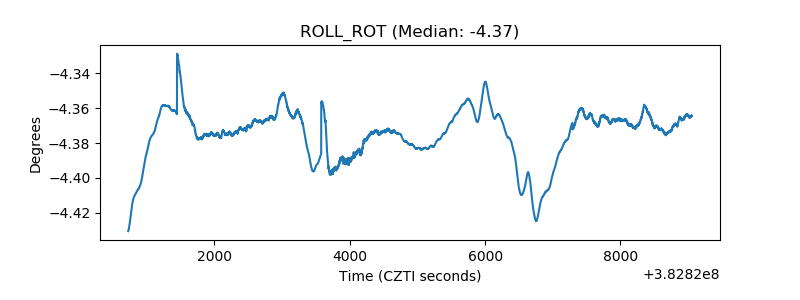 |
| _Roll_DEC | 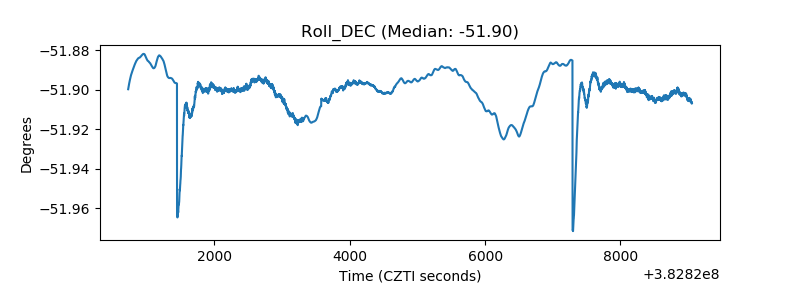 |
| _Roll_RA | 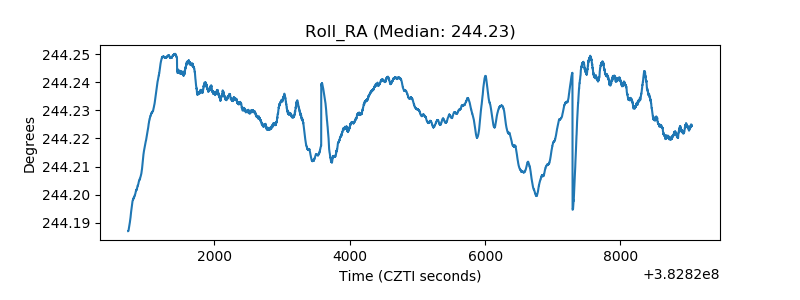 |
| Veto Counter | 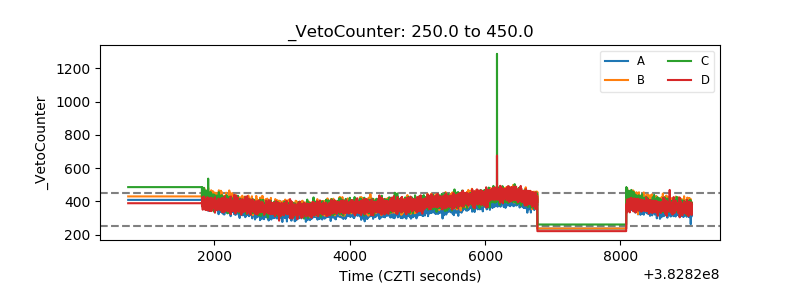 |