| Param | Original file | Final file |
|---|---|---|
| Filename | modeM0/AS1A05_103T05_9000004938_34557cztM0_level2.evt | modeM0/AS1A05_103T05_9000004938_34557cztM0_level2_quad_clean.evt |
| Size (bytes) | 541,149,120 | 83,278,080 |
| Size | 516.1 MB | 79.4 MB |
| Events in quadrant A | 2,829,706 | 547,044 |
| Events in quadrant B | 4,020,994 | 536,330 |
| Events in quadrant C | 2,936,355 | 539,766 |
| Events in quadrant D | 6,210,263 | 494,489 |
| Mode M9 | |||
|---|---|---|---|
| Quadrant | BADHDUFLAG | Total packets | Discarded packets |
| A | 0 | 23 | 0 |
| B | 0 | 23 | 0 |
| C | 0 | 23 | 0 |
| D | 0 | 24 | 0 |
| Mode SS | |||
|---|---|---|---|
| Quadrant | BADHDUFLAG | Total packets | Discarded packets |
| A | 0 | 118 | 0 |
| B | 0 | 118 | 0 |
| C | 0 | 118 | 0 |
| D | 0 | 118 | 0 |
| Mode M0 | |||
|---|---|---|---|
| Quadrant | BADHDUFLAG | Total packets | Discarded packets |
| A | 0 | 12270 | 3 |
| B | 0 | 15706 | 2 |
| C | 0 | 12110 | 2 |
| D | 0 | 22432 | 2 |
| Quadrant | Total seconds | Saturated seconds | Saturation percentage |
|---|---|---|---|
| A | 5778 | 52 | 0.899965% |
| B | 5778 | 378 | 6.542056% |
| C | 5778 | 25 | 0.432676% |
| D | 5778 | 511 | 8.843891% |
Noise dominated data is calculated using 1-second bins in cleaned event files. If a bin has >2000 counts, and if more than 50% of those come from <1% of pixels, then it is considered to be noise-dominated and hence unusable.
| Quadrant | # 1 sec bins | Bins with >0 counts | Bins with >2000 counts | High rate bins dominated by noise | Noise dominated (total time) | Noise dominated (detector-on time) | Marked lightcurve |
|---|---|---|---|---|---|---|---|
| A | 7150 | 5779 | 32 | 32 | 0.45% | 0.55% | 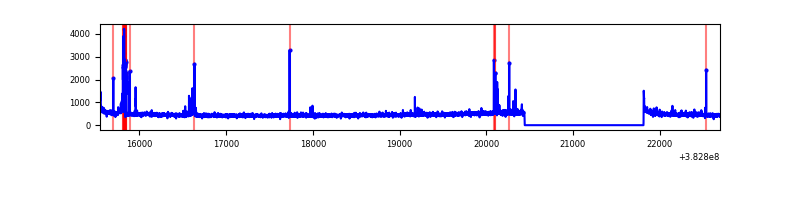 |
| B | 7150 | 5779 | 266 | 266 | 3.72% | 4.60% | 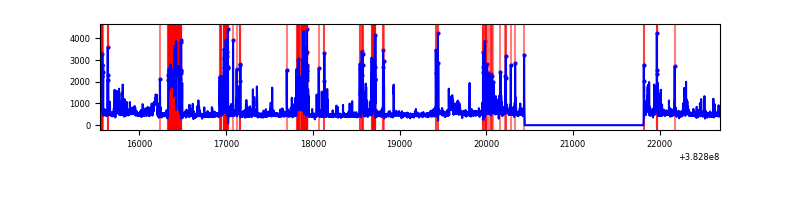 |
| C | 7150 | 5779 | 18 | 18 | 0.25% | 0.31% | 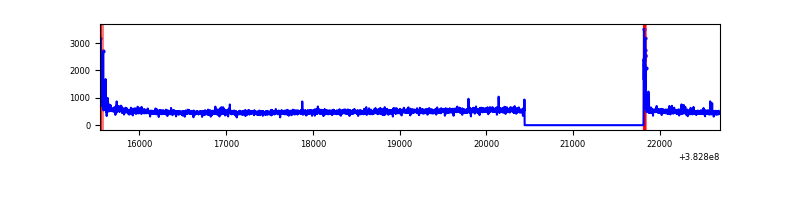 |
| D | 7150 | 5779 | 443 | 443 | 6.20% | 7.67% | 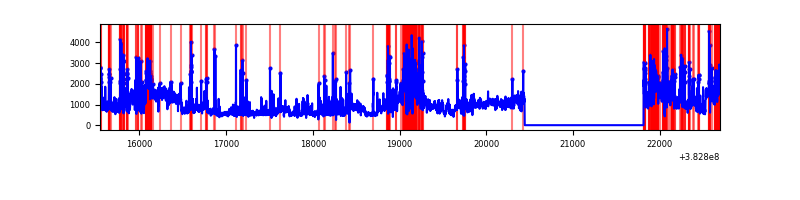 |
Top three noisy pixels from each quadrant. If the there are fewer than three noisy pixels in the level2.evt file, extra rows are filled as -1
| Pixel properties | Quadrant properties | ||||||
|---|---|---|---|---|---|---|---|
| Quadrant | DetID | PixID | Counts | Sigma | Mean | Median | Sigma |
| A | 9 | 143 | 148168 | 1090.68 | 668 | 655 | 135.2 |
| A | 10 | 83 | 45889 | 334.45 | 668 | 655 | 135.2 |
| A | 15 | 174 | 34556 | 250.66 | 668 | 655 | 135.2 |
| B | 5 | 172 | 954998 | 7718.4 | 650 | 635 | 123.6 |
| B | 0 | 245 | 148050 | 1192.22 | 650 | 635 | 123.6 |
| B | 0 | 229 | 110069 | 885.05 | 650 | 635 | 123.6 |
| C | 15 | 214 | 243585 | 1590.37 | 653 | 657 | 152.7 |
| C | 0 | 10 | 91877 | 597.19 | 653 | 657 | 152.7 |
| C | 14 | 67 | 46505 | 300.15 | 653 | 657 | 152.7 |
| D | 8 | 195 | 1717693 | 10812.7 | 627 | 611 | 158.8 |
| D | 7 | 38 | 597505 | 3758.72 | 627 | 611 | 158.8 |
| D | 7 | 80 | 542253 | 3410.79 | 627 | 611 | 158.8 |
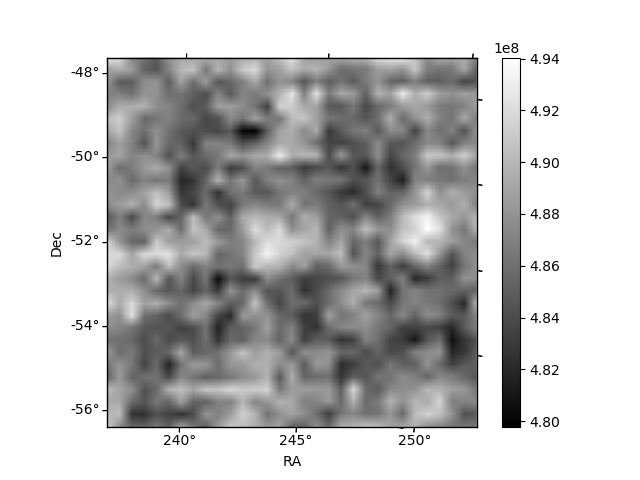
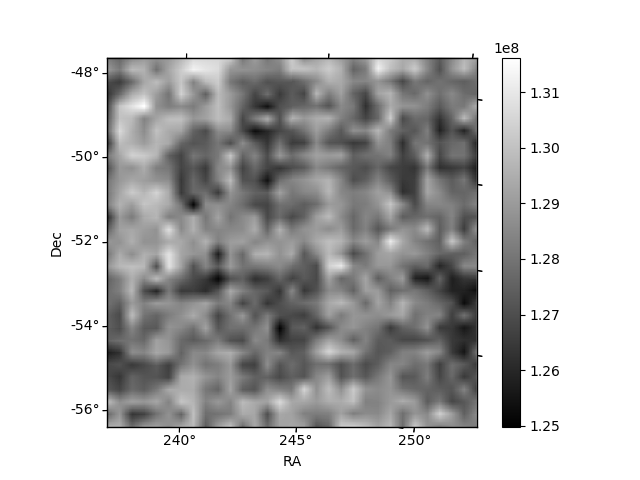
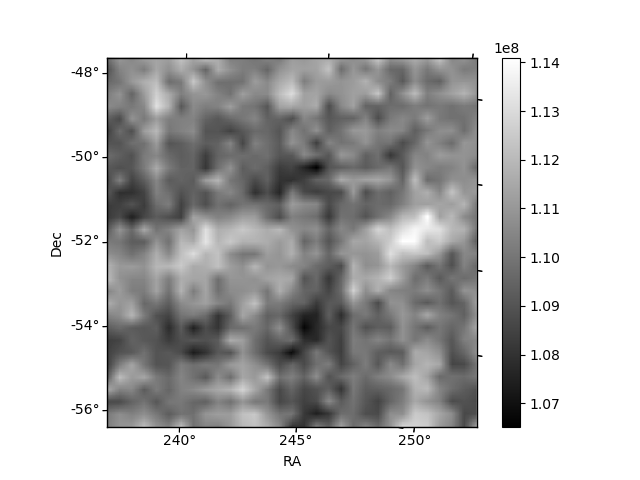
Histogram calculated using DETX and DETY for each event in the final _common_clean file
| Quadrant A | 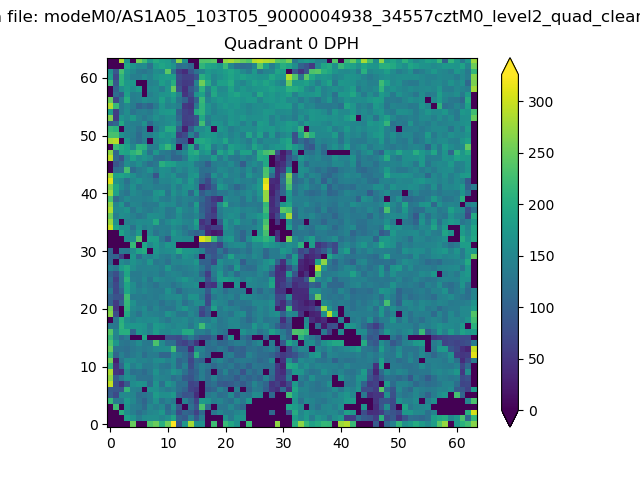 |
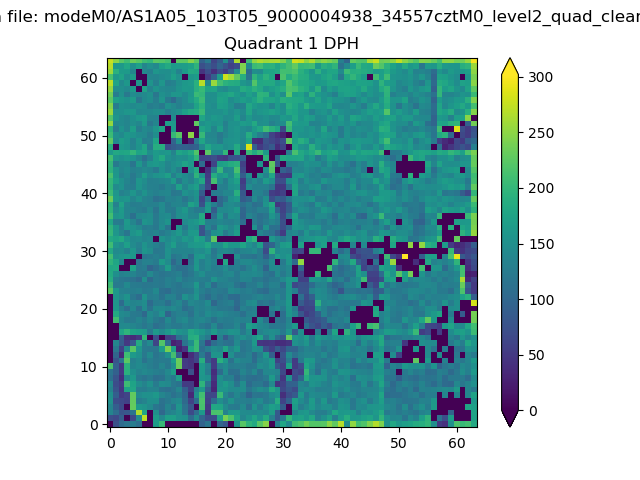 |
Quadrant B |
|---|---|---|---|
| Quadrant D | 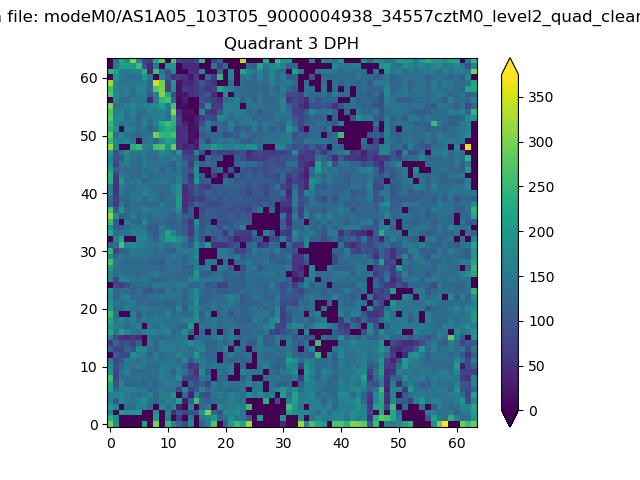 |
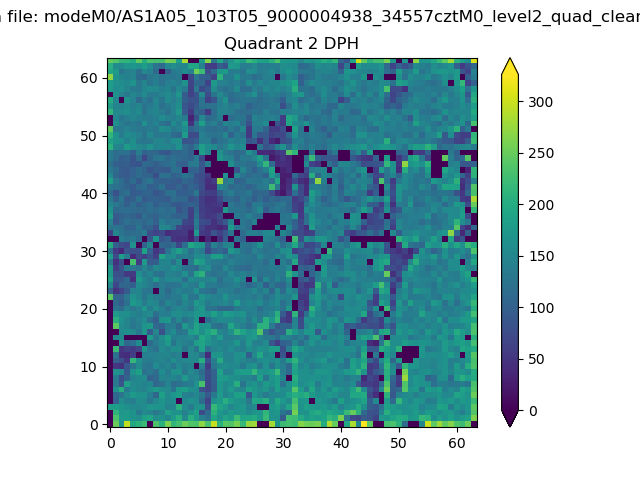 |
Quadrant C |
| Plot type | Count rate plots | Images |
|---|---|---|
| Comparison with Poisson distribution Blue bars denote a histogram of data divided into 1 sec bins. Red curve is a Poisson curve with rate = median count rate of data. |
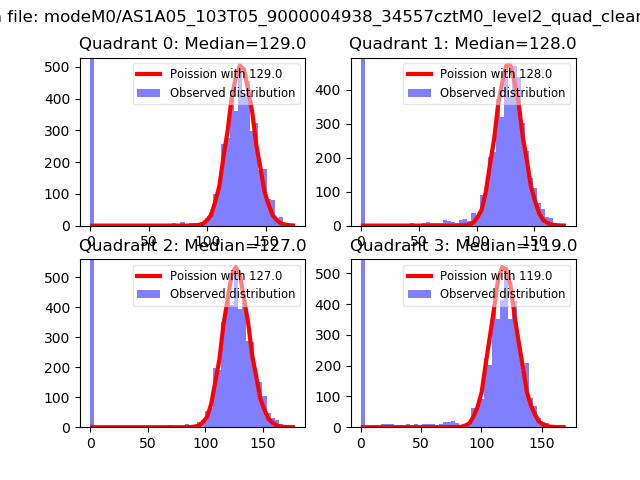 |
 |
| Quadrant-wise count rates Data is divided into 100 sec bins |
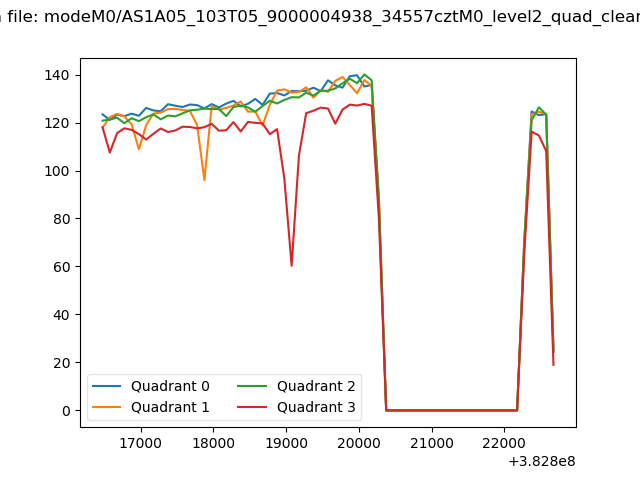 |
|
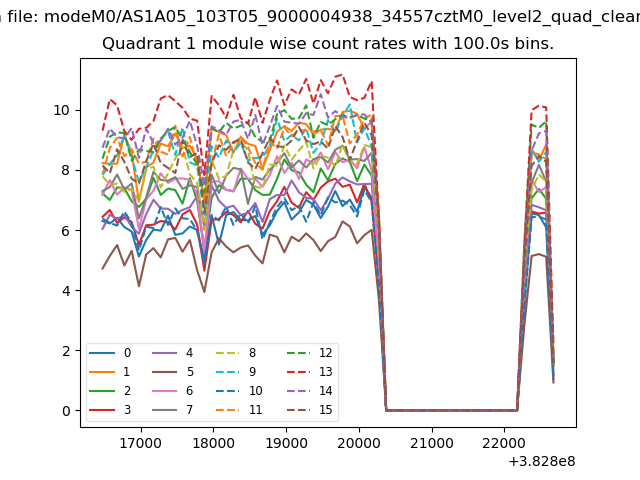
| Module-wise count rates for Quadrant A Data is divided into 100 sec bins |
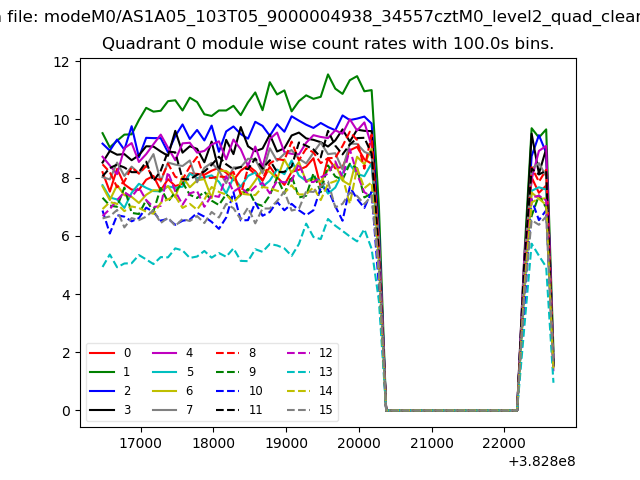 |
 |
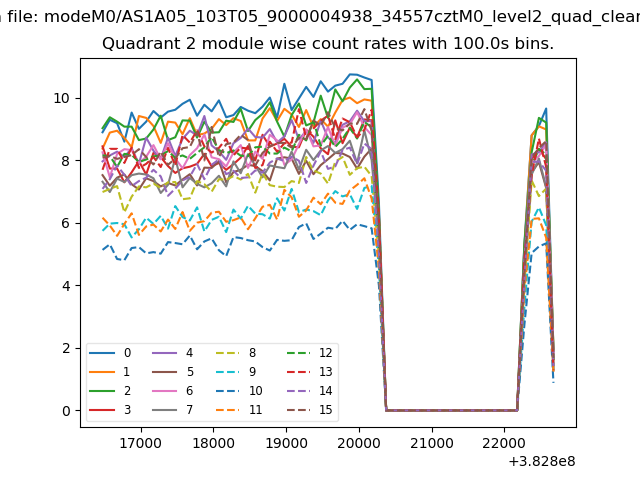
| Module-wise count rates for Quadrant B Data is divided into 100 sec bins |
 |
 |
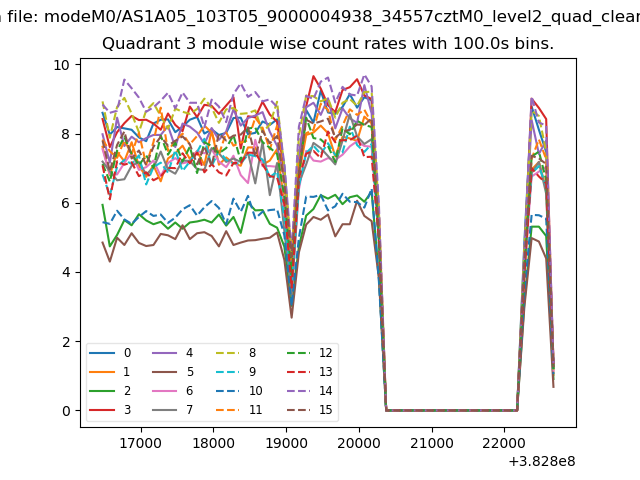
| Module-wise count rates for Quadrant C Data is divided into 100 sec bins |
 |
 |
| Module-wise count rates for Quadrant D Data is divided into 100 sec bins |
 |
 |
| Parameter | Plot |
|---|---|
| CZT HV Monitor | 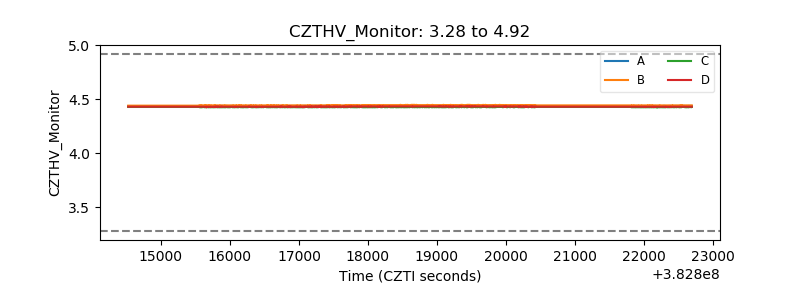 |
| D_VDD | 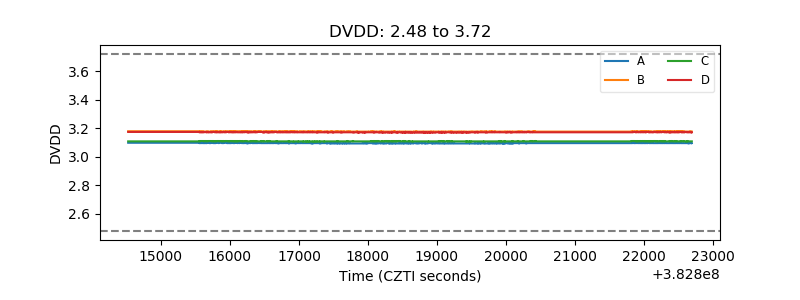 |
| Temperature 1 | 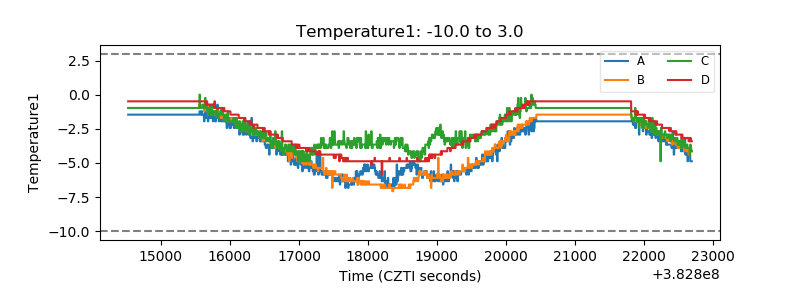 |
| Veto HV Monitor | 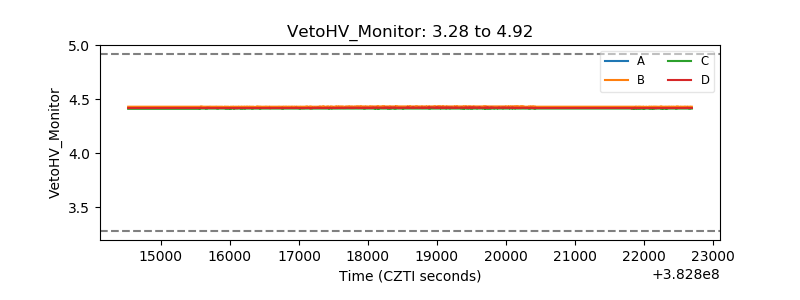 |
| Veto LLD | 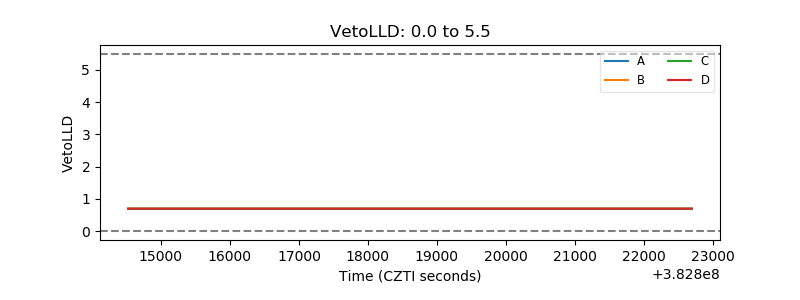 |
| Alpha Counter | 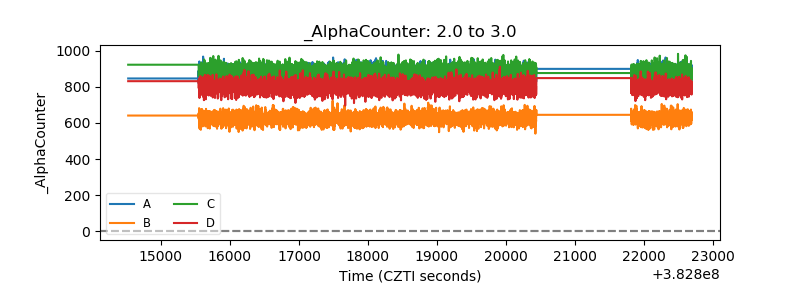 |
| _CPM_Rate | 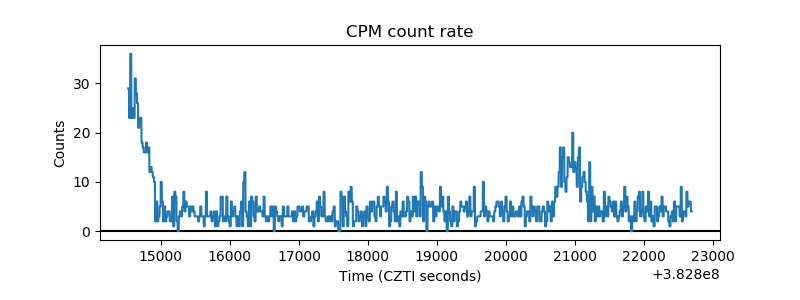 |
| CZT Counter | 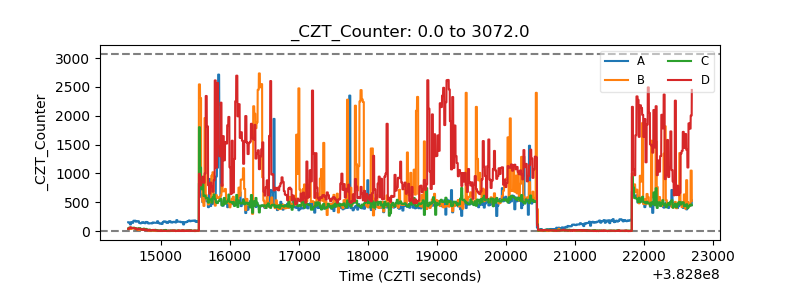 |
| +2.5 Volts monitor | 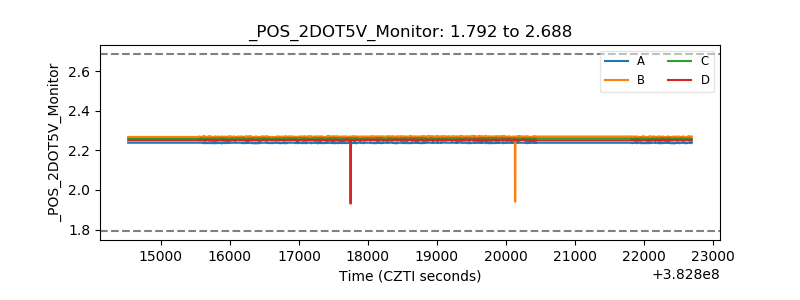 |
| +5 Volts monitor | 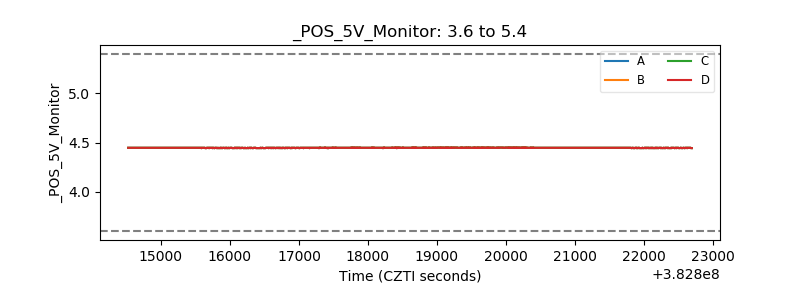 |
| _ROLL_ROT | 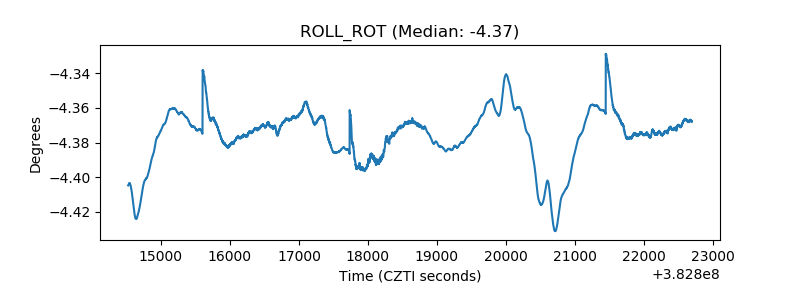 |
| _Roll_DEC | 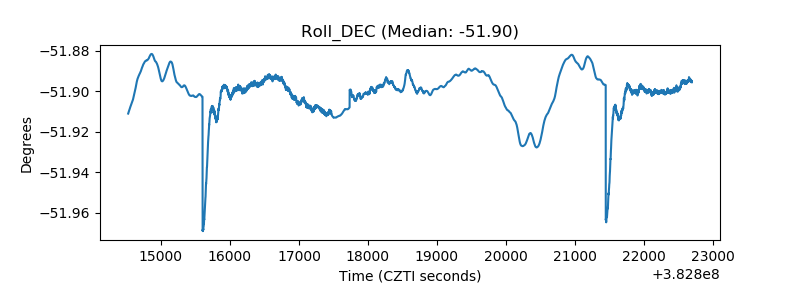 |
| _Roll_RA | 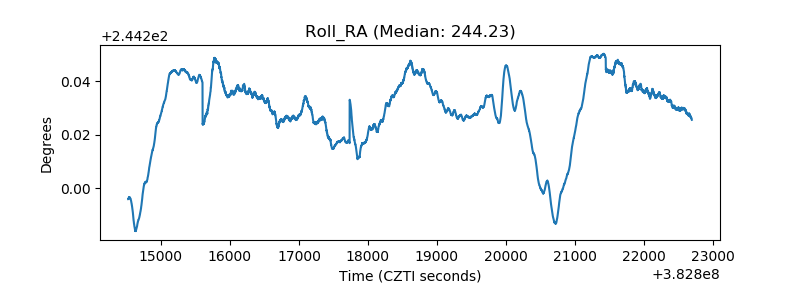 |
| Veto Counter | 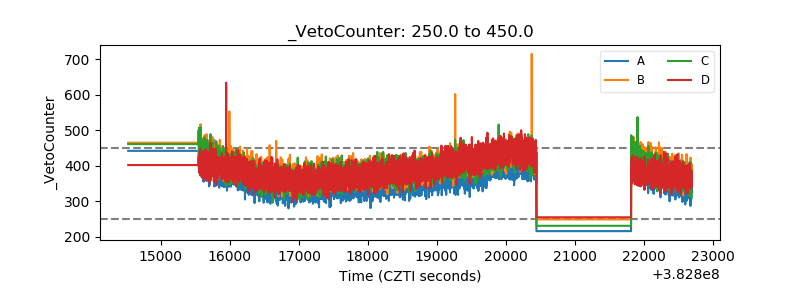 |