| Param | Original file | Final file |
|---|---|---|
| Filename | modeM0/AS1A05_103T05_9000004938_34556cztM0_level2.evt | modeM0/AS1A05_103T05_9000004938_34556cztM0_level2_quad_clean.evt |
| Size (bytes) | 923,523,840 | 116,763,840 |
| Size | 880.7 MB | 111.4 MB |
| Events in quadrant A | 4,784,670 | 745,121 |
| Events in quadrant B | 6,403,007 | 719,985 |
| Events in quadrant C | 5,011,711 | 731,366 |
| Events in quadrant D | 11,122,034 | 673,328 |
| Mode M9 | |||
|---|---|---|---|
| Quadrant | BADHDUFLAG | Total packets | Discarded packets |
| A | 0 | 47 | 0 |
| B | 0 | 47 | 0 |
| C | 0 | 47 | 0 |
| D | 0 | 47 | 0 |
| Mode SS | |||
|---|---|---|---|
| Quadrant | BADHDUFLAG | Total packets | Discarded packets |
| A | 0 | 194 | 0 |
| B | 0 | 194 | 0 |
| C | 0 | 194 | 0 |
| D | 0 | 194 | 0 |
| Mode M0 | |||
|---|---|---|---|
| Quadrant | BADHDUFLAG | Total packets | Discarded packets |
| A | 0 | 20261 | 4 |
| B | 0 | 24900 | 3 |
| C | 0 | 20321 | 3 |
| D | 0 | 39970 | 3 |
| Quadrant | Total seconds | Saturated seconds | Saturation percentage |
|---|---|---|---|
| A | 9615 | 60 | 0.624025% |
| B | 9615 | 491 | 5.106604% |
| C | 9615 | 32 | 0.332813% |
| D | 9615 | 874 | 9.089964% |
Noise dominated data is calculated using 1-second bins in cleaned event files. If a bin has >2000 counts, and if more than 50% of those come from <1% of pixels, then it is considered to be noise-dominated and hence unusable.
| Quadrant | # 1 sec bins | Bins with >0 counts | Bins with >2000 counts | High rate bins dominated by noise | Noise dominated (total time) | Noise dominated (detector-on time) | Marked lightcurve |
|---|---|---|---|---|---|---|---|
| A | 19651 | 9617 | 30 | 30 | 0.15% | 0.31% | 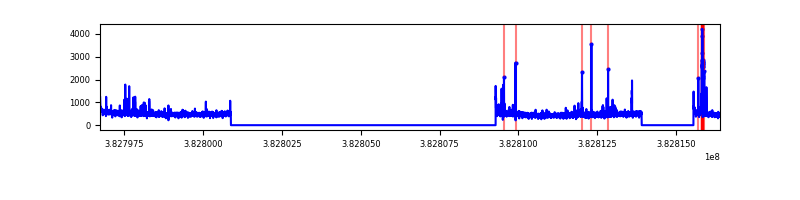 |
| B | 19651 | 9617 | 332 | 332 | 1.69% | 3.45% | 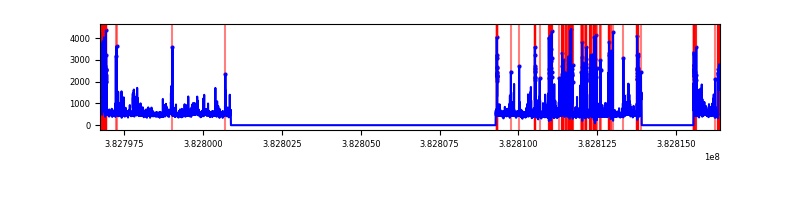 |
| C | 19651 | 9617 | 20 | 20 | 0.10% | 0.21% | 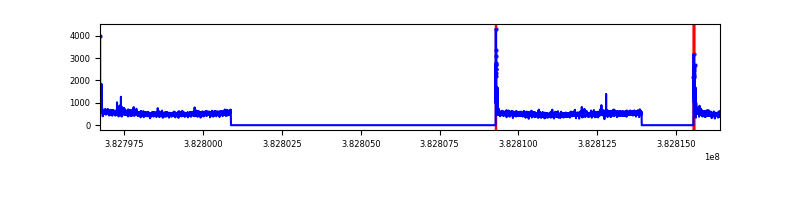 |
| D | 19651 | 9617 | 766 | 766 | 3.90% | 7.97% | 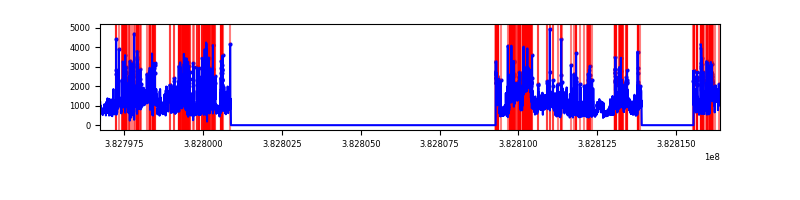 |
Top three noisy pixels from each quadrant. If the there are fewer than three noisy pixels in the level2.evt file, extra rows are filled as -1
| Pixel properties | Quadrant properties | ||||||
|---|---|---|---|---|---|---|---|
| Quadrant | DetID | PixID | Counts | Sigma | Mean | Median | Sigma |
| A | 9 | 143 | 184477 | 794.21 | 1157 | 1137 | 230.8 |
| A | 10 | 83 | 69568 | 296.44 | 1157 | 1137 | 230.8 |
| A | 0 | 31 | 35824 | 150.26 | 1157 | 1137 | 230.8 |
| B | 5 | 172 | 1234413 | 5856.58 | 1125 | 1098 | 210.6 |
| B | 0 | 229 | 271089 | 1282.09 | 1125 | 1098 | 210.6 |
| B | 15 | 201 | 87952 | 412.44 | 1125 | 1098 | 210.6 |
| C | 15 | 214 | 404259 | 1574.6 | 1119 | 1130 | 256.0 |
| C | 0 | 10 | 121889 | 471.68 | 1119 | 1130 | 256.0 |
| C | 14 | 67 | 90060 | 347.35 | 1119 | 1130 | 256.0 |
| D | 8 | 195 | 3804086 | 13741.19 | 1086 | 1061 | 276.8 |
| D | 1 | 47 | 642859 | 2318.96 | 1086 | 1061 | 276.8 |
| D | 7 | 38 | 622802 | 2246.49 | 1086 | 1061 | 276.8 |
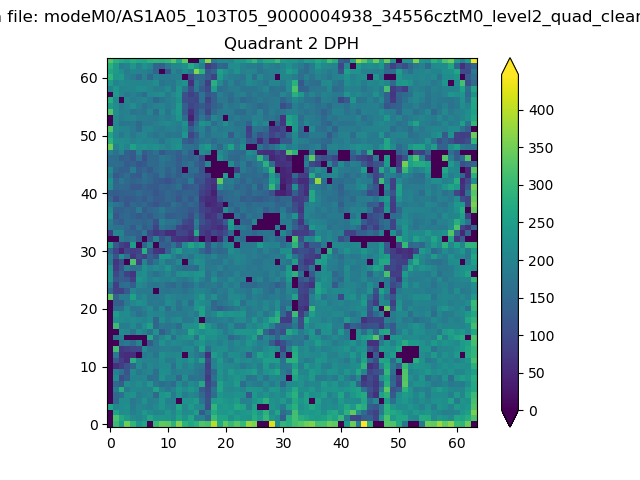
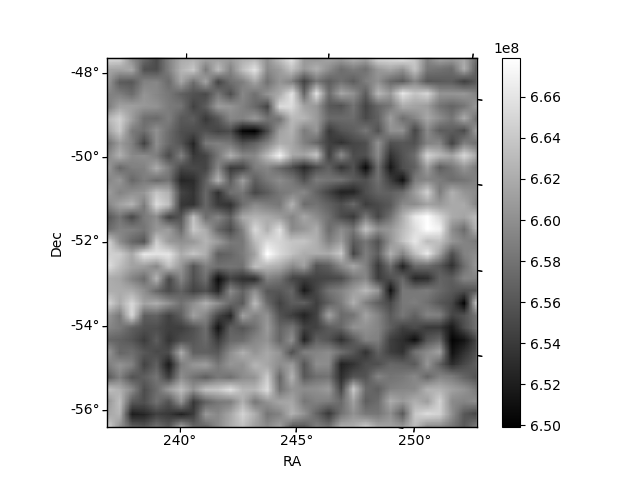
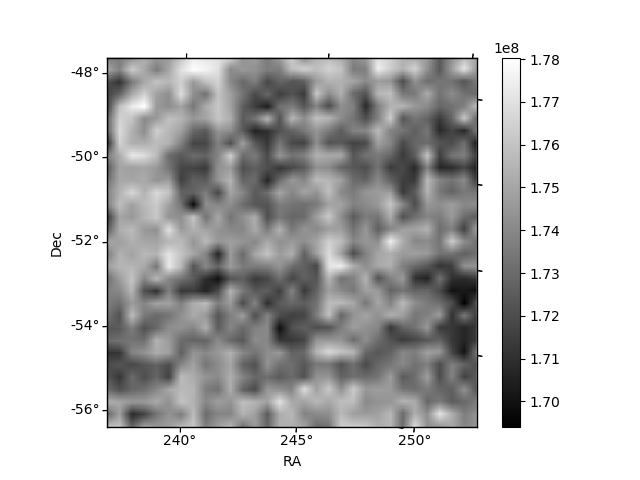
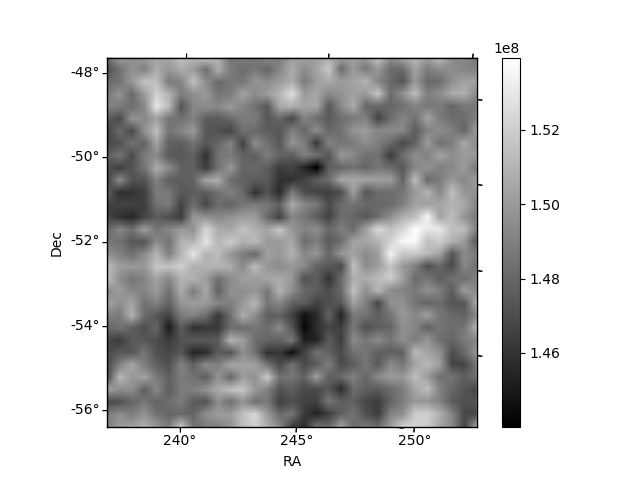
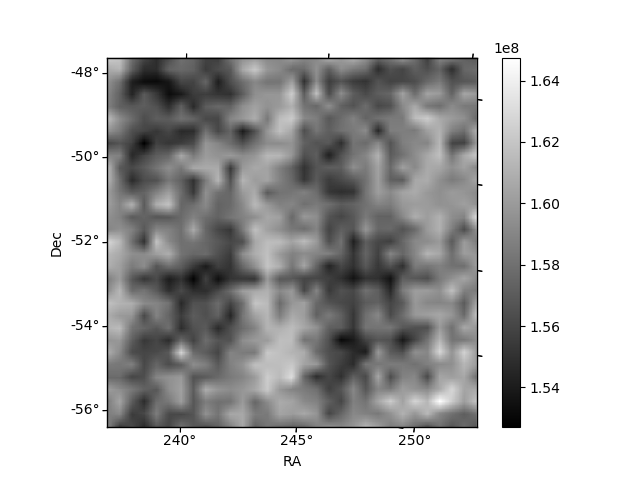
Histogram calculated using DETX and DETY for each event in the final _common_clean file
| Quadrant A | 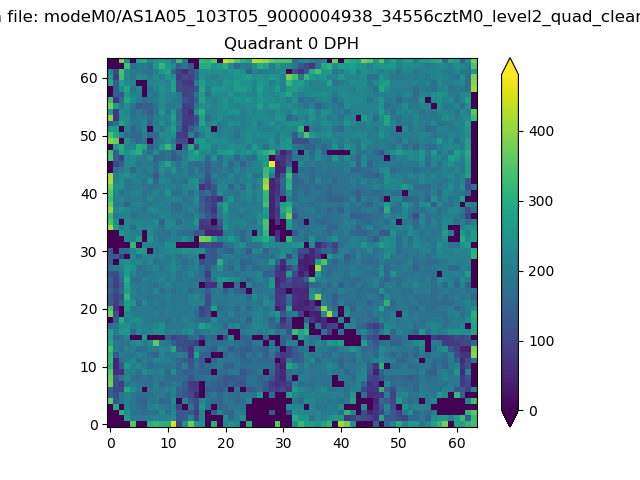 |
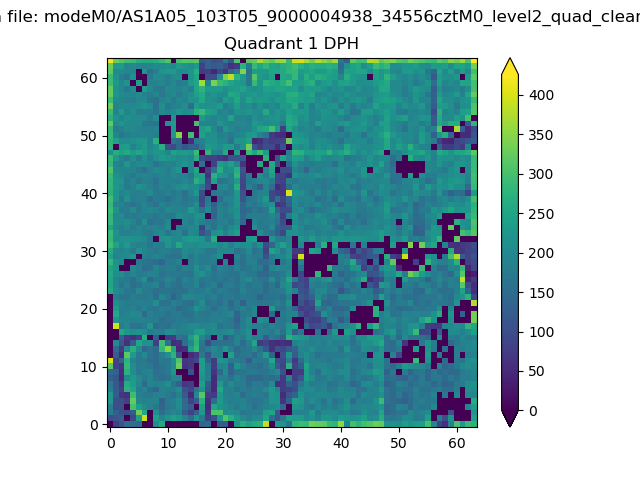 |
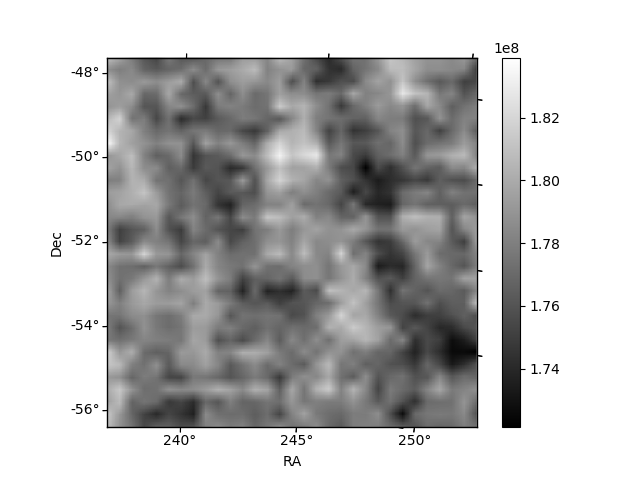
Quadrant B |
|---|---|---|---|
| Quadrant D | 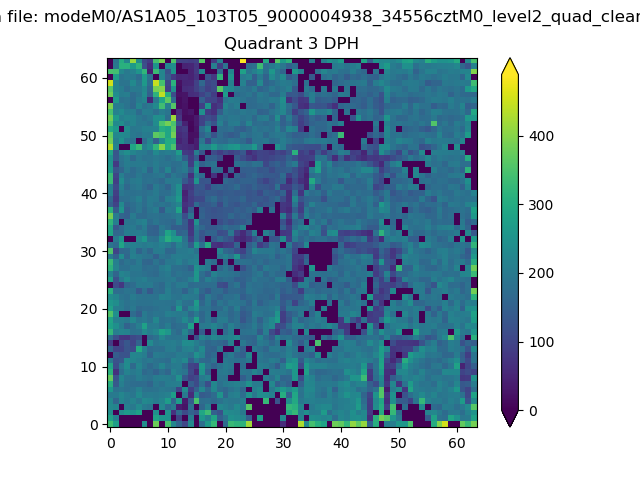 |
 |
Quadrant C |
| Plot type | Count rate plots | Images |
|---|---|---|
| Comparison with Poisson distribution Blue bars denote a histogram of data divided into 1 sec bins. Red curve is a Poisson curve with rate = median count rate of data. |
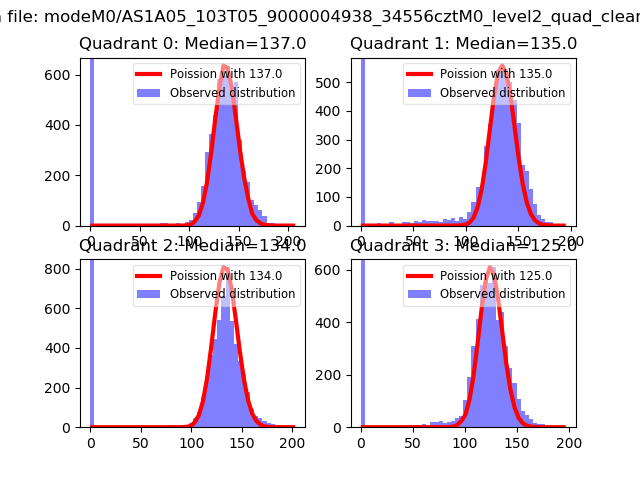 |
 |
| Quadrant-wise count rates Data is divided into 100 sec bins |
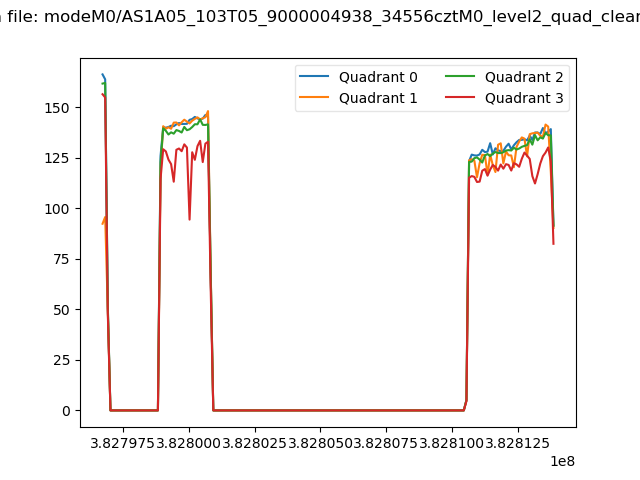 |
|
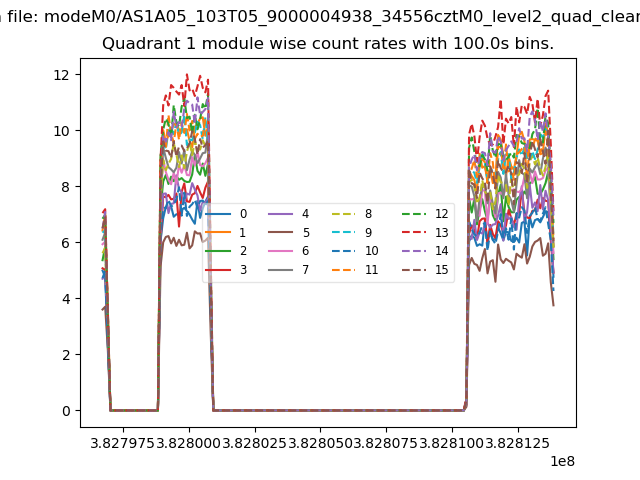
| Module-wise count rates for Quadrant A Data is divided into 100 sec bins |
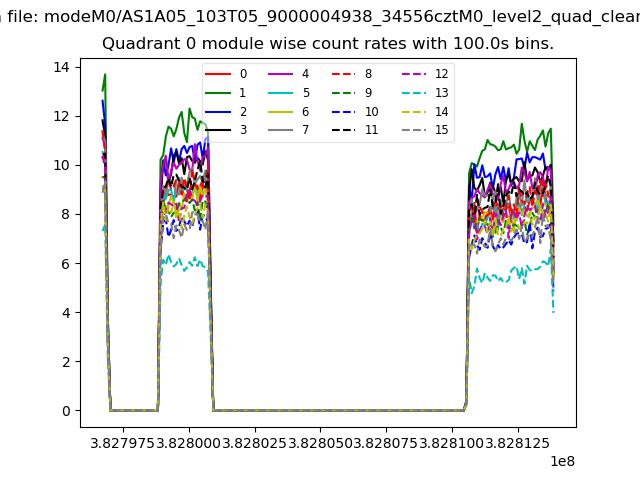 |
 |
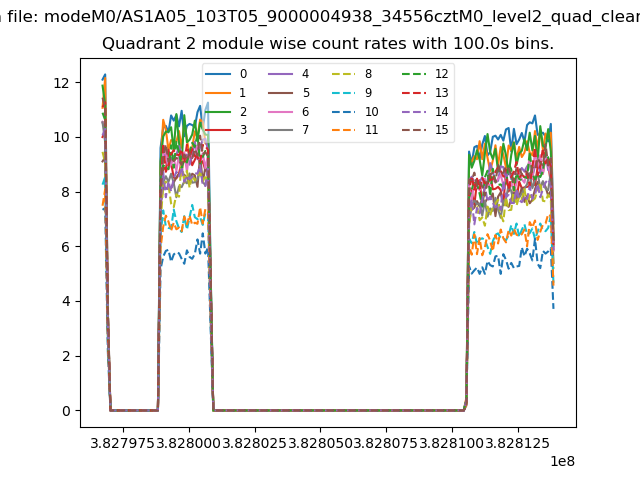
| Module-wise count rates for Quadrant B Data is divided into 100 sec bins |
 |
 |
| Module-wise count rates for Quadrant C Data is divided into 100 sec bins |
 |
 |
| Module-wise count rates for Quadrant D Data is divided into 100 sec bins |
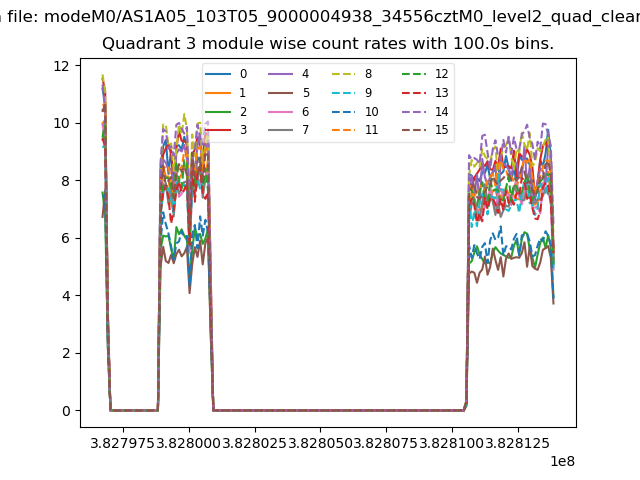 |
 |
| Parameter | Plot |
|---|---|
| CZT HV Monitor | 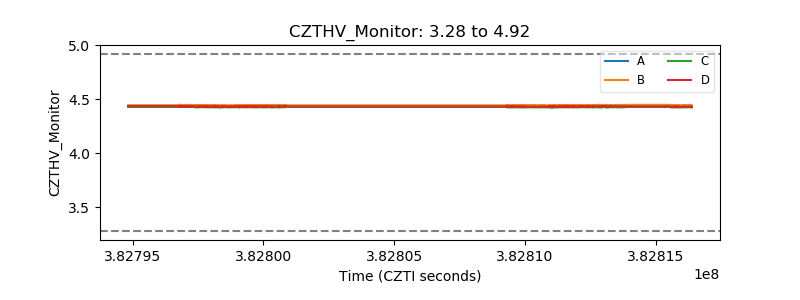 |
| D_VDD | 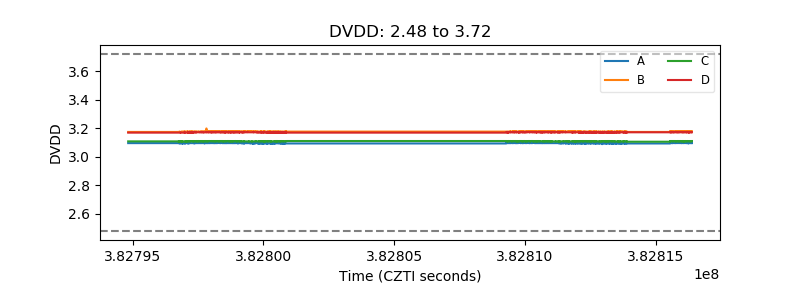 |
| Temperature 1 | 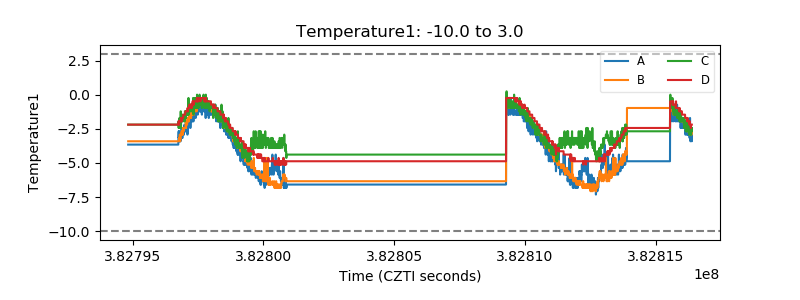 |
| Veto HV Monitor | 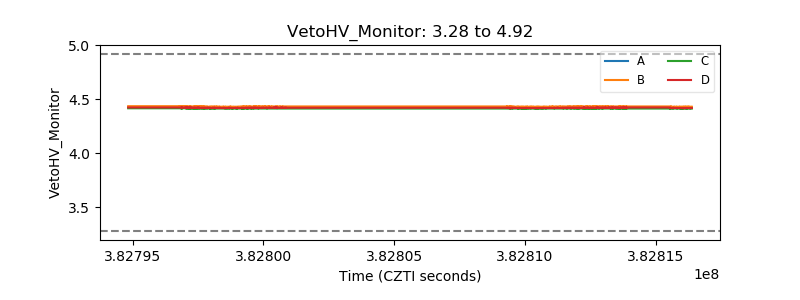 |
| Veto LLD | 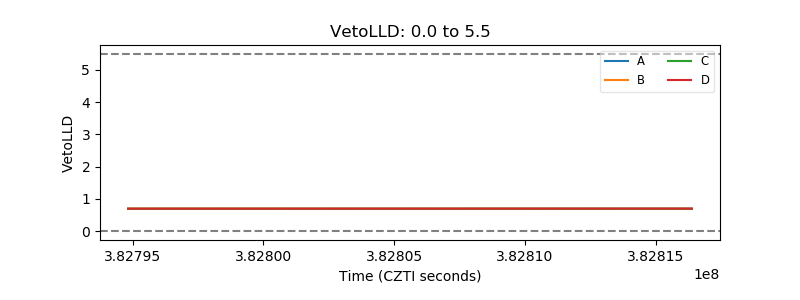 |
| Alpha Counter | 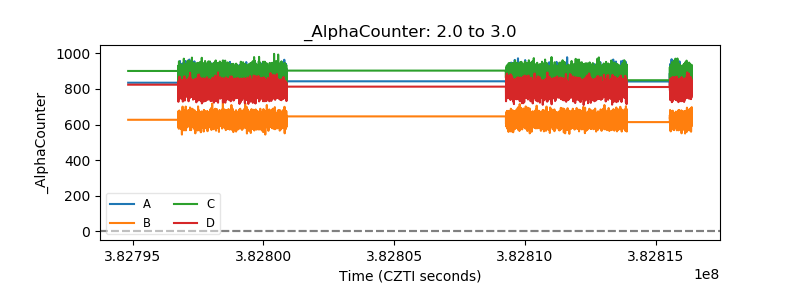 |
| _CPM_Rate | 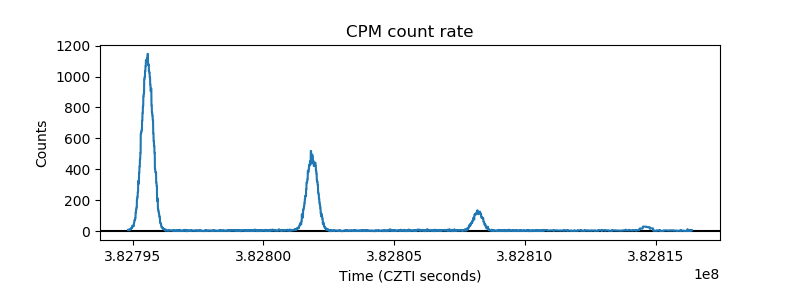 |
| CZT Counter | 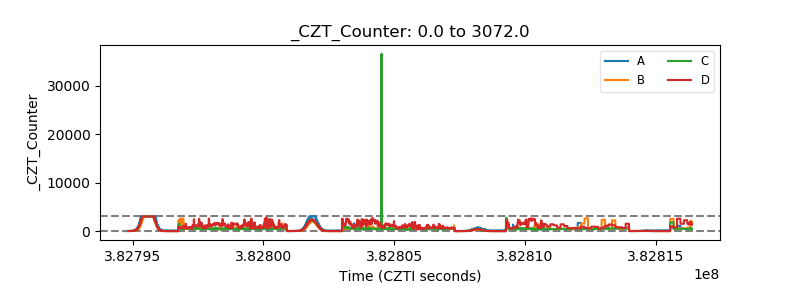 |
| +2.5 Volts monitor | 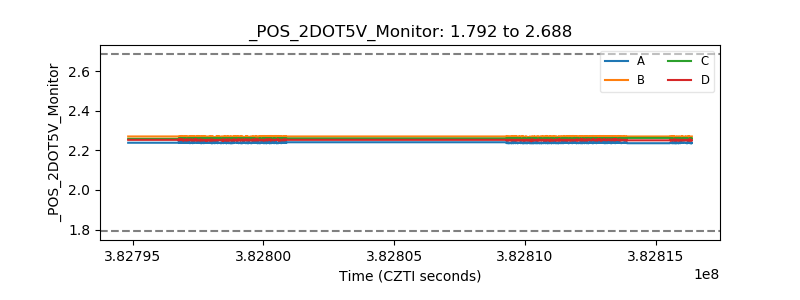 |
| +5 Volts monitor | 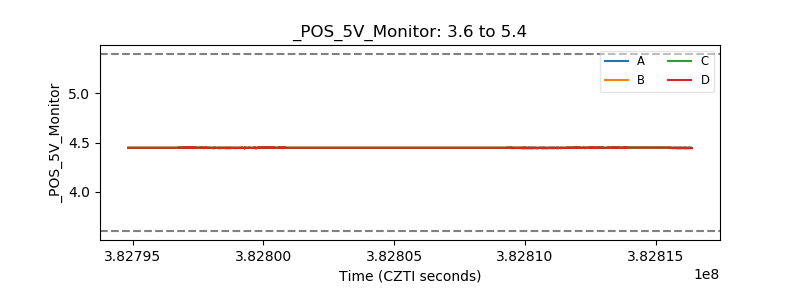 |
| _ROLL_ROT | 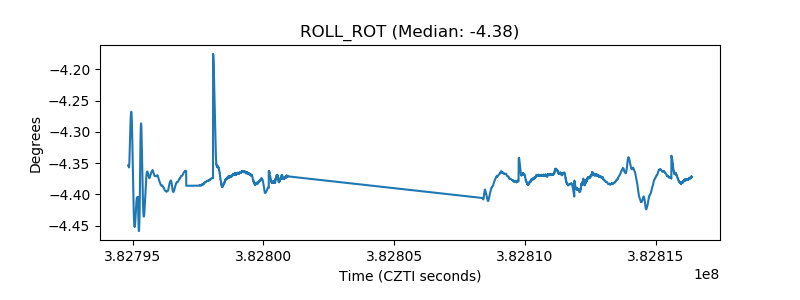 |
| _Roll_DEC | 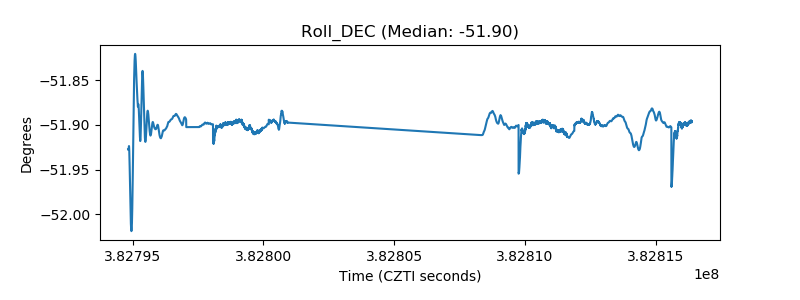 |
| _Roll_RA | 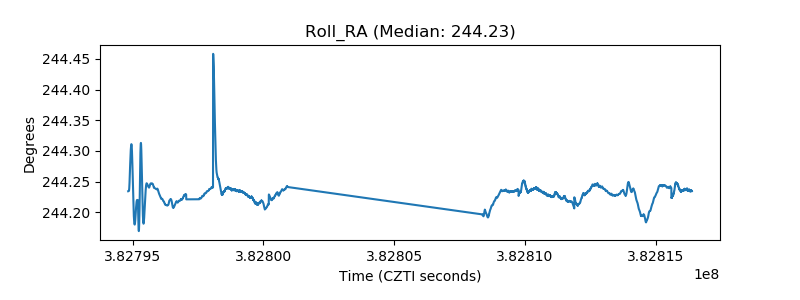 |
| Veto Counter | 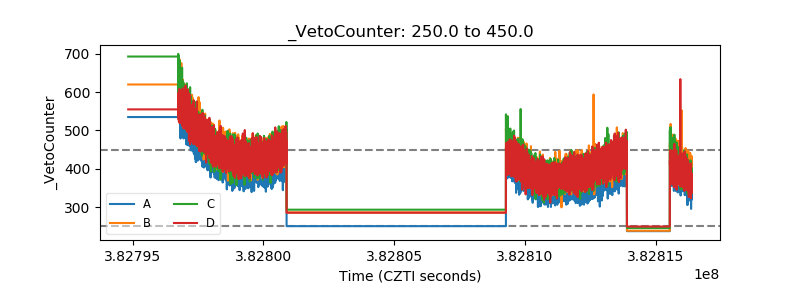 |