| Param | Original file | Final file |
|---|---|---|
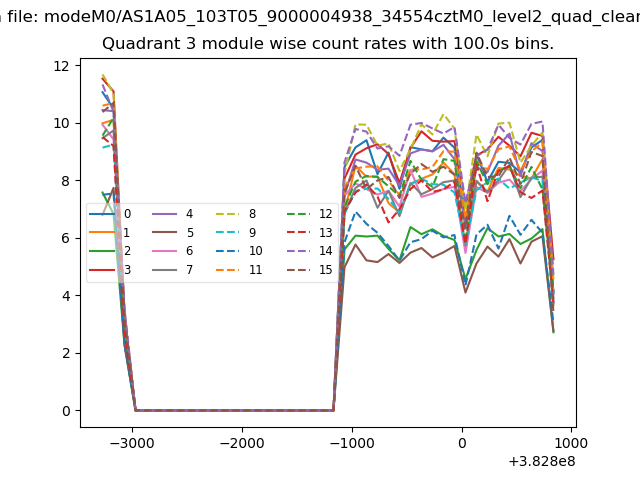
| Filename | modeM0/AS1A05_103T05_9000004938_34554cztM0_level2.evt | modeM0/AS1A05_103T05_9000004938_34554cztM0_level2_quad_clean.evt |
| Size (bytes) | 522,051,840 | 51,978,240 |
| Size | 497.9 MB | 49.6 MB |
| Events in quadrant A | 2,697,359 | 314,351 |
| Events in quadrant B | 3,291,270 | 300,078 |
| Events in quadrant C | 2,873,610 | 307,808 |
| Events in quadrant D | 6,589,325 | 279,889 |
| Mode M9 | |||
|---|---|---|---|
| Quadrant | BADHDUFLAG | Total packets | Discarded packets |
| A | 0 | 41 | 0 |
| B | 0 | 41 | 0 |
| C | 0 | 41 | 0 |
| D | 0 | 41 | 0 |
| Mode SS | |||
|---|---|---|---|
| Quadrant | BADHDUFLAG | Total packets | Discarded packets |
| A | 0 | 108 | 0 |
| B | 0 | 108 | 0 |
| C | 0 | 108 | 0 |
| D | 0 | 108 | 0 |
| Mode M0 | |||
|---|---|---|---|
| Quadrant | BADHDUFLAG | Total packets | Discarded packets |
| A | 0 | 11127 | 3 |
| B | 0 | 12883 | 2 |
| C | 0 | 11552 | 2 |
| D | 0 | 23402 | 2 |
| Quadrant | Total seconds | Saturated seconds | Saturation percentage |
|---|---|---|---|
| A | 5302 | 15 | 0.282912% |
| B | 5302 | 172 | 3.244059% |
| C | 5302 | 20 | 0.377216% |
| D | 5302 | 574 | 10.826103% |
Noise dominated data is calculated using 1-second bins in cleaned event files. If a bin has >2000 counts, and if more than 50% of those come from <1% of pixels, then it is considered to be noise-dominated and hence unusable.
| Quadrant | # 1 sec bins | Bins with >0 counts | Bins with >2000 counts | High rate bins dominated by noise | Noise dominated (total time) | Noise dominated (detector-on time) | Marked lightcurve |
|---|---|---|---|---|---|---|---|
| A | 7424 | 5303 | 3 | 3 | 0.04% | 0.06% | 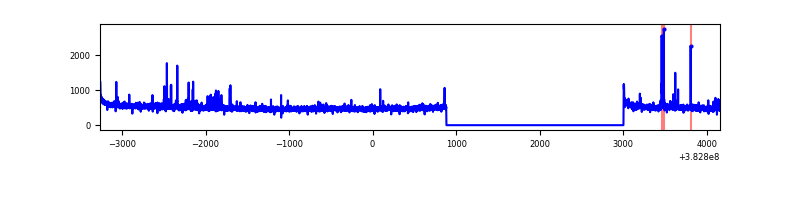 |
| B | 7424 | 5303 | 112 | 112 | 1.51% | 2.11% | 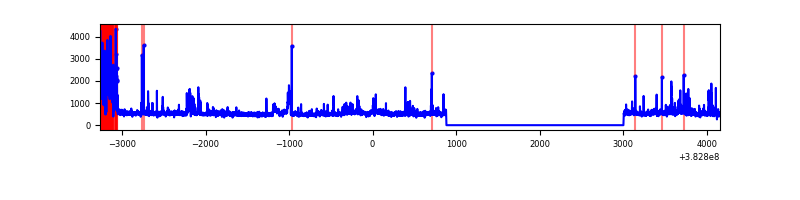 |
| C | 7424 | 5303 | 7 | 7 | 0.09% | 0.13% | 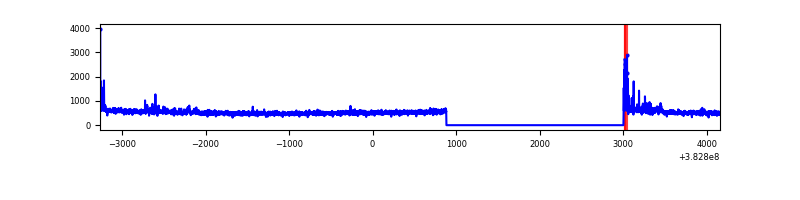 |
| D | 7424 | 5303 | 500 | 500 | 6.73% | 9.43% | 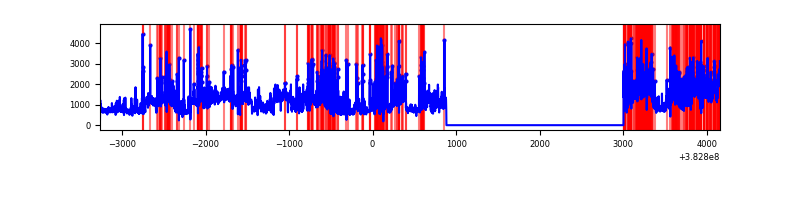 |
Top three noisy pixels from each quadrant. If the there are fewer than three noisy pixels in the level2.evt file, extra rows are filled as -1
| Pixel properties | Quadrant properties | ||||||
|---|---|---|---|---|---|---|---|
| Quadrant | DetID | PixID | Counts | Sigma | Mean | Median | Sigma |
| A | 9 | 143 | 56377 | 419.18 | 667 | 655 | 132.9 |
| A | 10 | 83 | 43250 | 320.43 | 667 | 655 | 132.9 |
| A | 13 | 254 | 9802 | 68.81 | 667 | 655 | 132.9 |
| B | 5 | 172 | 453750 | 3773.41 | 647 | 632 | 120.1 |
| B | 0 | 229 | 111814 | 925.88 | 647 | 632 | 120.1 |
| B | 15 | 201 | 29909 | 243.81 | 647 | 632 | 120.1 |
| C | 15 | 214 | 225526 | 1535.64 | 640 | 647 | 146.4 |
| C | 0 | 10 | 69663 | 471.29 | 640 | 647 | 146.4 |
| C | 14 | 67 | 62345 | 421.32 | 640 | 647 | 146.4 |
| D | 8 | 195 | 2146064 | 12833.59 | 621 | 606 | 167.2 |
| D | 1 | 47 | 894540 | 5347.29 | 621 | 606 | 167.2 |
| D | 12 | 235 | 307610 | 1836.42 | 621 | 606 | 167.2 |
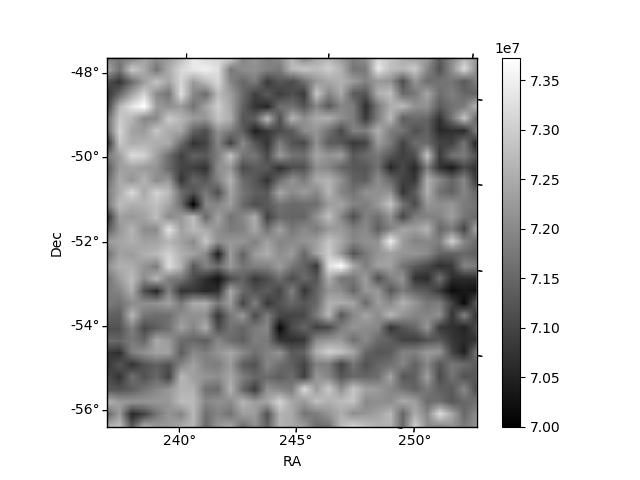
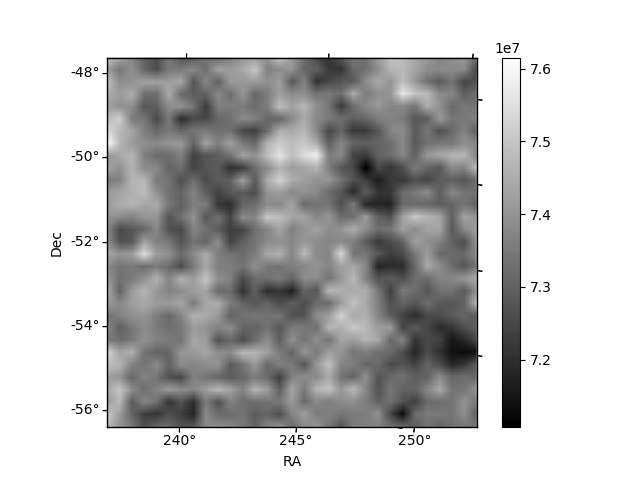
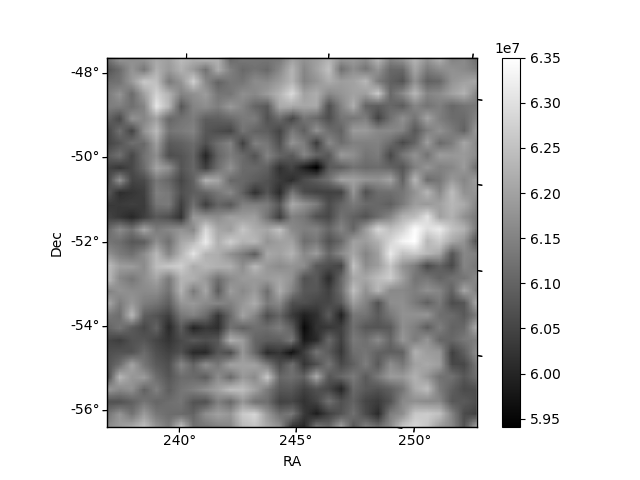
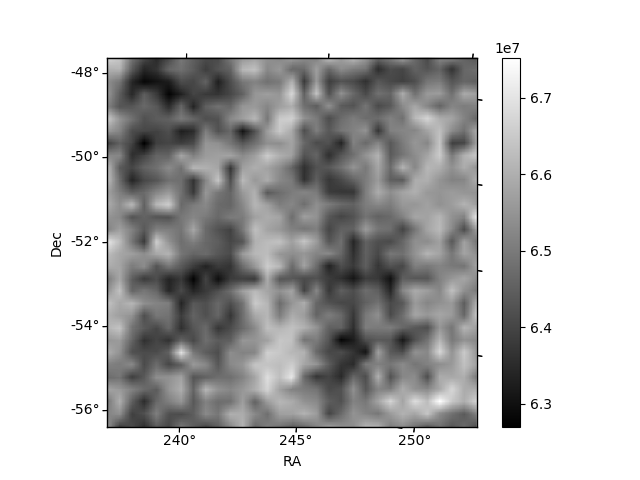
Histogram calculated using DETX and DETY for each event in the final _common_clean file
| Quadrant A | 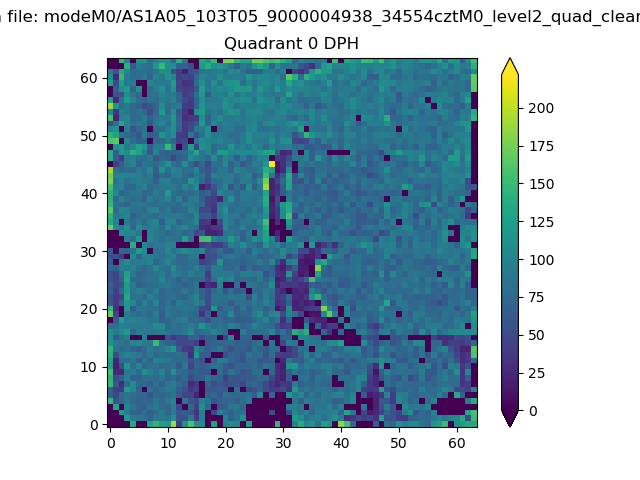 |
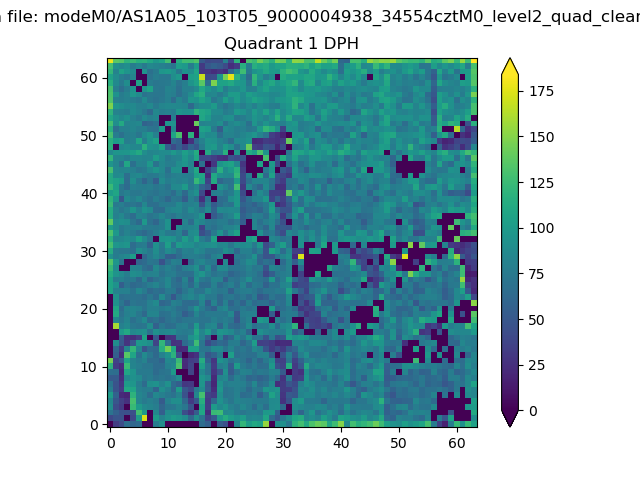 |
Quadrant B |
|---|---|---|---|
| Quadrant D | 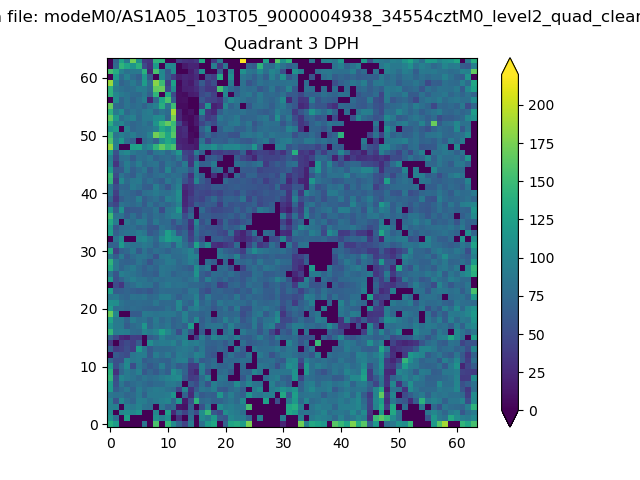 |
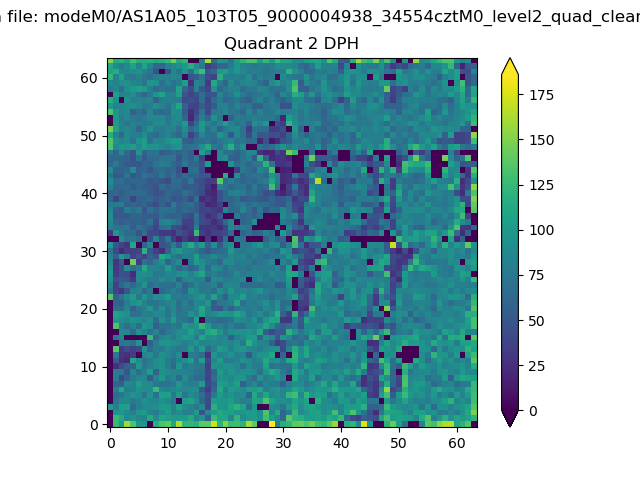 |
Quadrant C |
| Plot type | Count rate plots | Images |
|---|---|---|
| Comparison with Poisson distribution Blue bars denote a histogram of data divided into 1 sec bins. Red curve is a Poisson curve with rate = median count rate of data. |
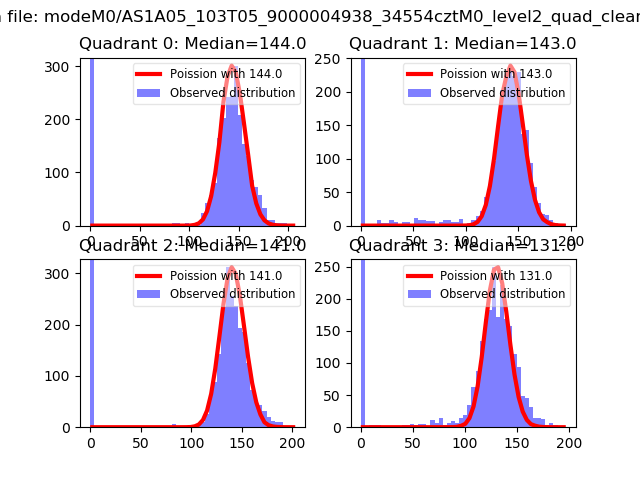 |
 |
| Quadrant-wise count rates Data is divided into 100 sec bins |
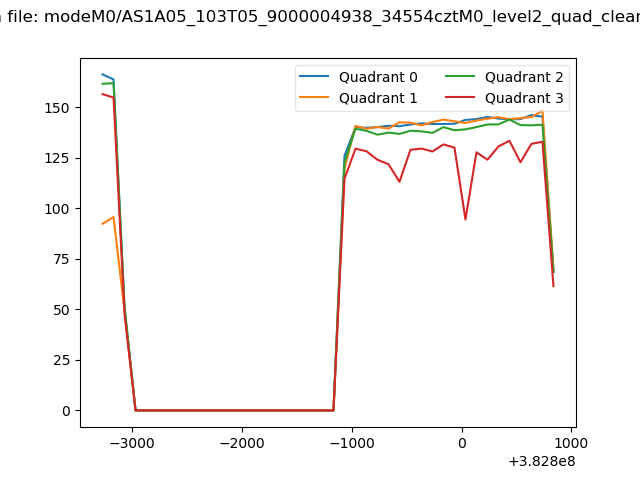 |
|
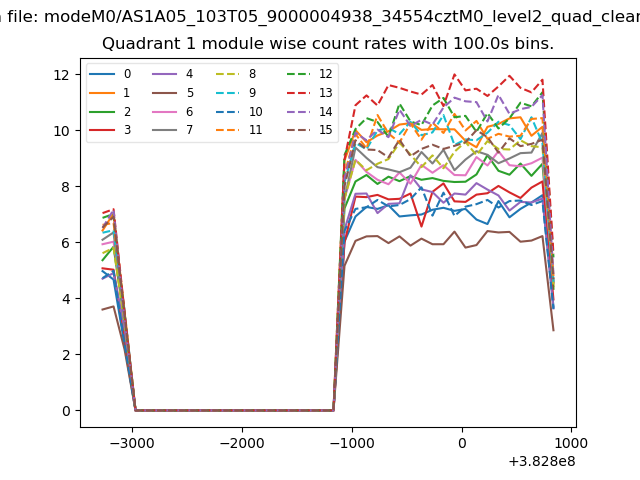
| Module-wise count rates for Quadrant A Data is divided into 100 sec bins |
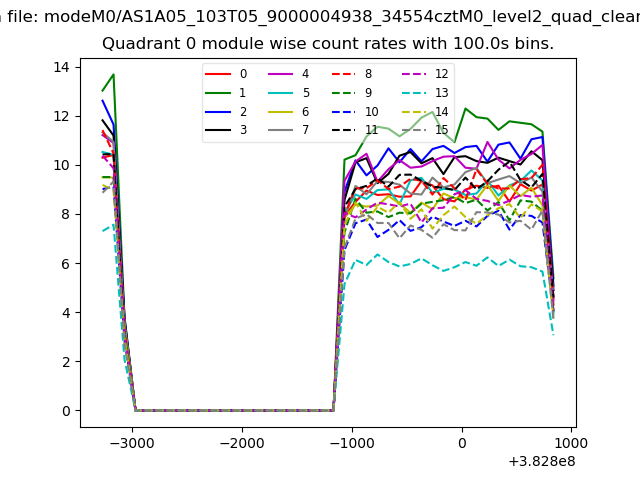 |
 |
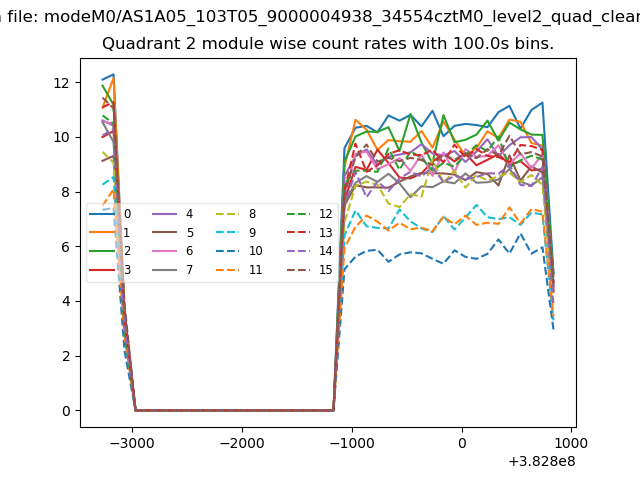
| Module-wise count rates for Quadrant B Data is divided into 100 sec bins |
 |
 |
| Module-wise count rates for Quadrant C Data is divided into 100 sec bins |
 |
 |
| Module-wise count rates for Quadrant D Data is divided into 100 sec bins |
 |
 |
| Parameter | Plot |
|---|---|
| CZT HV Monitor | 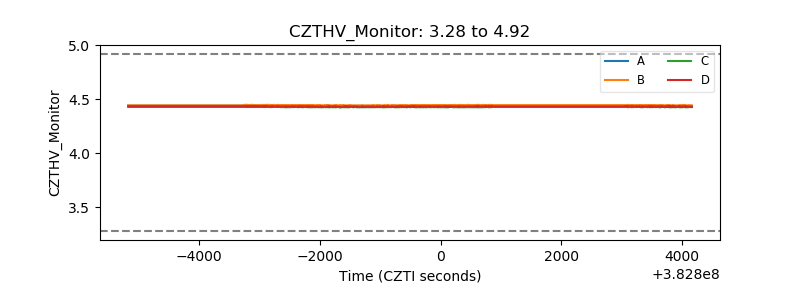 |
| D_VDD | 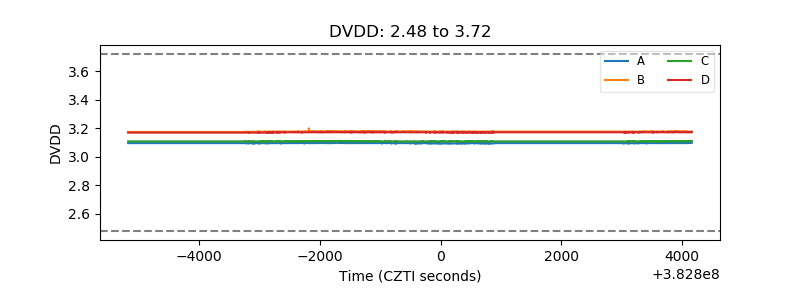 |
| Temperature 1 | 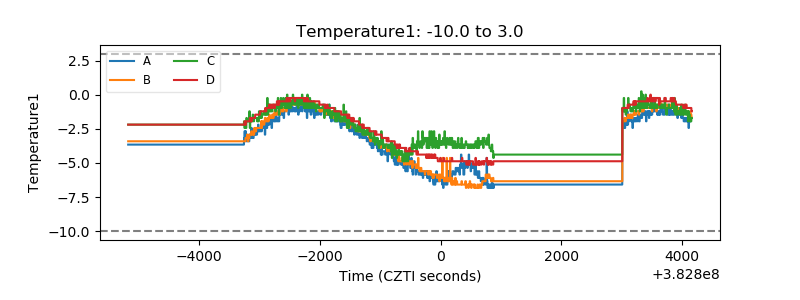 |
| Veto HV Monitor | 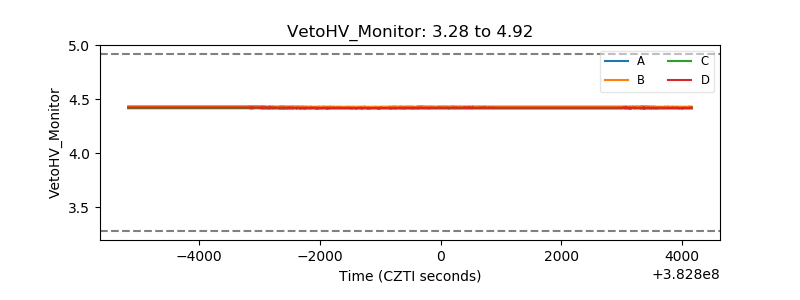 |
| Veto LLD | 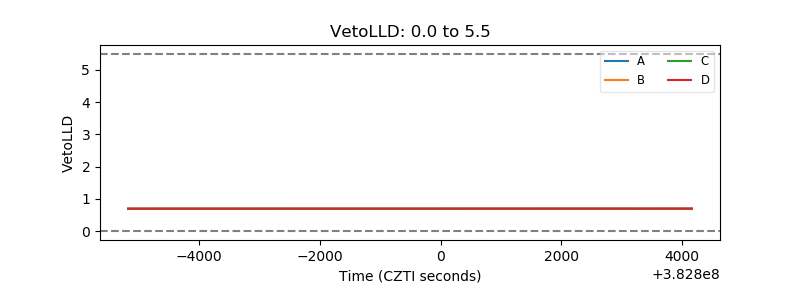 |
| Alpha Counter | 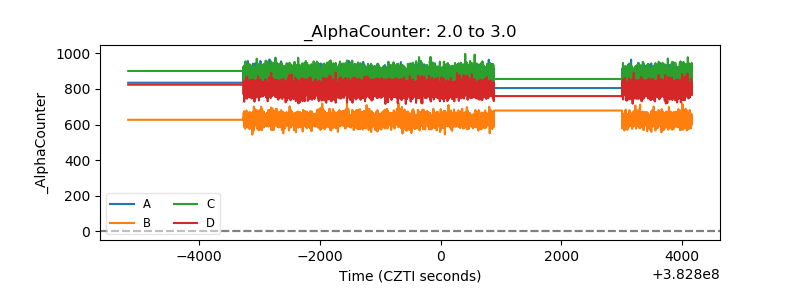 |
| _CPM_Rate | 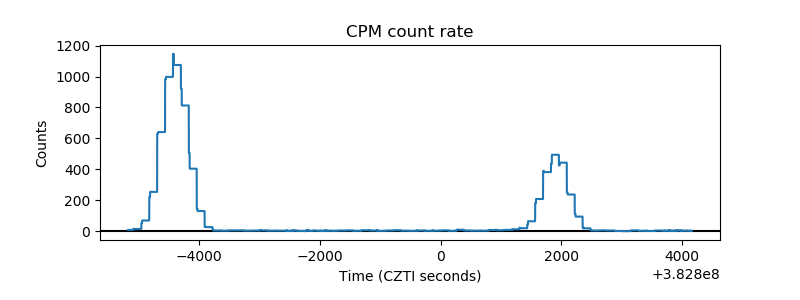 |
| CZT Counter | 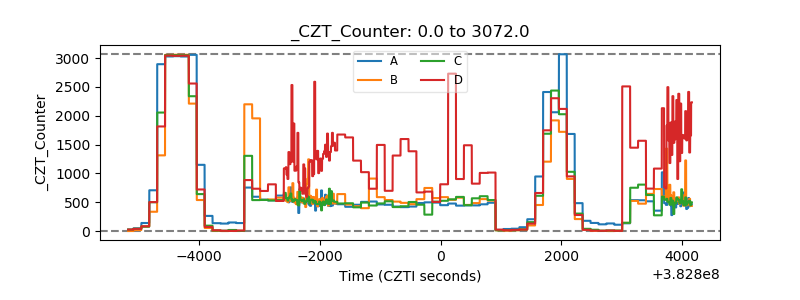 |
| +2.5 Volts monitor | 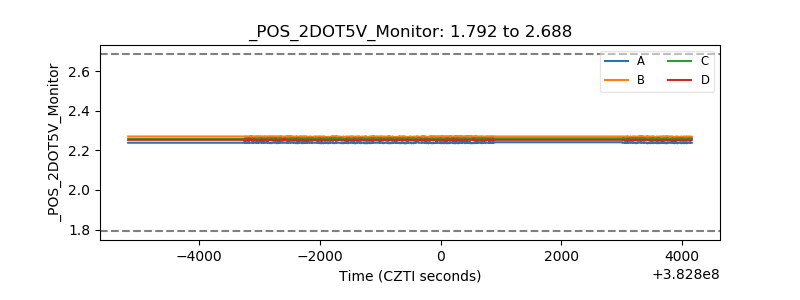 |
| +5 Volts monitor | 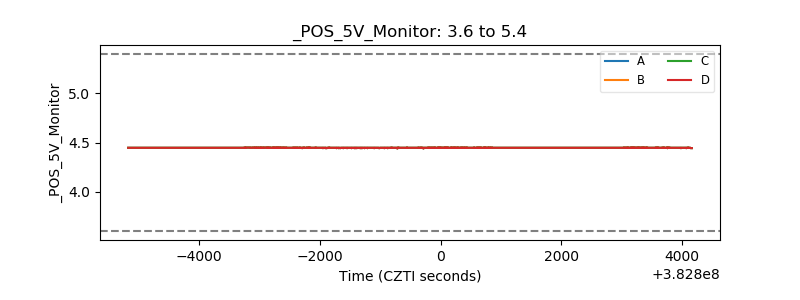 |
| _ROLL_ROT | 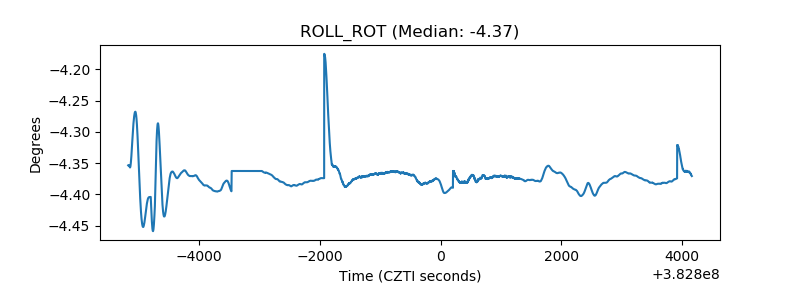 |
| _Roll_DEC | 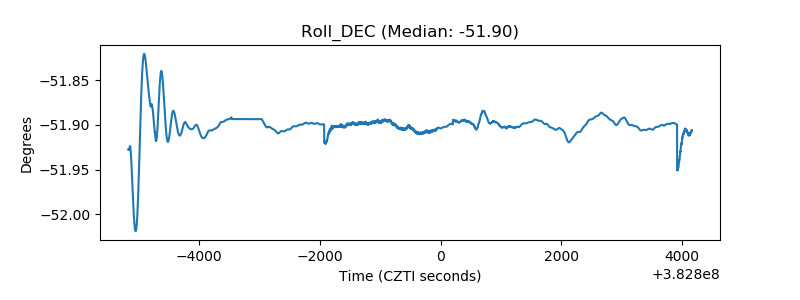 |
| _Roll_RA | 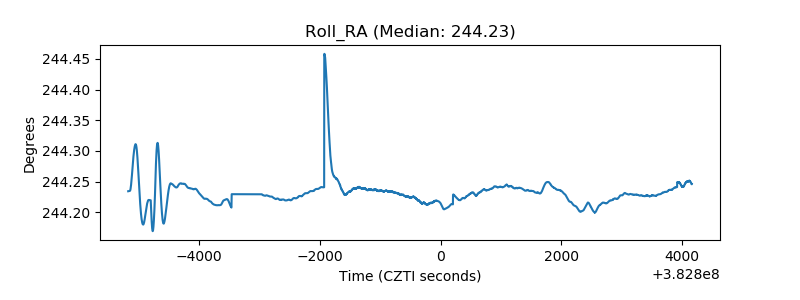 |
| Veto Counter | 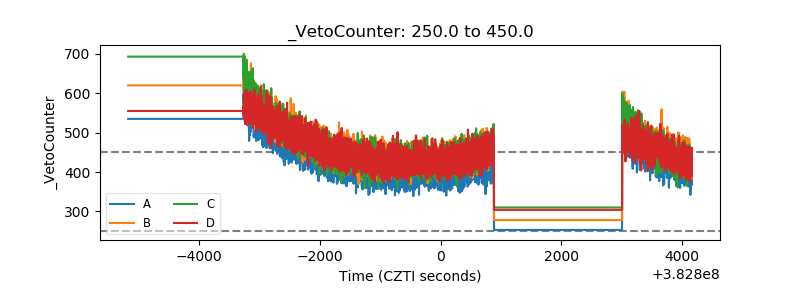 |