| Param | Original file | Final file |
|---|---|---|
| Filename | modeM0/AS1A05_103T05_9000004938cztM0_level2_bc.evt | modeM0/AS1A05_103T05_9000004938cztM0_level2_quad_clean.evt |
| Size (bytes) | 1,356,719,040 | 338,492,160 |
| Size | 1.3 GB | 322.8 MB |
| Events in quadrant A | 5,333,931 | 2,245,458 |
| Events in quadrant B | 8,267,858 | 2,196,731 |
| Events in quadrant C | 6,146,670 | 2,205,470 |
| Events in quadrant D | 19,722,577 | 1,970,097 |
| Mode M9 | |||
|---|---|---|---|
| Quadrant | BADHDUFLAG | Total packets | Discarded packets |
| A | 0 | 87 | 0 |
| B | 0 | 87 | 0 |
| C | 0 | 87 | 0 |
| D | 0 | 87 | 0 |
| Mode SS | |||
|---|---|---|---|
| Quadrant | BADHDUFLAG | Total packets | Discarded packets |
| A | 0 | 484 | 0 |
| B | 0 | 484 | 0 |
| C | 0 | 484 | 0 |
| D | 0 | 484 | 0 |
| Mode M0 | |||
|---|---|---|---|
| Quadrant | BADHDUFLAG | Total packets | Discarded packets |
| A | 0 | 49390 | 0 |
| B | 0 | 62127 | 0 |
| C | 0 | 49966 | 0 |
| D | 0 | 98712 | 0 |
| Quadrant | Total seconds | Saturated seconds | Saturation percentage |
|---|---|---|---|
| A | 23752 | 89 | 0.374705% |
| B | 23752 | 1181 | 4.972213% |
| C | 23752 | 127 | 0.534692% |
| D | 23752 | 2726 | 11.476928% |
Noise dominated data is calculated using 1-second bins in cleaned event files. If a bin has >2000 counts, and if more than 50% of those come from <1% of pixels, then it is considered to be noise-dominated and hence unusable.
| Quadrant | # 1 sec bins | Bins with >0 counts | Bins with >2000 counts | High rate bins dominated by noise | Noise dominated (total time) | Noise dominated (detector-on time) | Marked lightcurve |
|---|---|---|---|---|---|---|---|
| A | 37816 | 23757 | 9 | 9 | 0.02% | 0.04% | 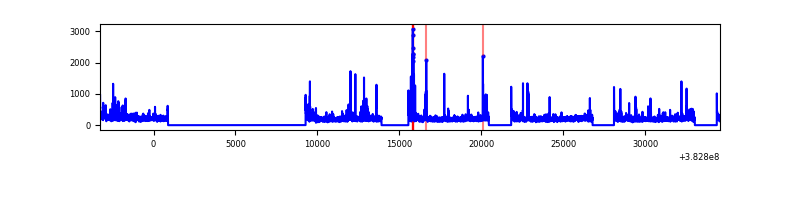 |
| B | 37815 | 23751 | 78 | 78 | 0.21% | 0.33% | 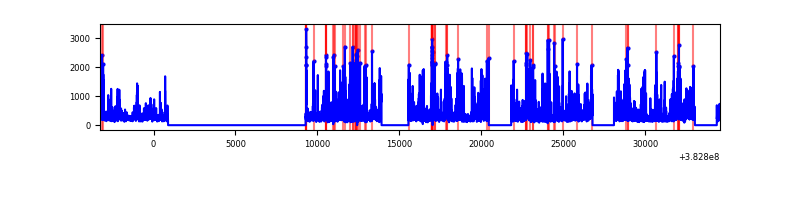 |
| C | 37815 | 23751 | 16 | 16 | 0.04% | 0.07% | 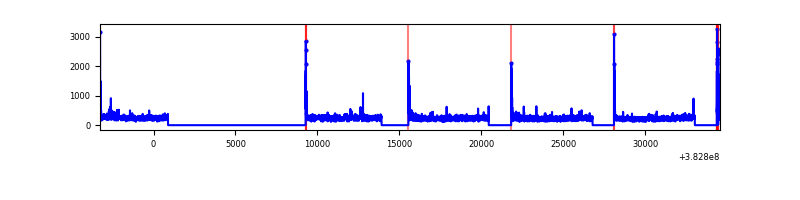 |
| D | 37815 | 23751 | 693 | 693 | 1.83% | 2.92% | 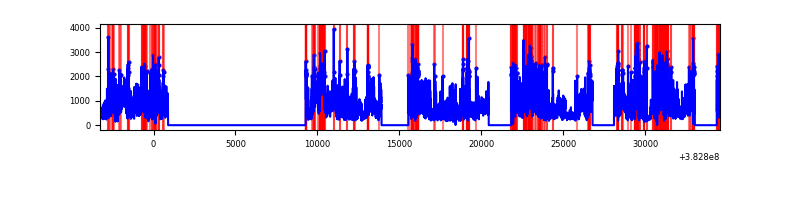 |
Top three noisy pixels from each quadrant. If the there are fewer than three noisy pixels in the level2.evt file, extra rows are filled as -1
| Pixel properties | Quadrant properties | ||||||
|---|---|---|---|---|---|---|---|
| Quadrant | DetID | PixID | Counts | Sigma | Mean | Median | Sigma |
| A | 9 | 143 | 199628 | 714.05 | 1247 | 1228 | 277.8 |
| A | 10 | 83 | 139198 | 496.56 | 1247 | 1228 | 277.8 |
| A | 0 | 31 | 65798 | 232.39 | 1247 | 1228 | 277.8 |
| B | 5 | 172 | 2199276 | 9089.53 | 1219 | 1195 | 241.8 |
| B | 0 | 229 | 361499 | 1489.93 | 1219 | 1195 | 241.8 |
| B | 0 | 245 | 222305 | 914.34 | 1219 | 1195 | 241.8 |
| C | 15 | 214 | 942877 | 3368.02 | 1211 | 1205 | 279.6 |
| C | 0 | 10 | 260557 | 927.61 | 1211 | 1205 | 279.6 |
| C | 14 | 67 | 155846 | 553.09 | 1211 | 1205 | 279.6 |
| D | 8 | 195 | 8115850 | 27392.56 | 1153 | 1127 | 296.2 |
| D | 10 | 118 | 1068006 | 3601.42 | 1153 | 1127 | 296.2 |
| D | 7 | 38 | 915866 | 3087.85 | 1153 | 1127 | 296.2 |
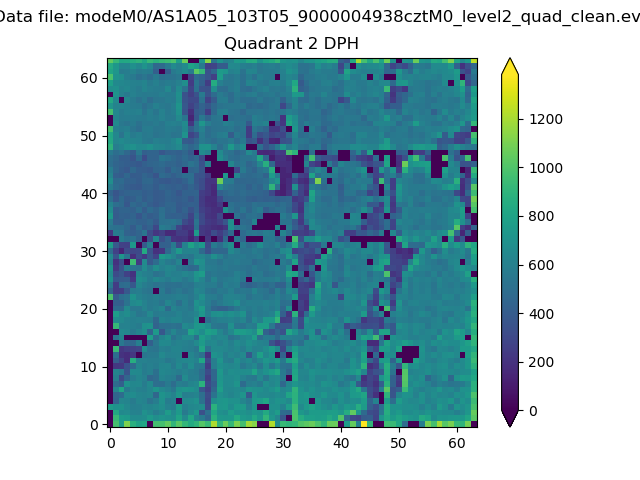
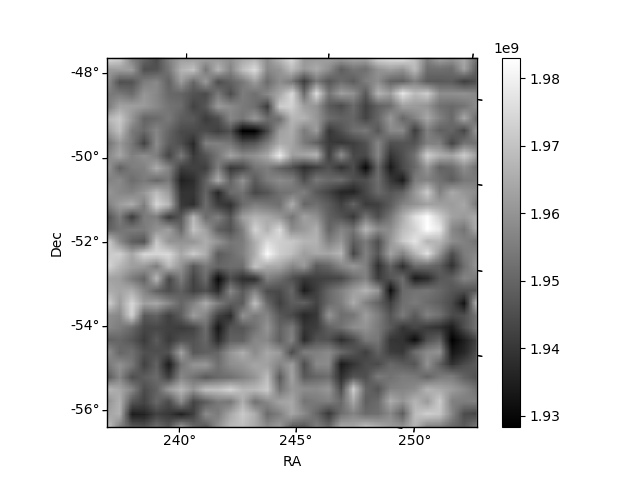
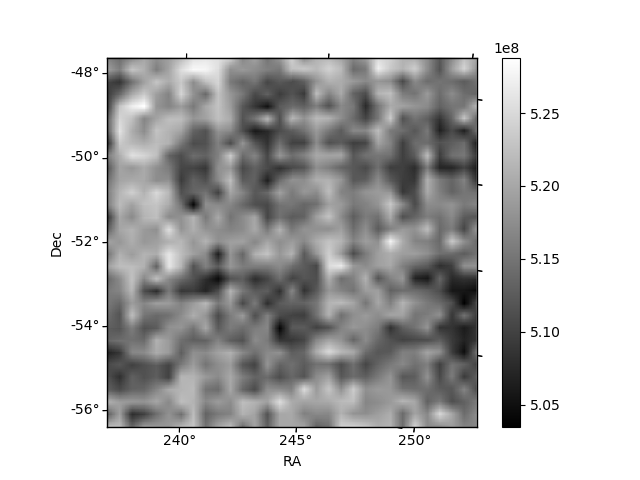
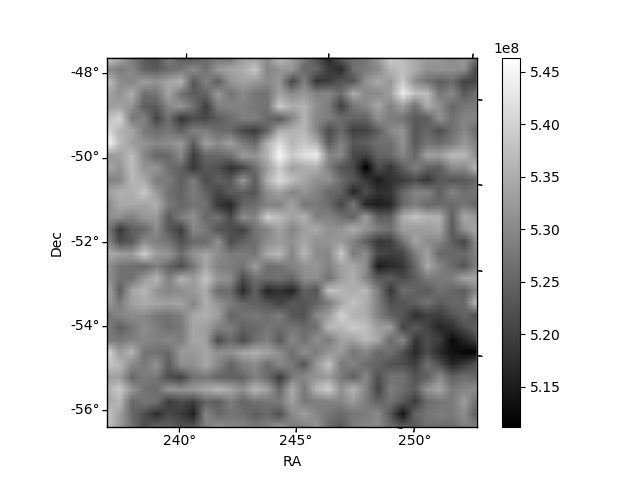
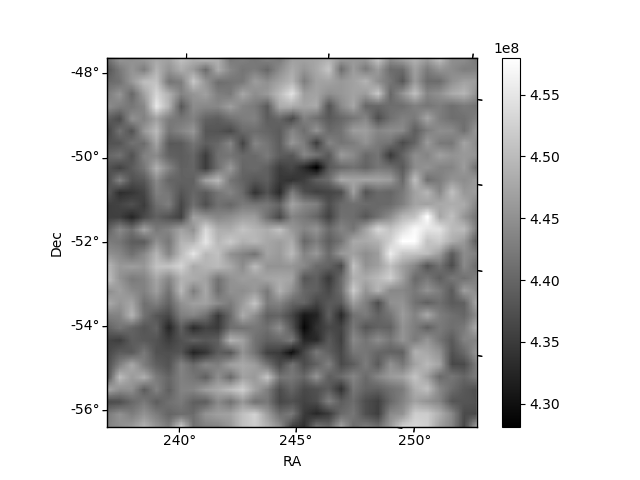
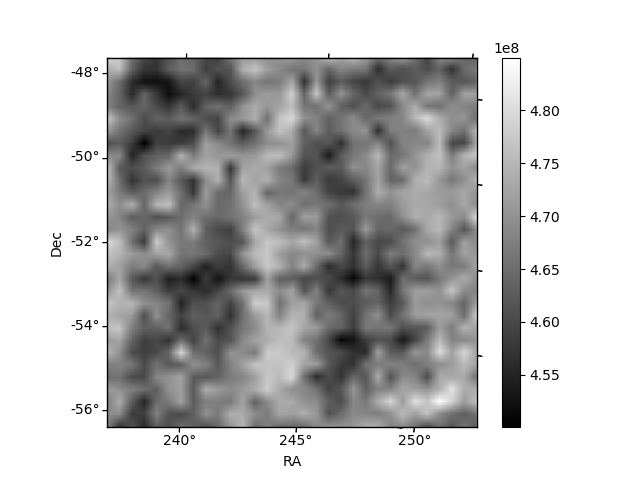
Histogram calculated using DETX and DETY for each event in the final _common_clean file
| Quadrant A | 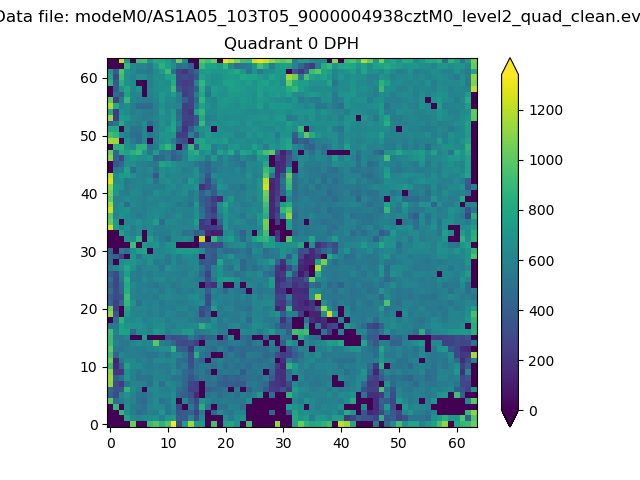 |
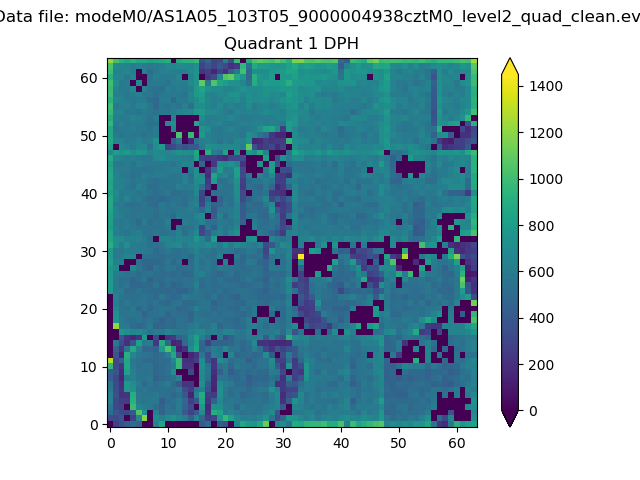 |
Quadrant B |
|---|---|---|---|
| Quadrant D | 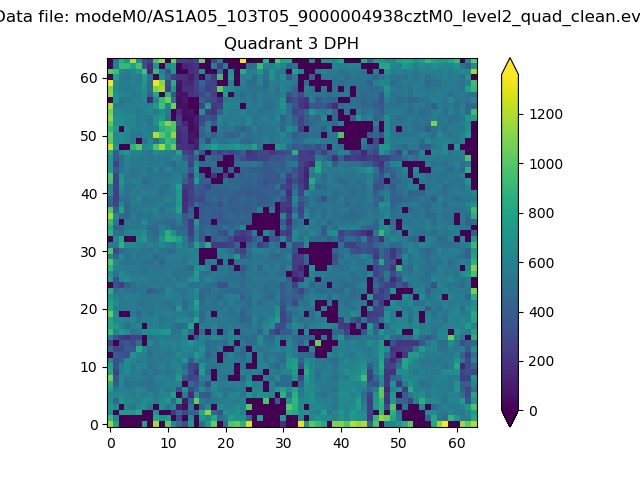 |
 |
Quadrant C |
| Plot type | Count rate plots | Images |
|---|---|---|
| Comparison with Poisson distribution Blue bars denote a histogram of data divided into 1 sec bins. Red curve is a Poisson curve with rate = median count rate of data. |
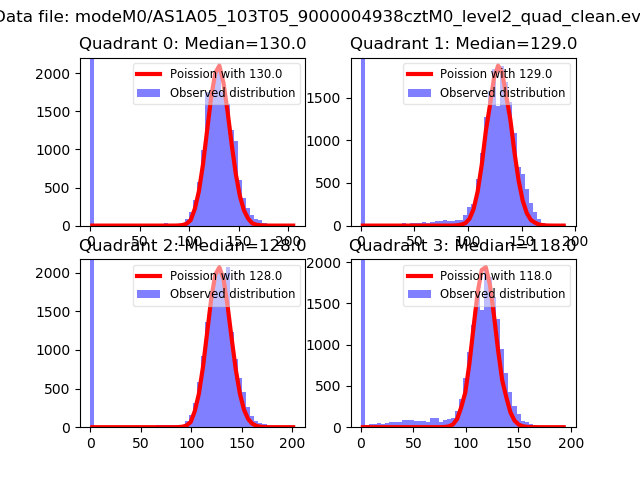 |
 |
| Quadrant-wise count rates Data is divided into 100 sec bins |
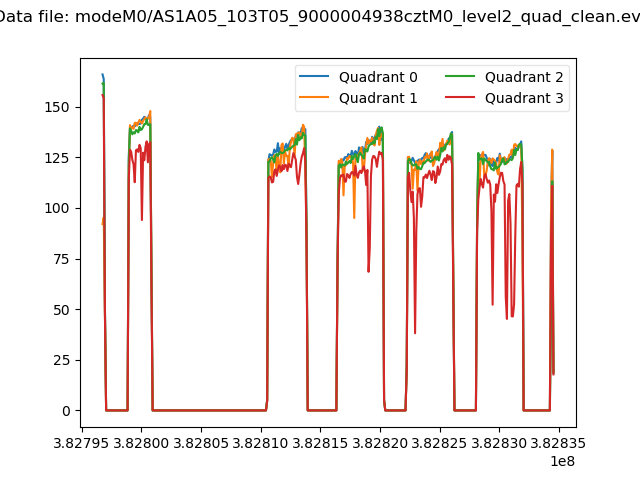 |
|
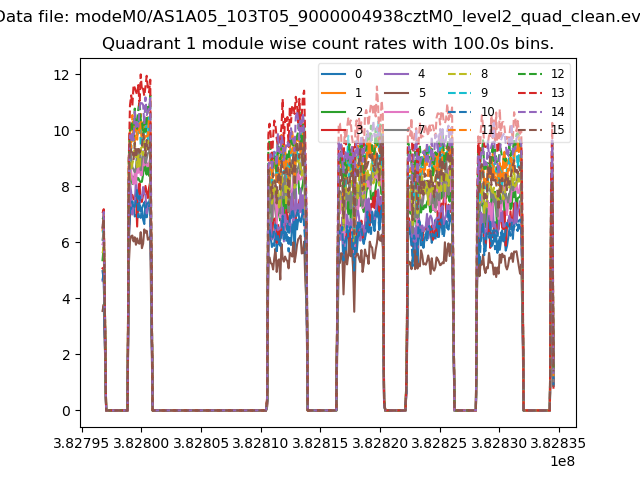
| Module-wise count rates for Quadrant A Data is divided into 100 sec bins |
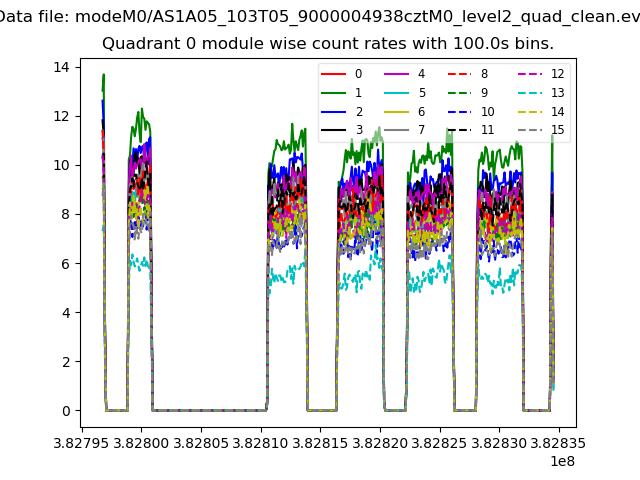 |
 |
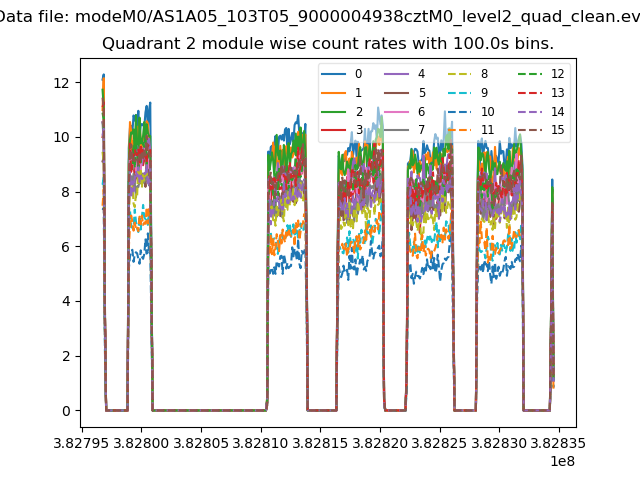
| Module-wise count rates for Quadrant B Data is divided into 100 sec bins |
 |
 |
| Module-wise count rates for Quadrant C Data is divided into 100 sec bins |
 |
 |
| Module-wise count rates for Quadrant D Data is divided into 100 sec bins |
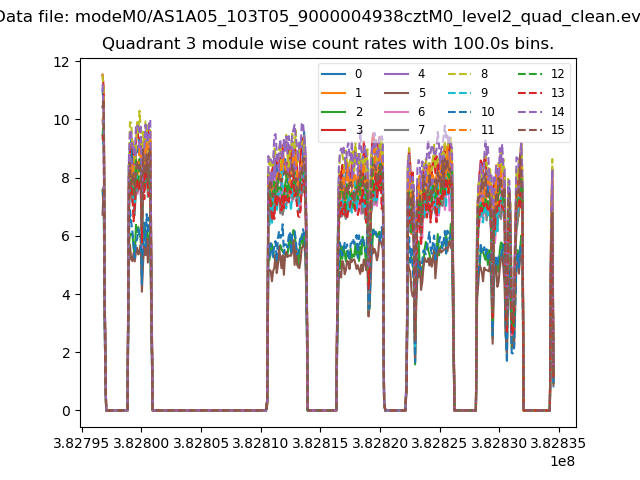 |
 |
| Parameter | Plot |
|---|---|
| CZT HV Monitor | 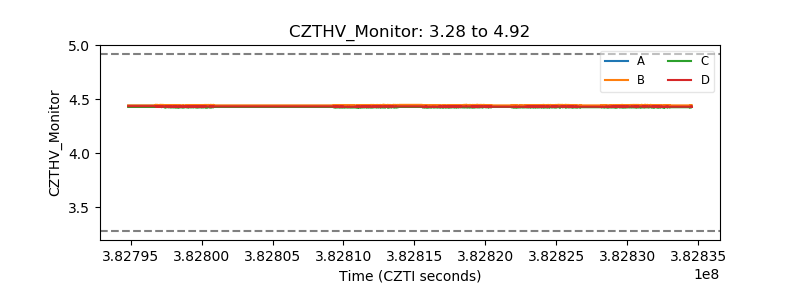 |
| D_VDD | 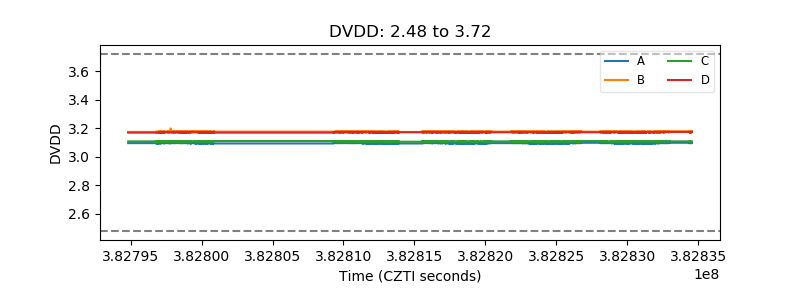 |
| Temperature 1 | 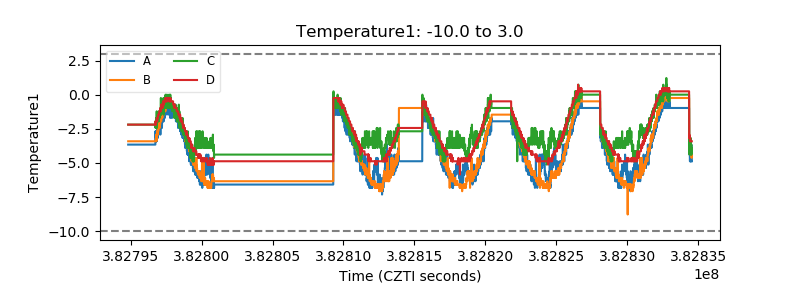 |
| Veto HV Monitor | 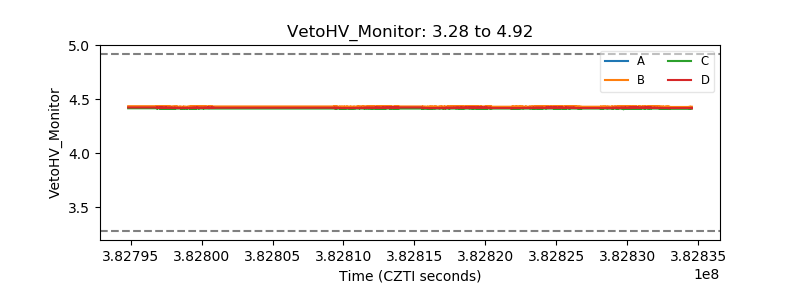 |
| Veto LLD | 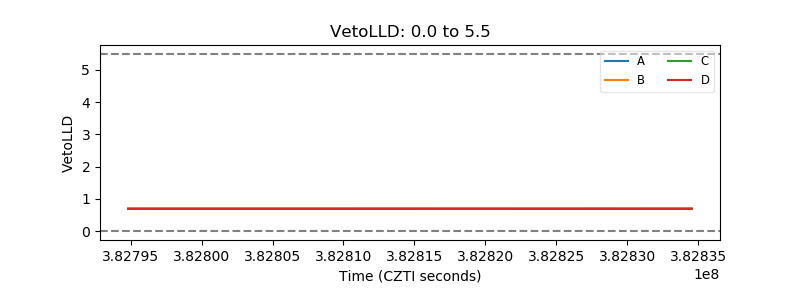 |
| Alpha Counter | 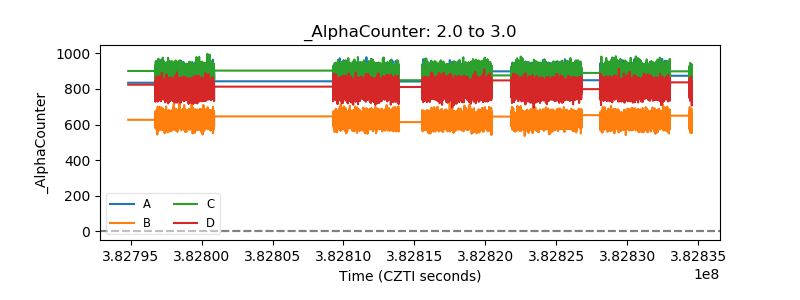 |
| _CPM_Rate | 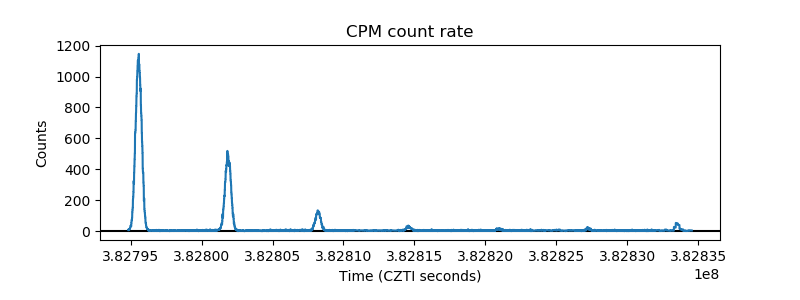 |
| CZT Counter | 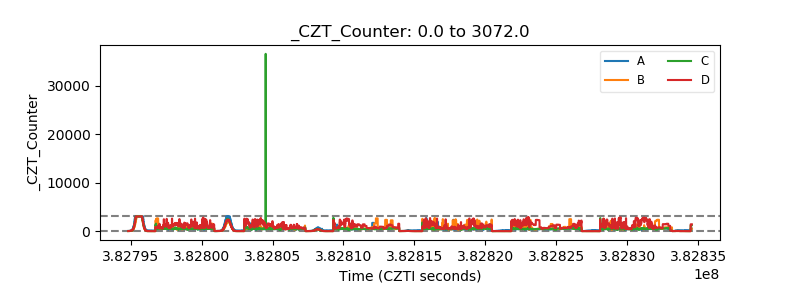 |
| +2.5 Volts monitor | 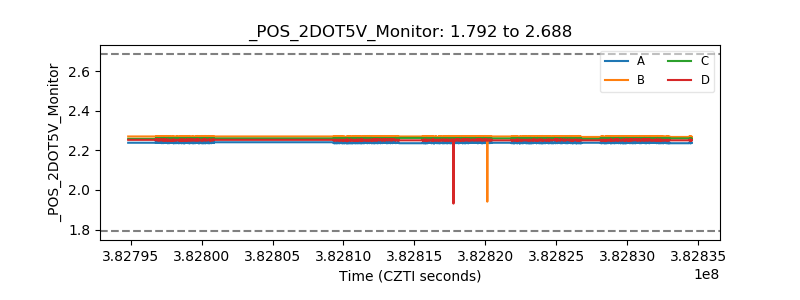 |
| +5 Volts monitor | 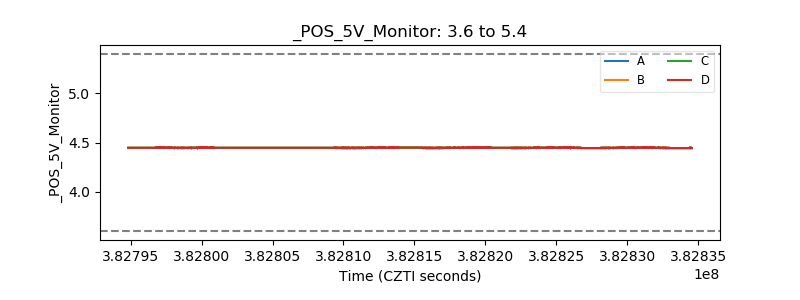 |
| _ROLL_ROT | 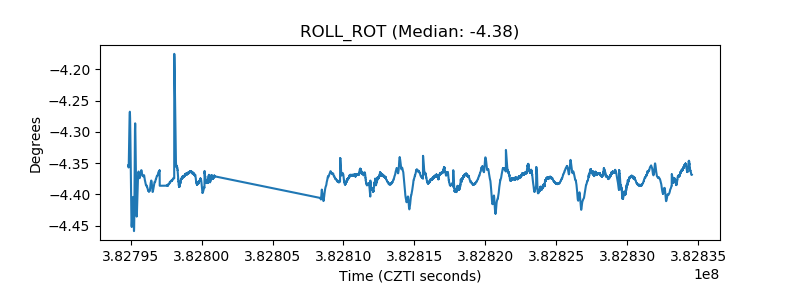 |
| _Roll_DEC | 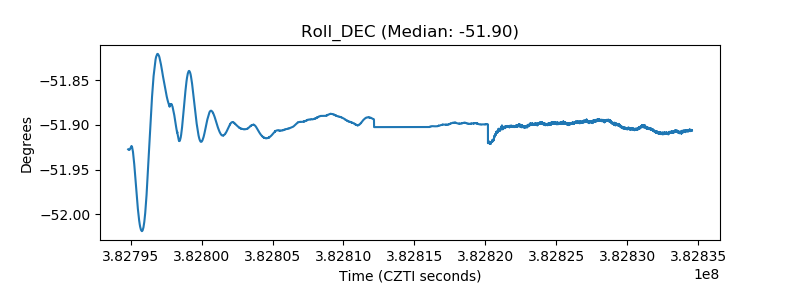 |
| _Roll_RA | 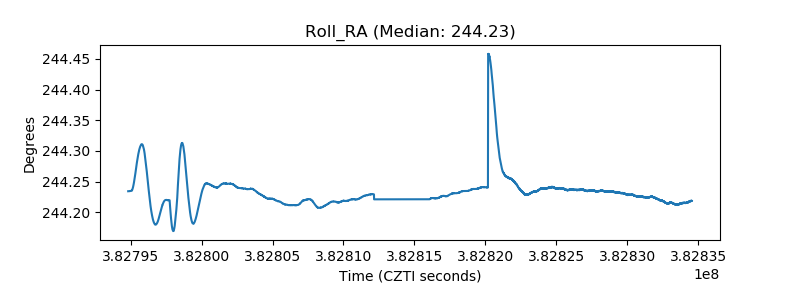 |
| Veto Counter | 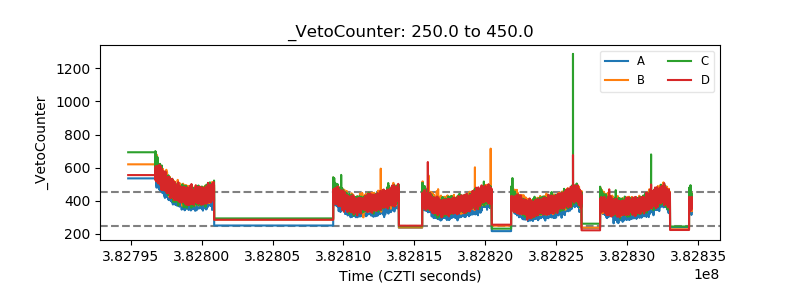 |