| Param | Original file | Final file |
|---|---|---|
| Filename | modeM0/AS1A05_097T01_9000004936_34556cztM0_level2.evt | modeM0/AS1A05_097T01_9000004936_34556cztM0_level2_quad_clean.evt |
| Size (bytes) | 1,537,220,160 | 168,710,400 |
| Size | 1.4 GB | 160.9 MB |
| Events in quadrant A | 8,333,810 | 1,026,838 |
| Events in quadrant B | 11,415,238 | 993,495 |
| Events in quadrant C | 8,986,947 | 1,026,048 |
| Events in quadrant D | 16,731,793 | 947,755 |
| Mode M0 | |||
|---|---|---|---|
| Quadrant | BADHDUFLAG | Total packets | Discarded packets |
| A | 0 | 33855 | 3 |
| B | 0 | 43507 | 3 |
| C | 0 | 35836 | 3 |
| D | 0 | 61800 | 3 |
| Mode SS | |||
|---|---|---|---|
| Quadrant | BADHDUFLAG | Total packets | Discarded packets |
| A | 0 | 326 | 0 |
| B | 0 | 326 | 0 |
| C | 0 | 326 | 0 |
| D | 0 | 326 | 0 |
| Mode M9 | |||
|---|---|---|---|
| Quadrant | BADHDUFLAG | Total packets | Discarded packets |
| A | 0 | 60 | 0 |
| B | 0 | 60 | 0 |
| C | 0 | 60 | 0 |
| D | 0 | 60 | 0 |
| Quadrant | Total seconds | Saturated seconds | Saturation percentage |
|---|---|---|---|
| A | 16177 | 33 | 0.203993% |
| B | 16177 | 1061 | 6.558694% |
| C | 16177 | 34 | 0.210175% |
| D | 16177 | 790 | 4.883477% |
Noise dominated data is calculated using 1-second bins in cleaned event files. If a bin has >2000 counts, and if more than 50% of those come from <1% of pixels, then it is considered to be noise-dominated and hence unusable.
| Quadrant | # 1 sec bins | Bins with >0 counts | Bins with >2000 counts | High rate bins dominated by noise | Noise dominated (total time) | Noise dominated (detector-on time) | Marked lightcurve |
|---|---|---|---|---|---|---|---|
| A | 22067 | 16180 | 14 | 14 | 0.06% | 0.09% | 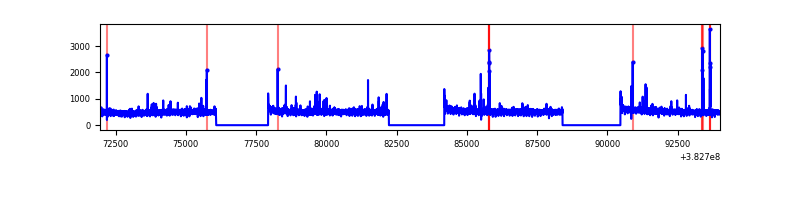 |
| B | 22067 | 16180 | 752 | 752 | 3.41% | 4.65% | 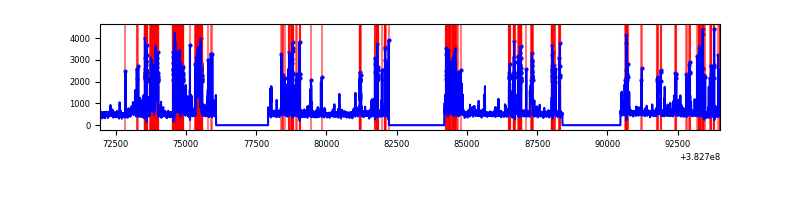 |
| C | 22067 | 16180 | 22 | 22 | 0.10% | 0.14% | 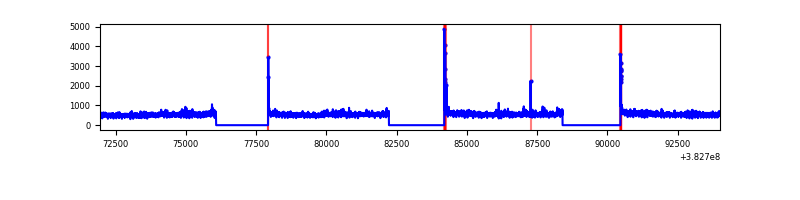 |
| D | 22067 | 16180 | 618 | 618 | 2.80% | 3.82% | 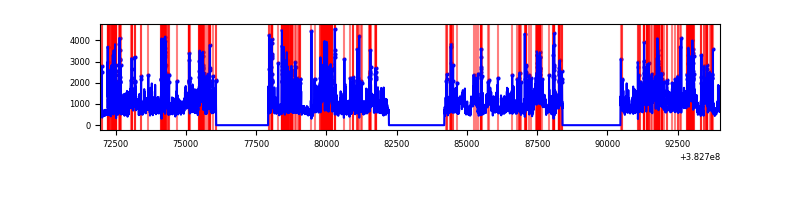 |
Top three noisy pixels from each quadrant. If the there are fewer than three noisy pixels in the level2.evt file, extra rows are filled as -1
| Pixel properties | Quadrant properties | ||||||
|---|---|---|---|---|---|---|---|
| Quadrant | DetID | PixID | Counts | Sigma | Mean | Median | Sigma |
| A | 9 | 143 | 136679 | 324.99 | 2092 | 2057 | 414.2 |
| A | 10 | 83 | 76746 | 180.31 | 2092 | 2057 | 414.2 |
| A | 4 | 48 | 27772 | 62.08 | 2092 | 2057 | 414.2 |
| B | 5 | 172 | 3061118 | 8118.04 | 2002 | 1957 | 376.8 |
| B | 0 | 245 | 156527 | 410.18 | 2002 | 1957 | 376.8 |
| B | 4 | 232 | 93946 | 244.11 | 2002 | 1957 | 376.8 |
| C | 15 | 214 | 667863 | 1439.65 | 2023 | 2041 | 462.5 |
| C | 14 | 67 | 299708 | 643.62 | 2023 | 2041 | 462.5 |
| C | 0 | 10 | 109312 | 231.94 | 2023 | 2041 | 462.5 |
| D | 8 | 195 | 5557604 | 11311.28 | 2010 | 1960 | 491.2 |
| D | 2 | 250 | 998892 | 2029.75 | 2010 | 1960 | 491.2 |
| D | 12 | 17 | 688768 | 1398.34 | 2010 | 1960 | 491.2 |
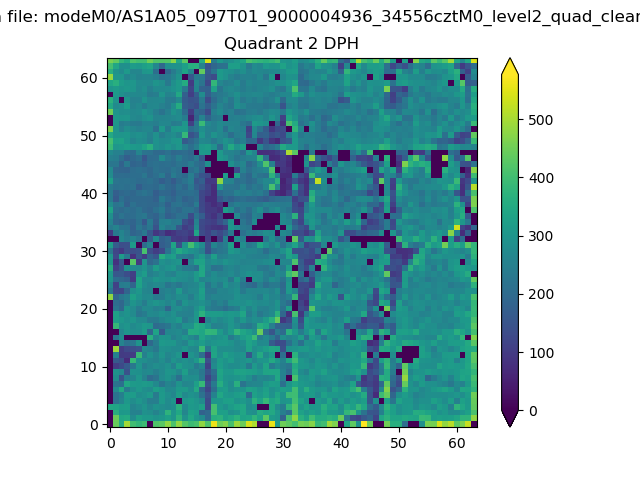
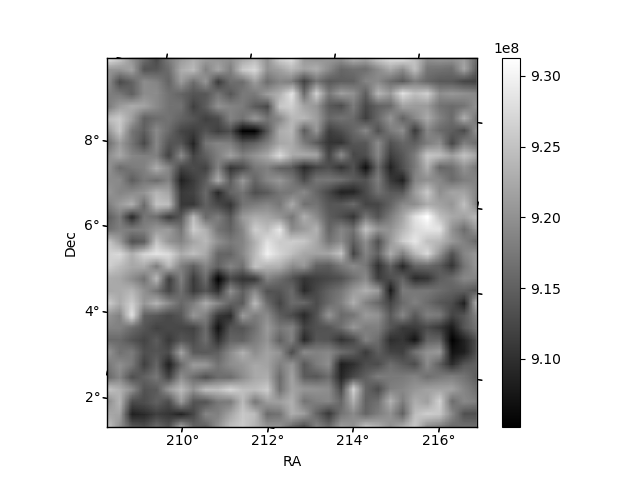
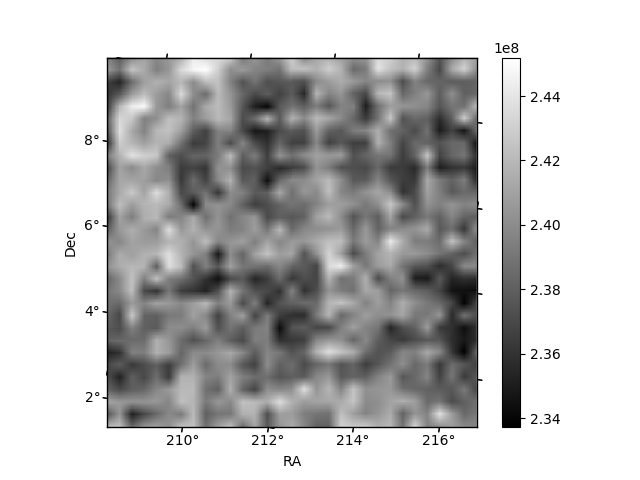
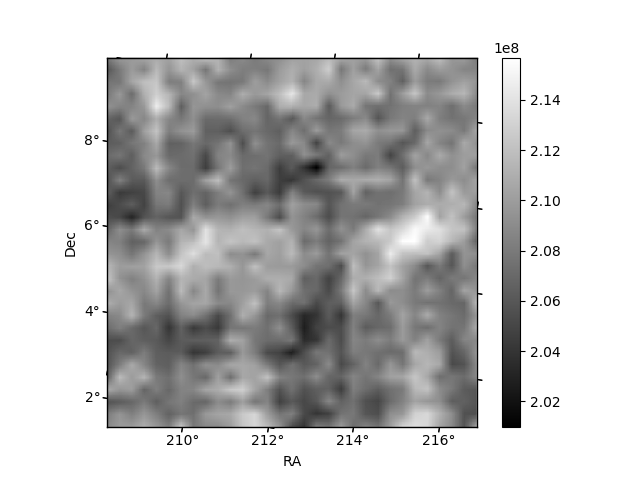
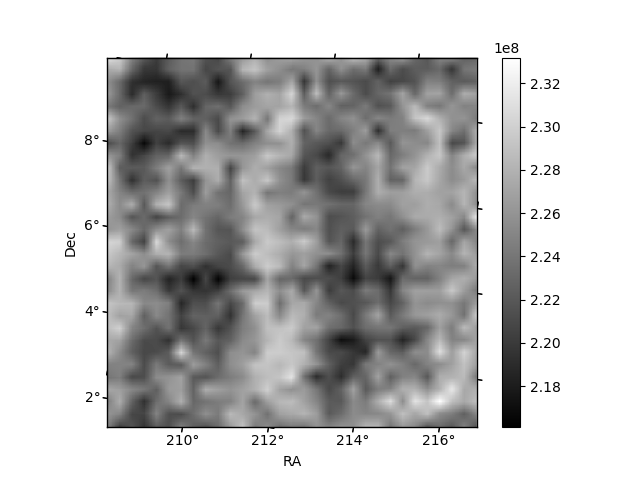
Histogram calculated using DETX and DETY for each event in the final _common_clean file
| Quadrant A | 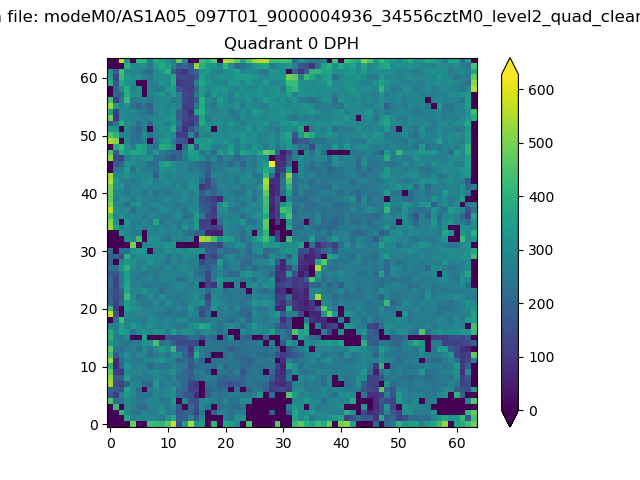 |
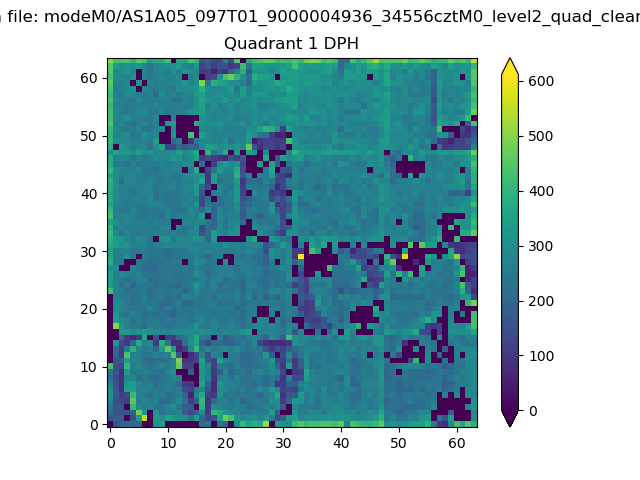 |
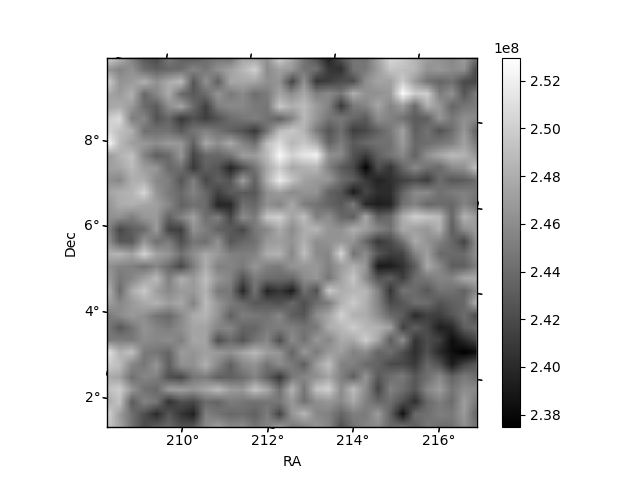
Quadrant B |
|---|---|---|---|
| Quadrant D | 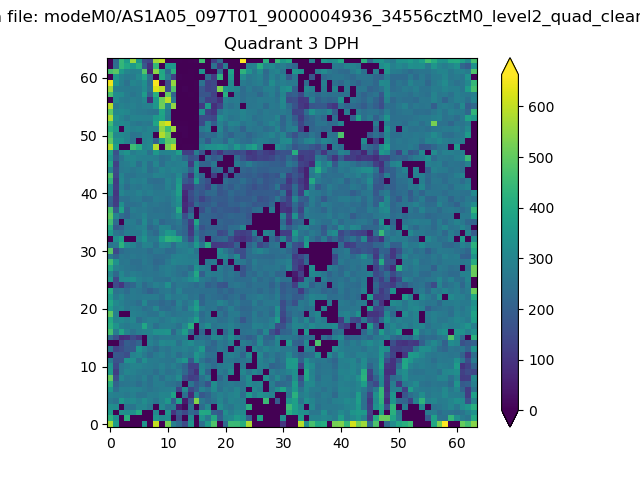 |
 |
Quadrant C |
| Plot type | Count rate plots | Images |
|---|---|---|
| Comparison with Poisson distribution Blue bars denote a histogram of data divided into 1 sec bins. Red curve is a Poisson curve with rate = median count rate of data. |
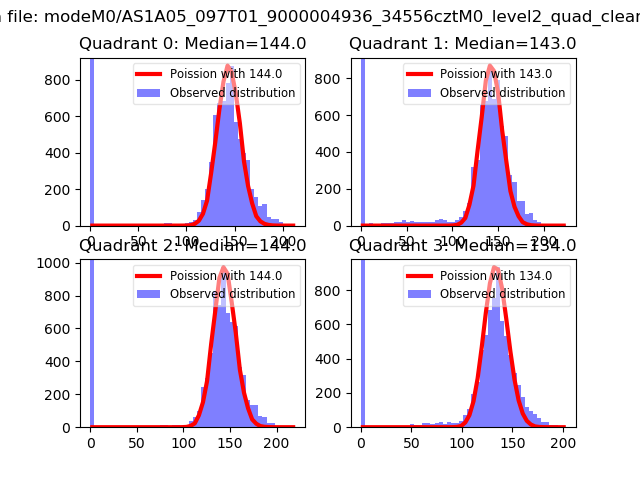 |
 |
| Quadrant-wise count rates Data is divided into 100 sec bins |
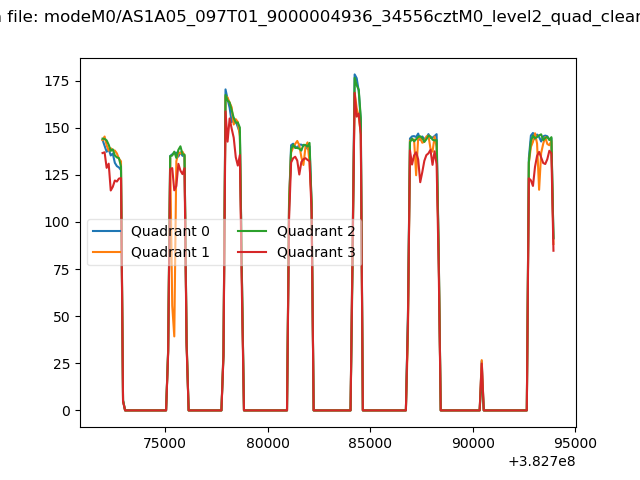 |
|
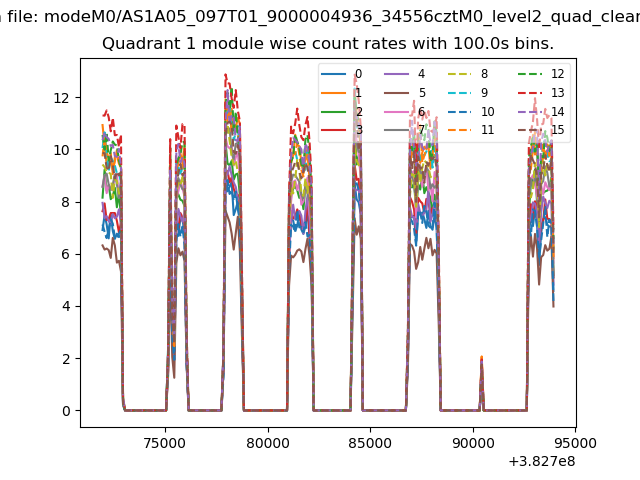
| Module-wise count rates for Quadrant A Data is divided into 100 sec bins |
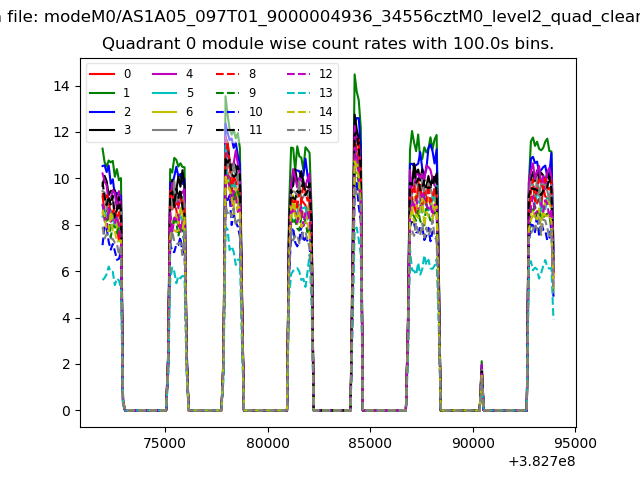 |
 |
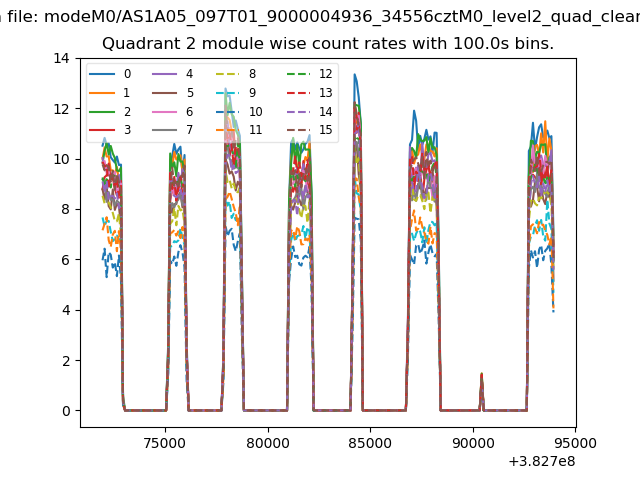
| Module-wise count rates for Quadrant B Data is divided into 100 sec bins |
 |
 |
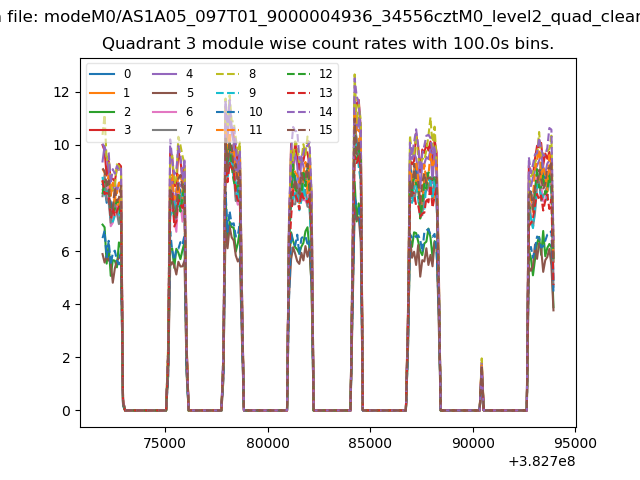
| Module-wise count rates for Quadrant C Data is divided into 100 sec bins |
 |
 |
| Module-wise count rates for Quadrant D Data is divided into 100 sec bins |
 |
 |
| Parameter | Plot |
|---|---|
| CZT HV Monitor |  |
| D_VDD | 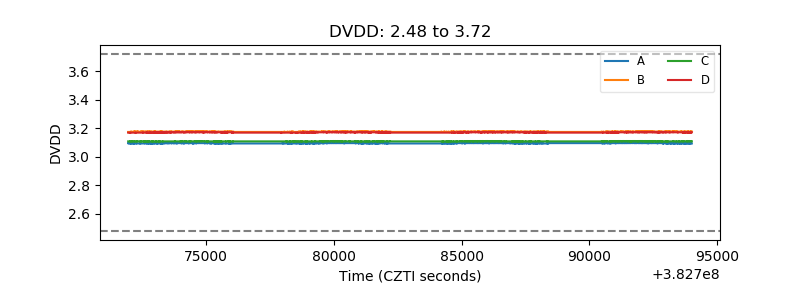 |
| Temperature 1 | 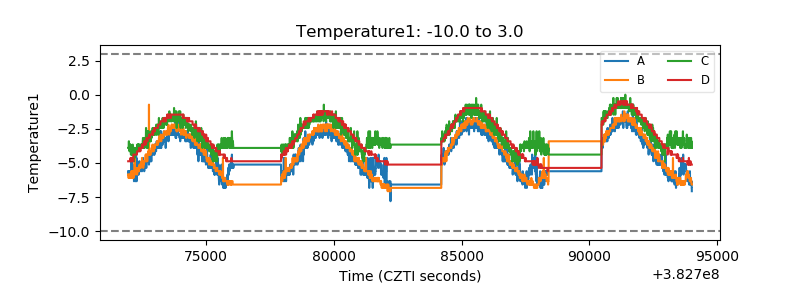 |
| Veto HV Monitor | 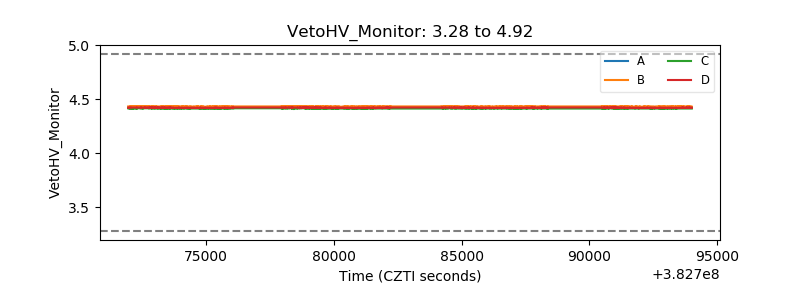 |
| Veto LLD | 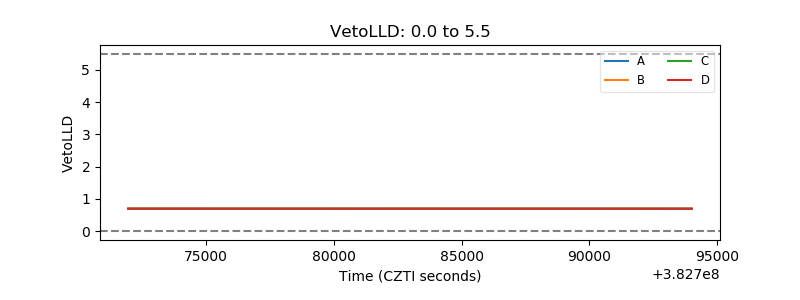 |
| Alpha Counter | 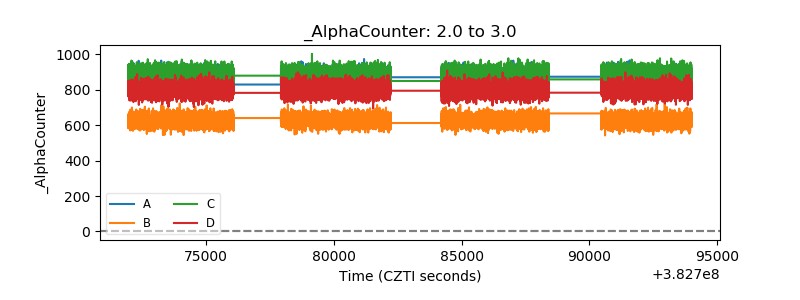 |
| _CPM_Rate | 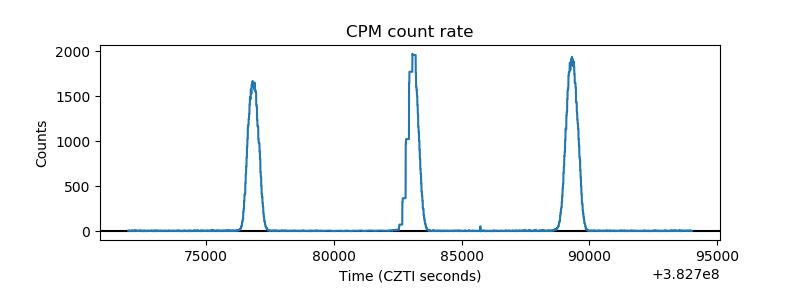 |
| CZT Counter | 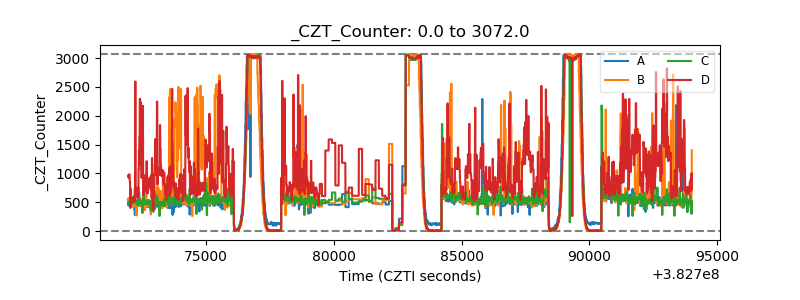 |
| +2.5 Volts monitor | 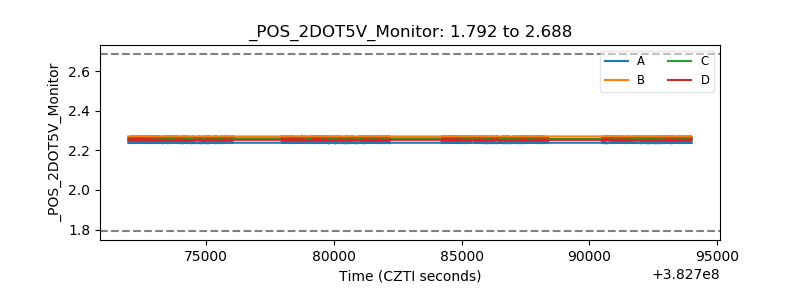 |
| +5 Volts monitor | 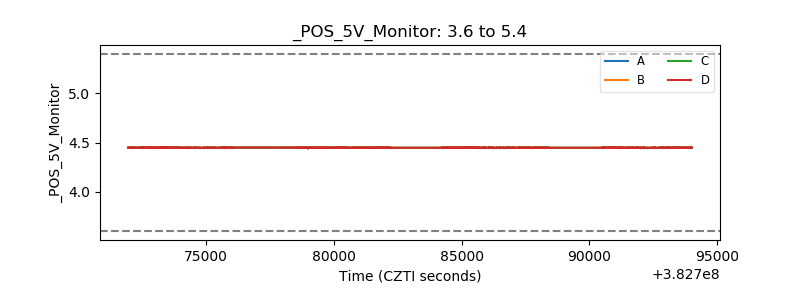 |
| _ROLL_ROT | 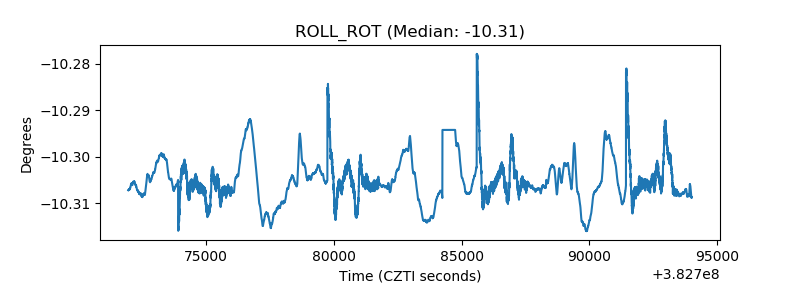 |
| _Roll_DEC | 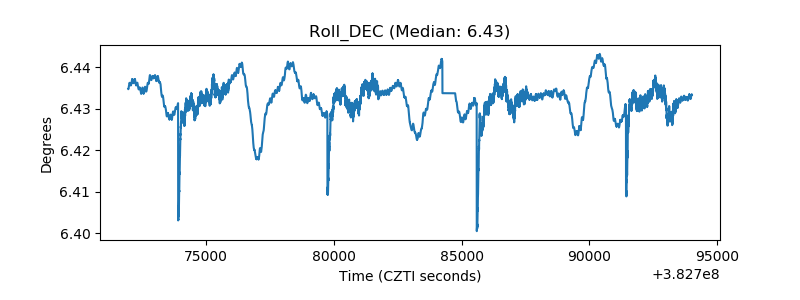 |
| _Roll_RA | 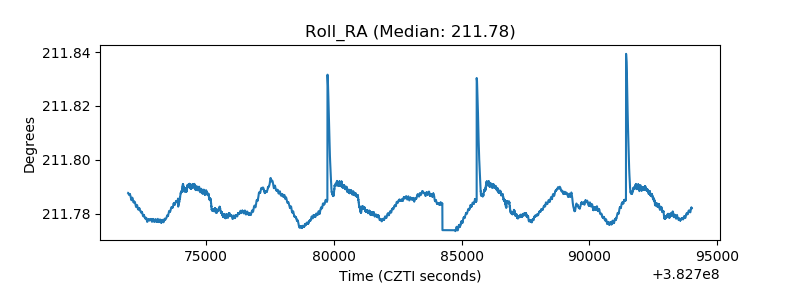 |
| Veto Counter | 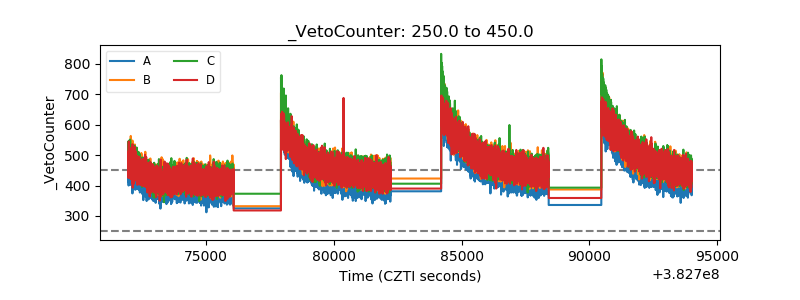 |