| Param | Original file | Final file |
|---|---|---|
| Filename | modeM0/AS1A05_097T01_9000004936_34550cztM0_level2.evt | modeM0/AS1A05_097T01_9000004936_34550cztM0_level2_quad_clean.evt |
| Size (bytes) | 480,337,920 | 60,598,080 |
| Size | 458.1 MB | 57.8 MB |
| Events in quadrant A | 2,459,414 | 380,766 |
| Events in quadrant B | 4,104,162 | 368,579 |
| Events in quadrant C | 2,672,102 | 386,217 |
| Events in quadrant D | 4,975,493 | 351,320 |
| Mode M0 | |||
|---|---|---|---|
| Quadrant | BADHDUFLAG | Total packets | Discarded packets |
| A | 0 | 10199 | 2 |
| B | 0 | 15238 | 1 |
| C | 0 | 10731 | 1 |
| D | 0 | 18430 | 1 |
| Mode SS | |||
|---|---|---|---|
| Quadrant | BADHDUFLAG | Total packets | Discarded packets |
| A | 0 | 100 | 0 |
| B | 0 | 100 | 0 |
| C | 0 | 100 | 0 |
| D | 0 | 100 | 0 |
| Mode M9 | |||
|---|---|---|---|
| Quadrant | BADHDUFLAG | Total packets | Discarded packets |
| A | 0 | 19 | 0 |
| B | 0 | 19 | 0 |
| C | 0 | 19 | 0 |
| D | 0 | 19 | 0 |
| Quadrant | Total seconds | Saturated seconds | Saturation percentage |
|---|---|---|---|
| A | 4960 | 6 | 0.120968% |
| B | 4960 | 644 | 12.983871% |
| C | 4960 | 6 | 0.120968% |
| D | 4960 | 296 | 5.967742% |
Noise dominated data is calculated using 1-second bins in cleaned event files. If a bin has >2000 counts, and if more than 50% of those come from <1% of pixels, then it is considered to be noise-dominated and hence unusable.
| Quadrant | # 1 sec bins | Bins with >0 counts | Bins with >2000 counts | High rate bins dominated by noise | Noise dominated (total time) | Noise dominated (detector-on time) | Marked lightcurve |
|---|---|---|---|---|---|---|---|
| A | 6814 | 4961 | 3 | 3 | 0.04% | 0.06% | 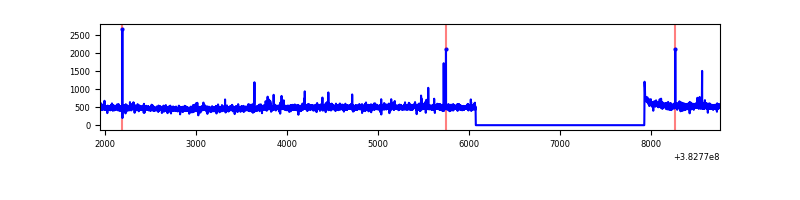 |
| B | 6814 | 4961 | 487 | 487 | 7.15% | 9.82% | 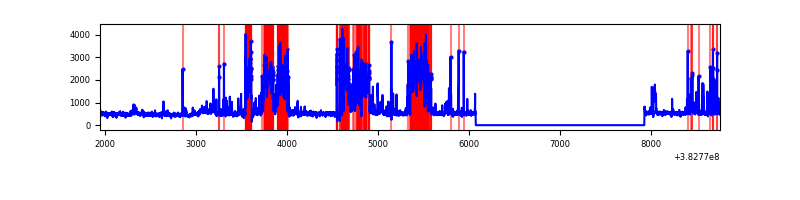 |
| C | 6814 | 4961 | 2 | 2 | 0.03% | 0.04% | 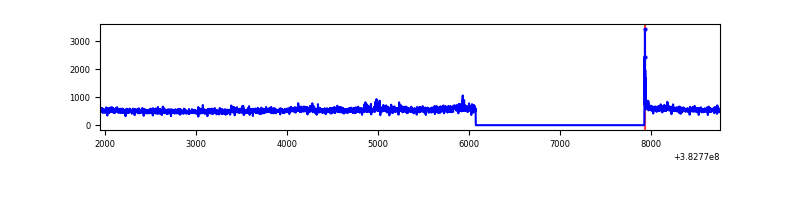 |
| D | 6814 | 4961 | 236 | 236 | 3.46% | 4.76% | 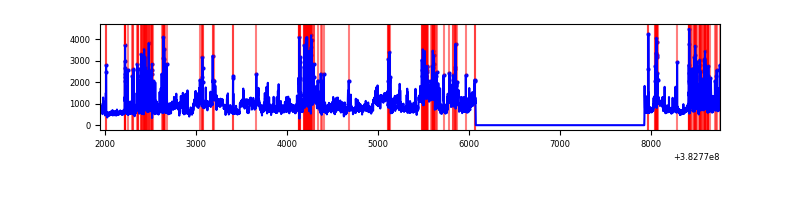 |
Top three noisy pixels from each quadrant. If the there are fewer than three noisy pixels in the level2.evt file, extra rows are filled as -1
| Pixel properties | Quadrant properties | ||||||
|---|---|---|---|---|---|---|---|
| Quadrant | DetID | PixID | Counts | Sigma | Mean | Median | Sigma |
| A | 10 | 83 | 24880 | 195.06 | 619 | 607 | 124.4 |
| A | 9 | 143 | 19909 | 155.11 | 619 | 607 | 124.4 |
| A | 4 | 48 | 14307 | 110.09 | 619 | 607 | 124.4 |
| B | 5 | 172 | 1696574 | 15165.61 | 573 | 559 | 111.8 |
| B | 5 | 200 | 55943 | 495.24 | 573 | 559 | 111.8 |
| B | 0 | 245 | 54105 | 478.8 | 573 | 559 | 111.8 |
| C | 15 | 214 | 206056 | 1480.67 | 600 | 604 | 138.8 |
| C | 14 | 67 | 105051 | 752.74 | 600 | 604 | 138.8 |
| C | 0 | 10 | 17442 | 121.35 | 600 | 604 | 138.8 |
| D | 8 | 195 | 1334768 | 9202.63 | 591 | 573 | 145.0 |
| D | 12 | 17 | 605007 | 4169.09 | 591 | 573 | 145.0 |
| D | 2 | 250 | 418581 | 2883.22 | 591 | 573 | 145.0 |
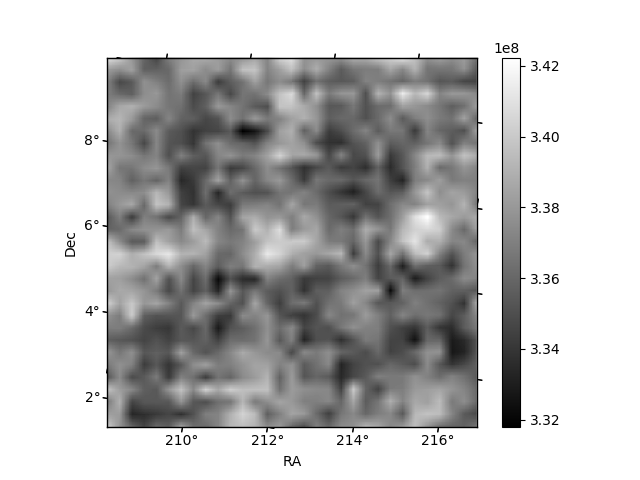
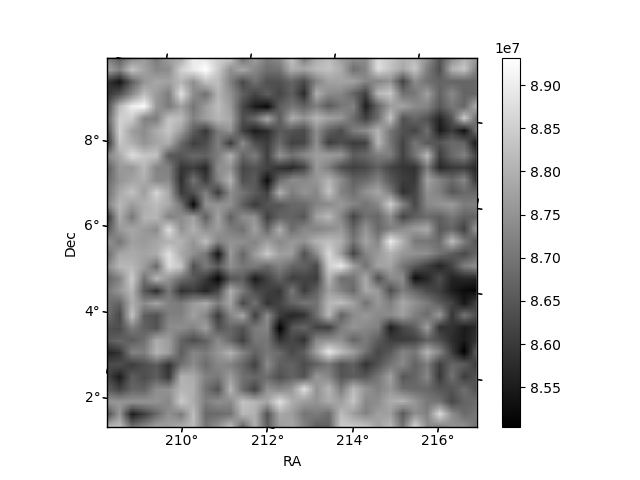
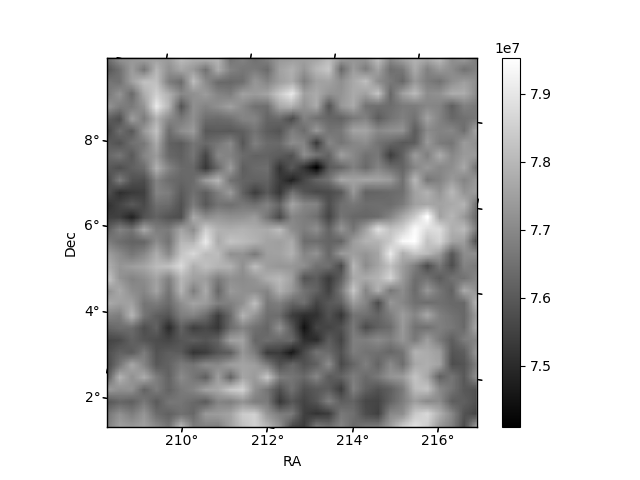
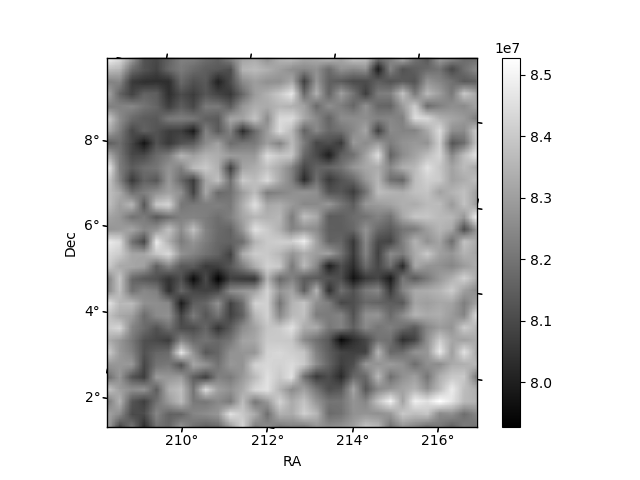
Histogram calculated using DETX and DETY for each event in the final _common_clean file
| Quadrant A | 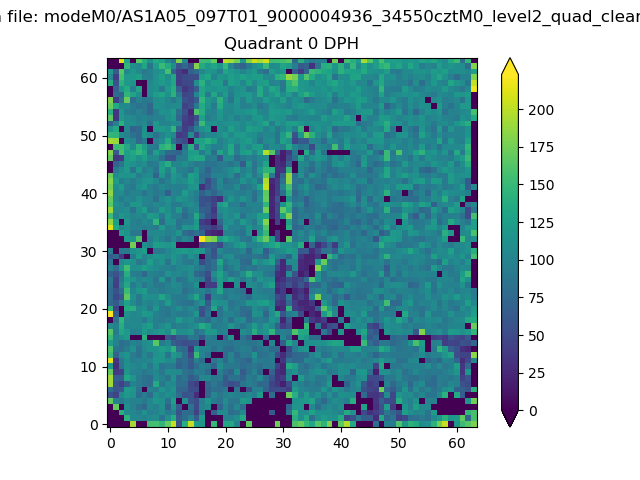 |
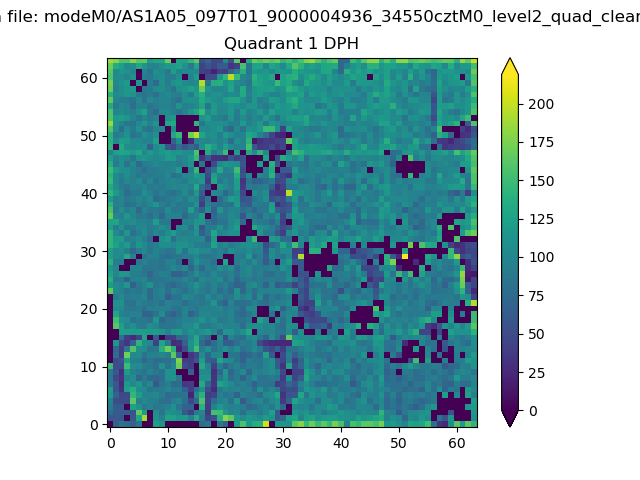 |
Quadrant B |
|---|---|---|---|
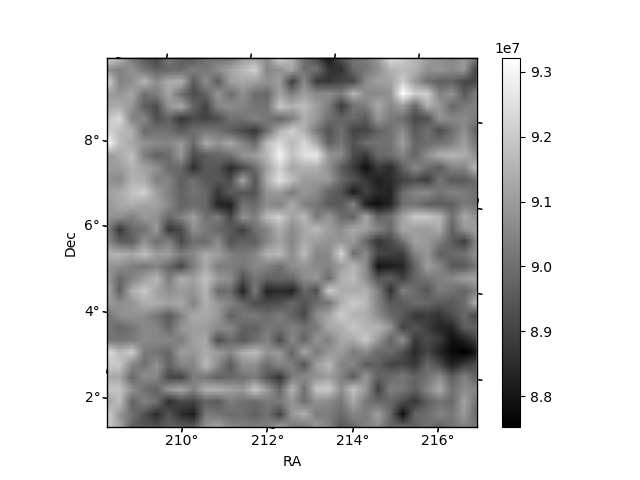
| Quadrant D | 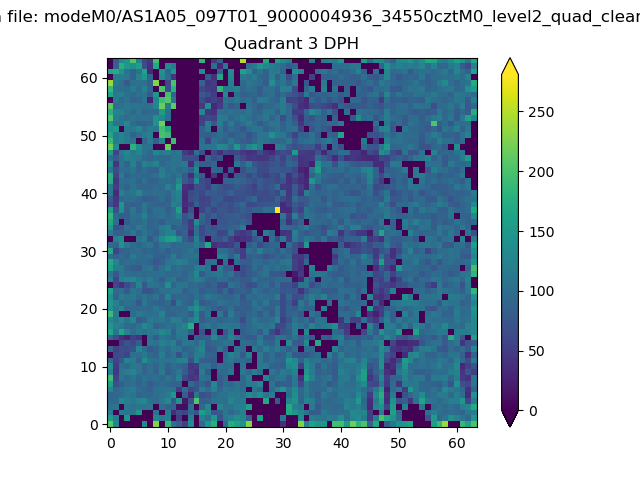 |
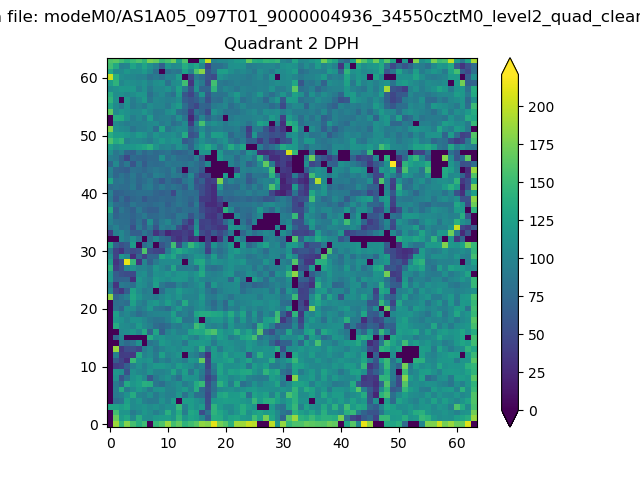 |
Quadrant C |
| Plot type | Count rate plots | Images |
|---|---|---|
| Comparison with Poisson distribution Blue bars denote a histogram of data divided into 1 sec bins. Red curve is a Poisson curve with rate = median count rate of data. |
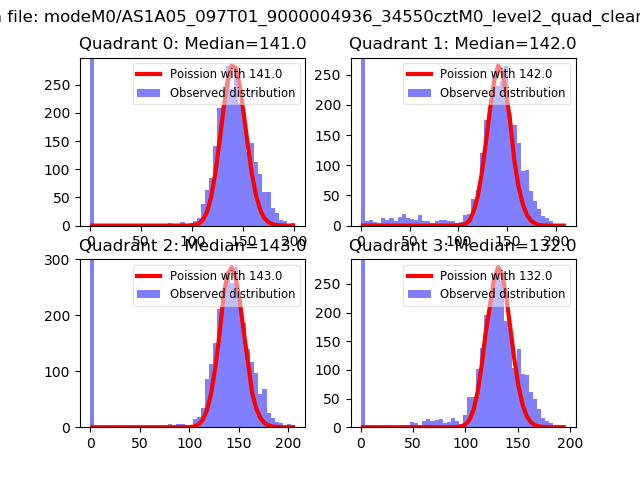 |
 |
| Quadrant-wise count rates Data is divided into 100 sec bins |
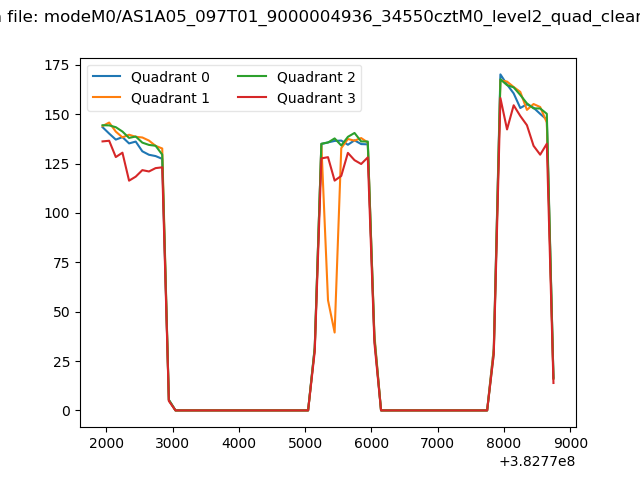 |
|
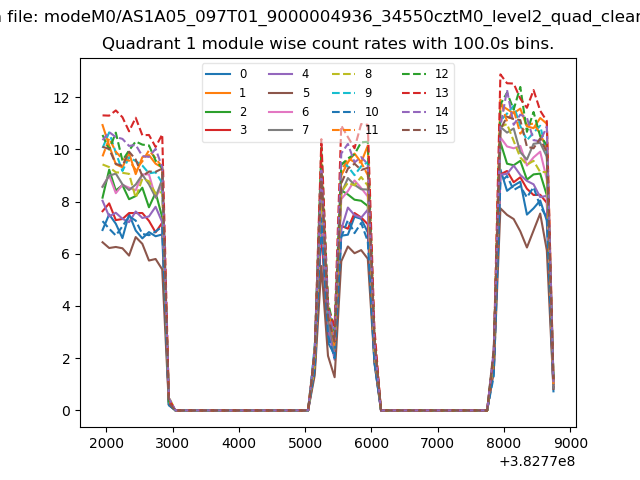
| Module-wise count rates for Quadrant A Data is divided into 100 sec bins |
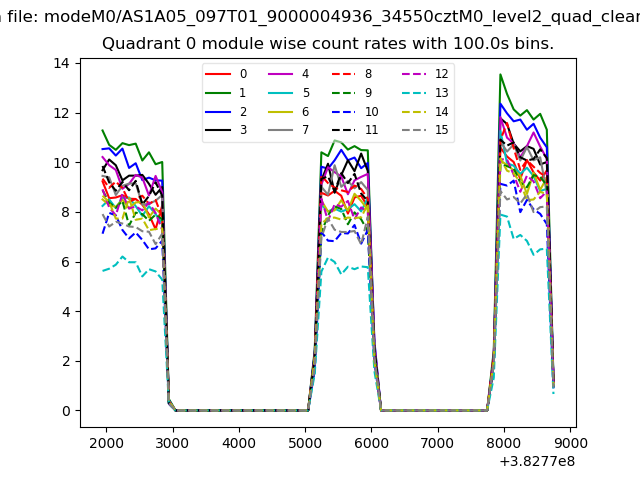 |
 |
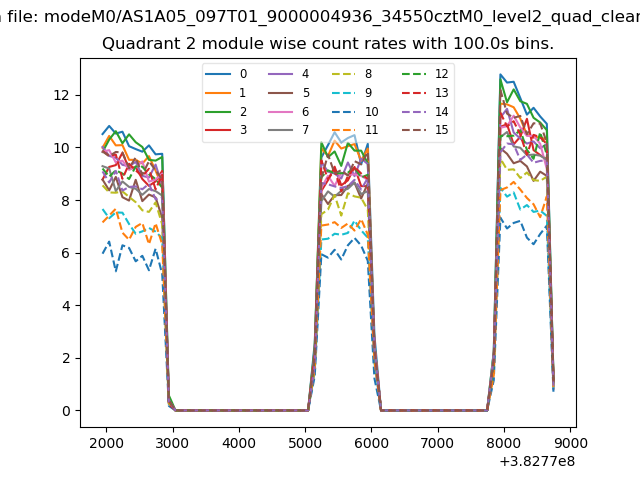
| Module-wise count rates for Quadrant B Data is divided into 100 sec bins |
 |
 |
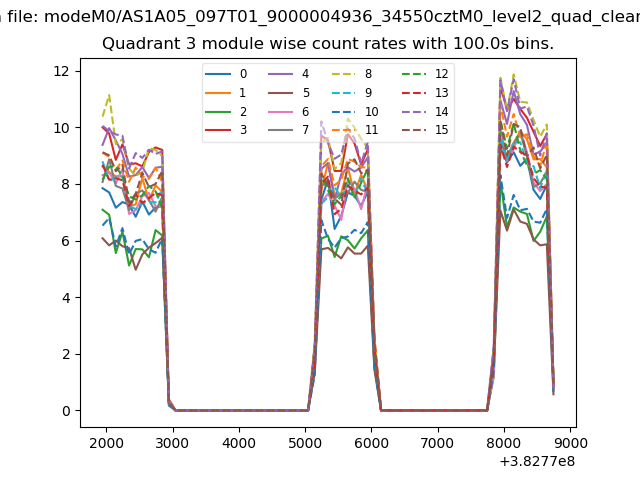
| Module-wise count rates for Quadrant C Data is divided into 100 sec bins |
 |
 |
| Module-wise count rates for Quadrant D Data is divided into 100 sec bins |
 |
 |
| Parameter | Plot |
|---|---|
| CZT HV Monitor | 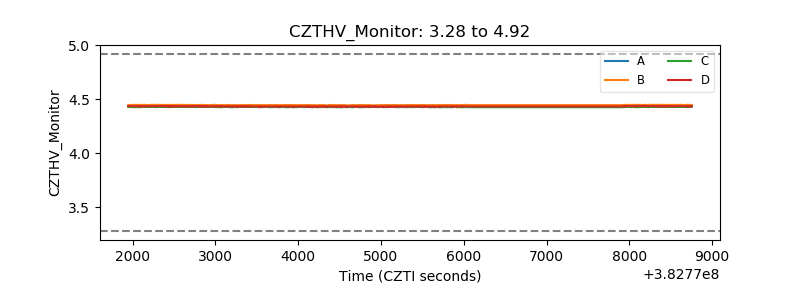 |
| D_VDD | 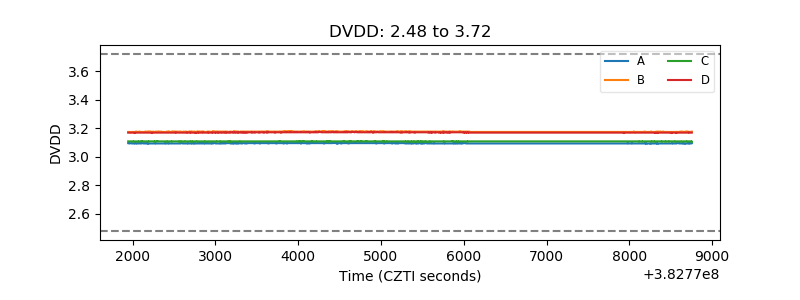 |
| Temperature 1 | 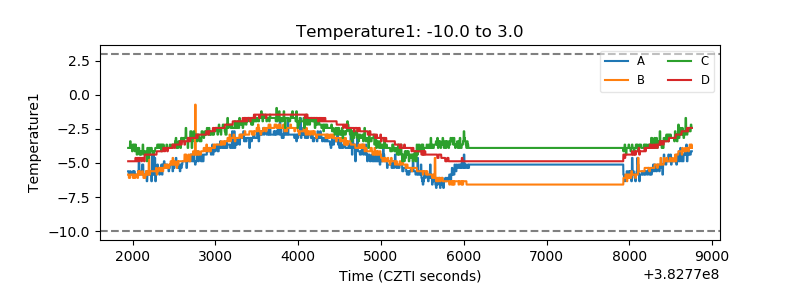 |
| Veto HV Monitor | 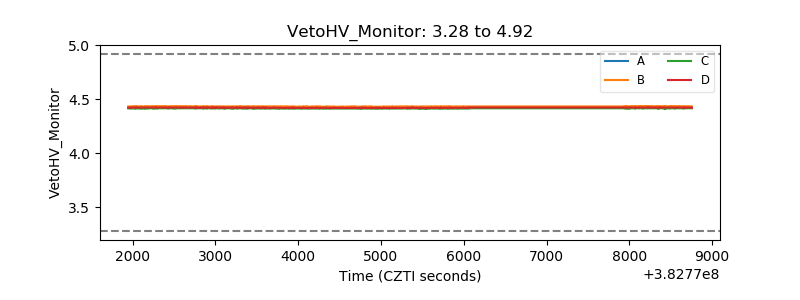 |
| Veto LLD | 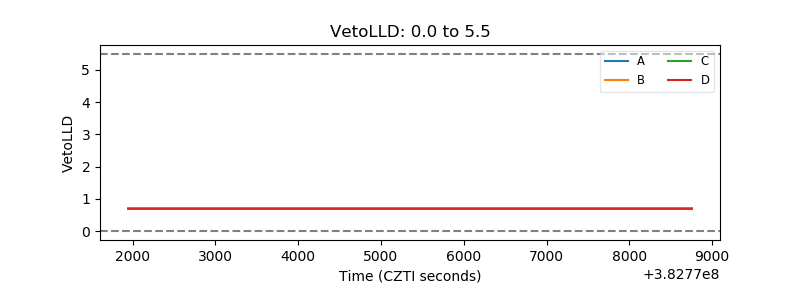 |
| Alpha Counter | 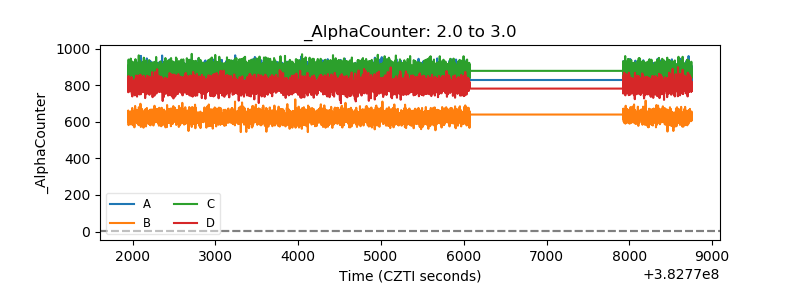 |
| _CPM_Rate | 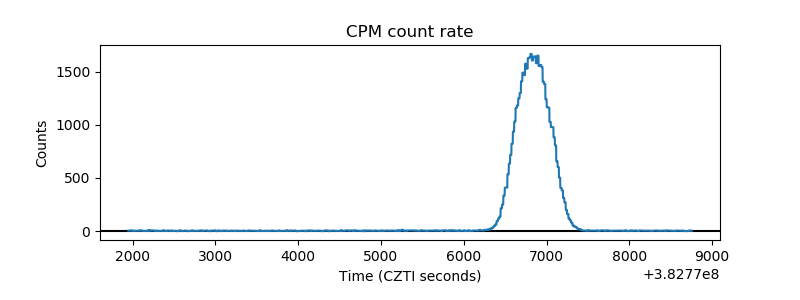 |
| CZT Counter | 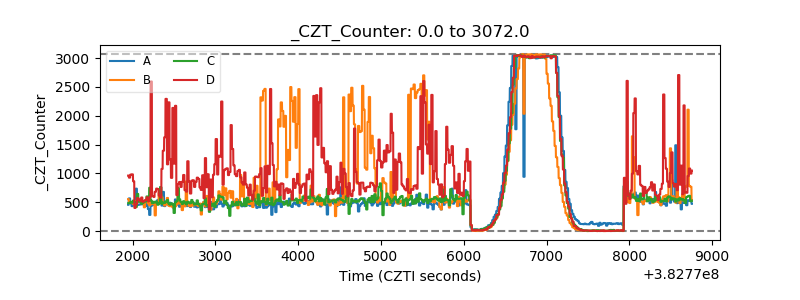 |
| +2.5 Volts monitor | 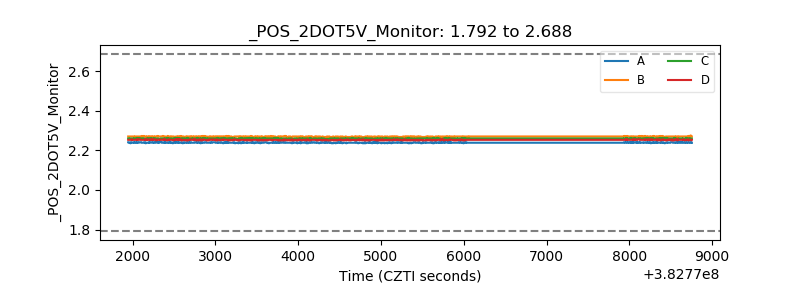 |
| +5 Volts monitor | 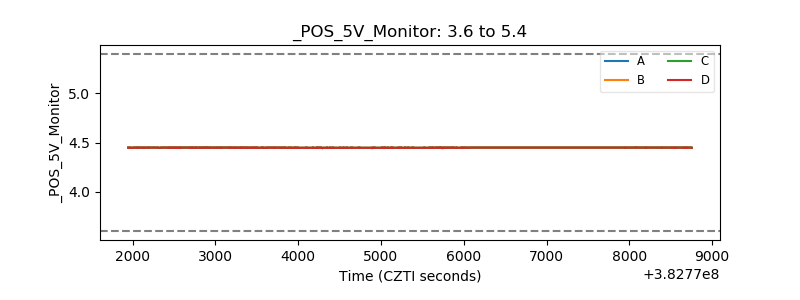 |
| _ROLL_ROT | 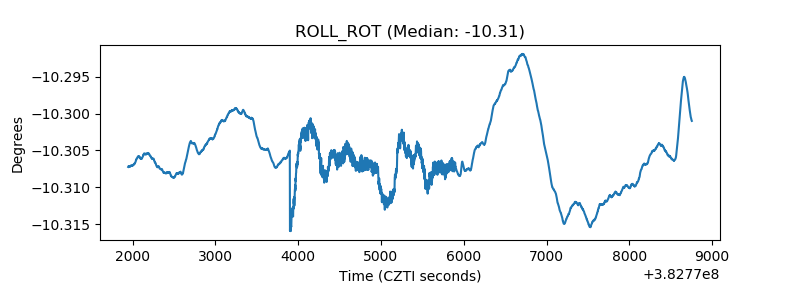 |
| _Roll_DEC | 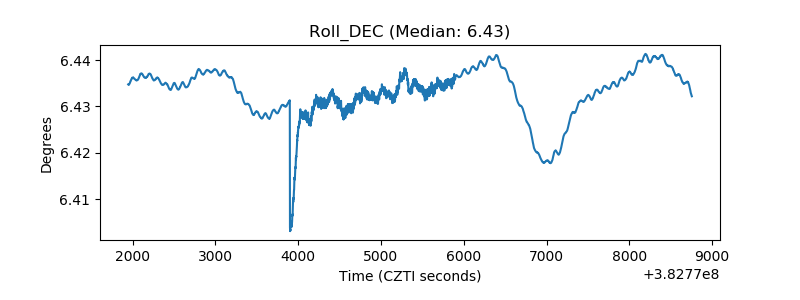 |
| _Roll_RA | 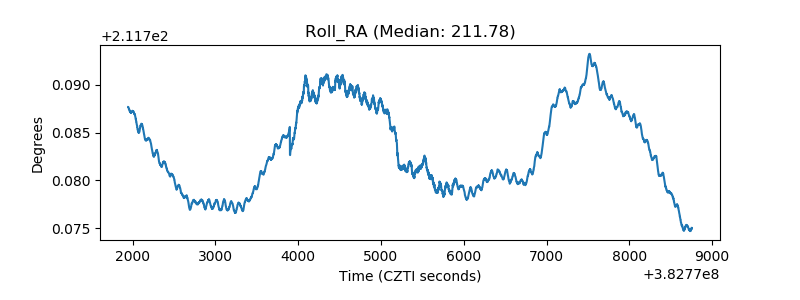 |
| Veto Counter | 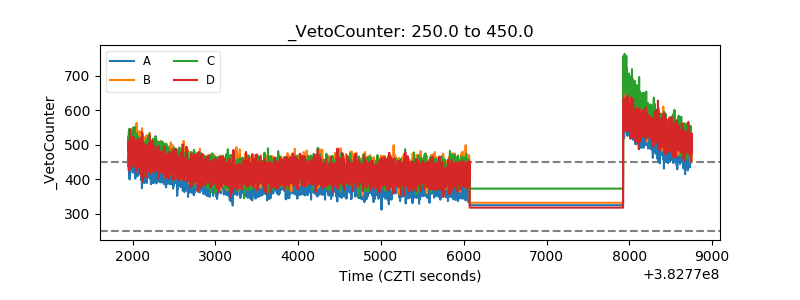 |